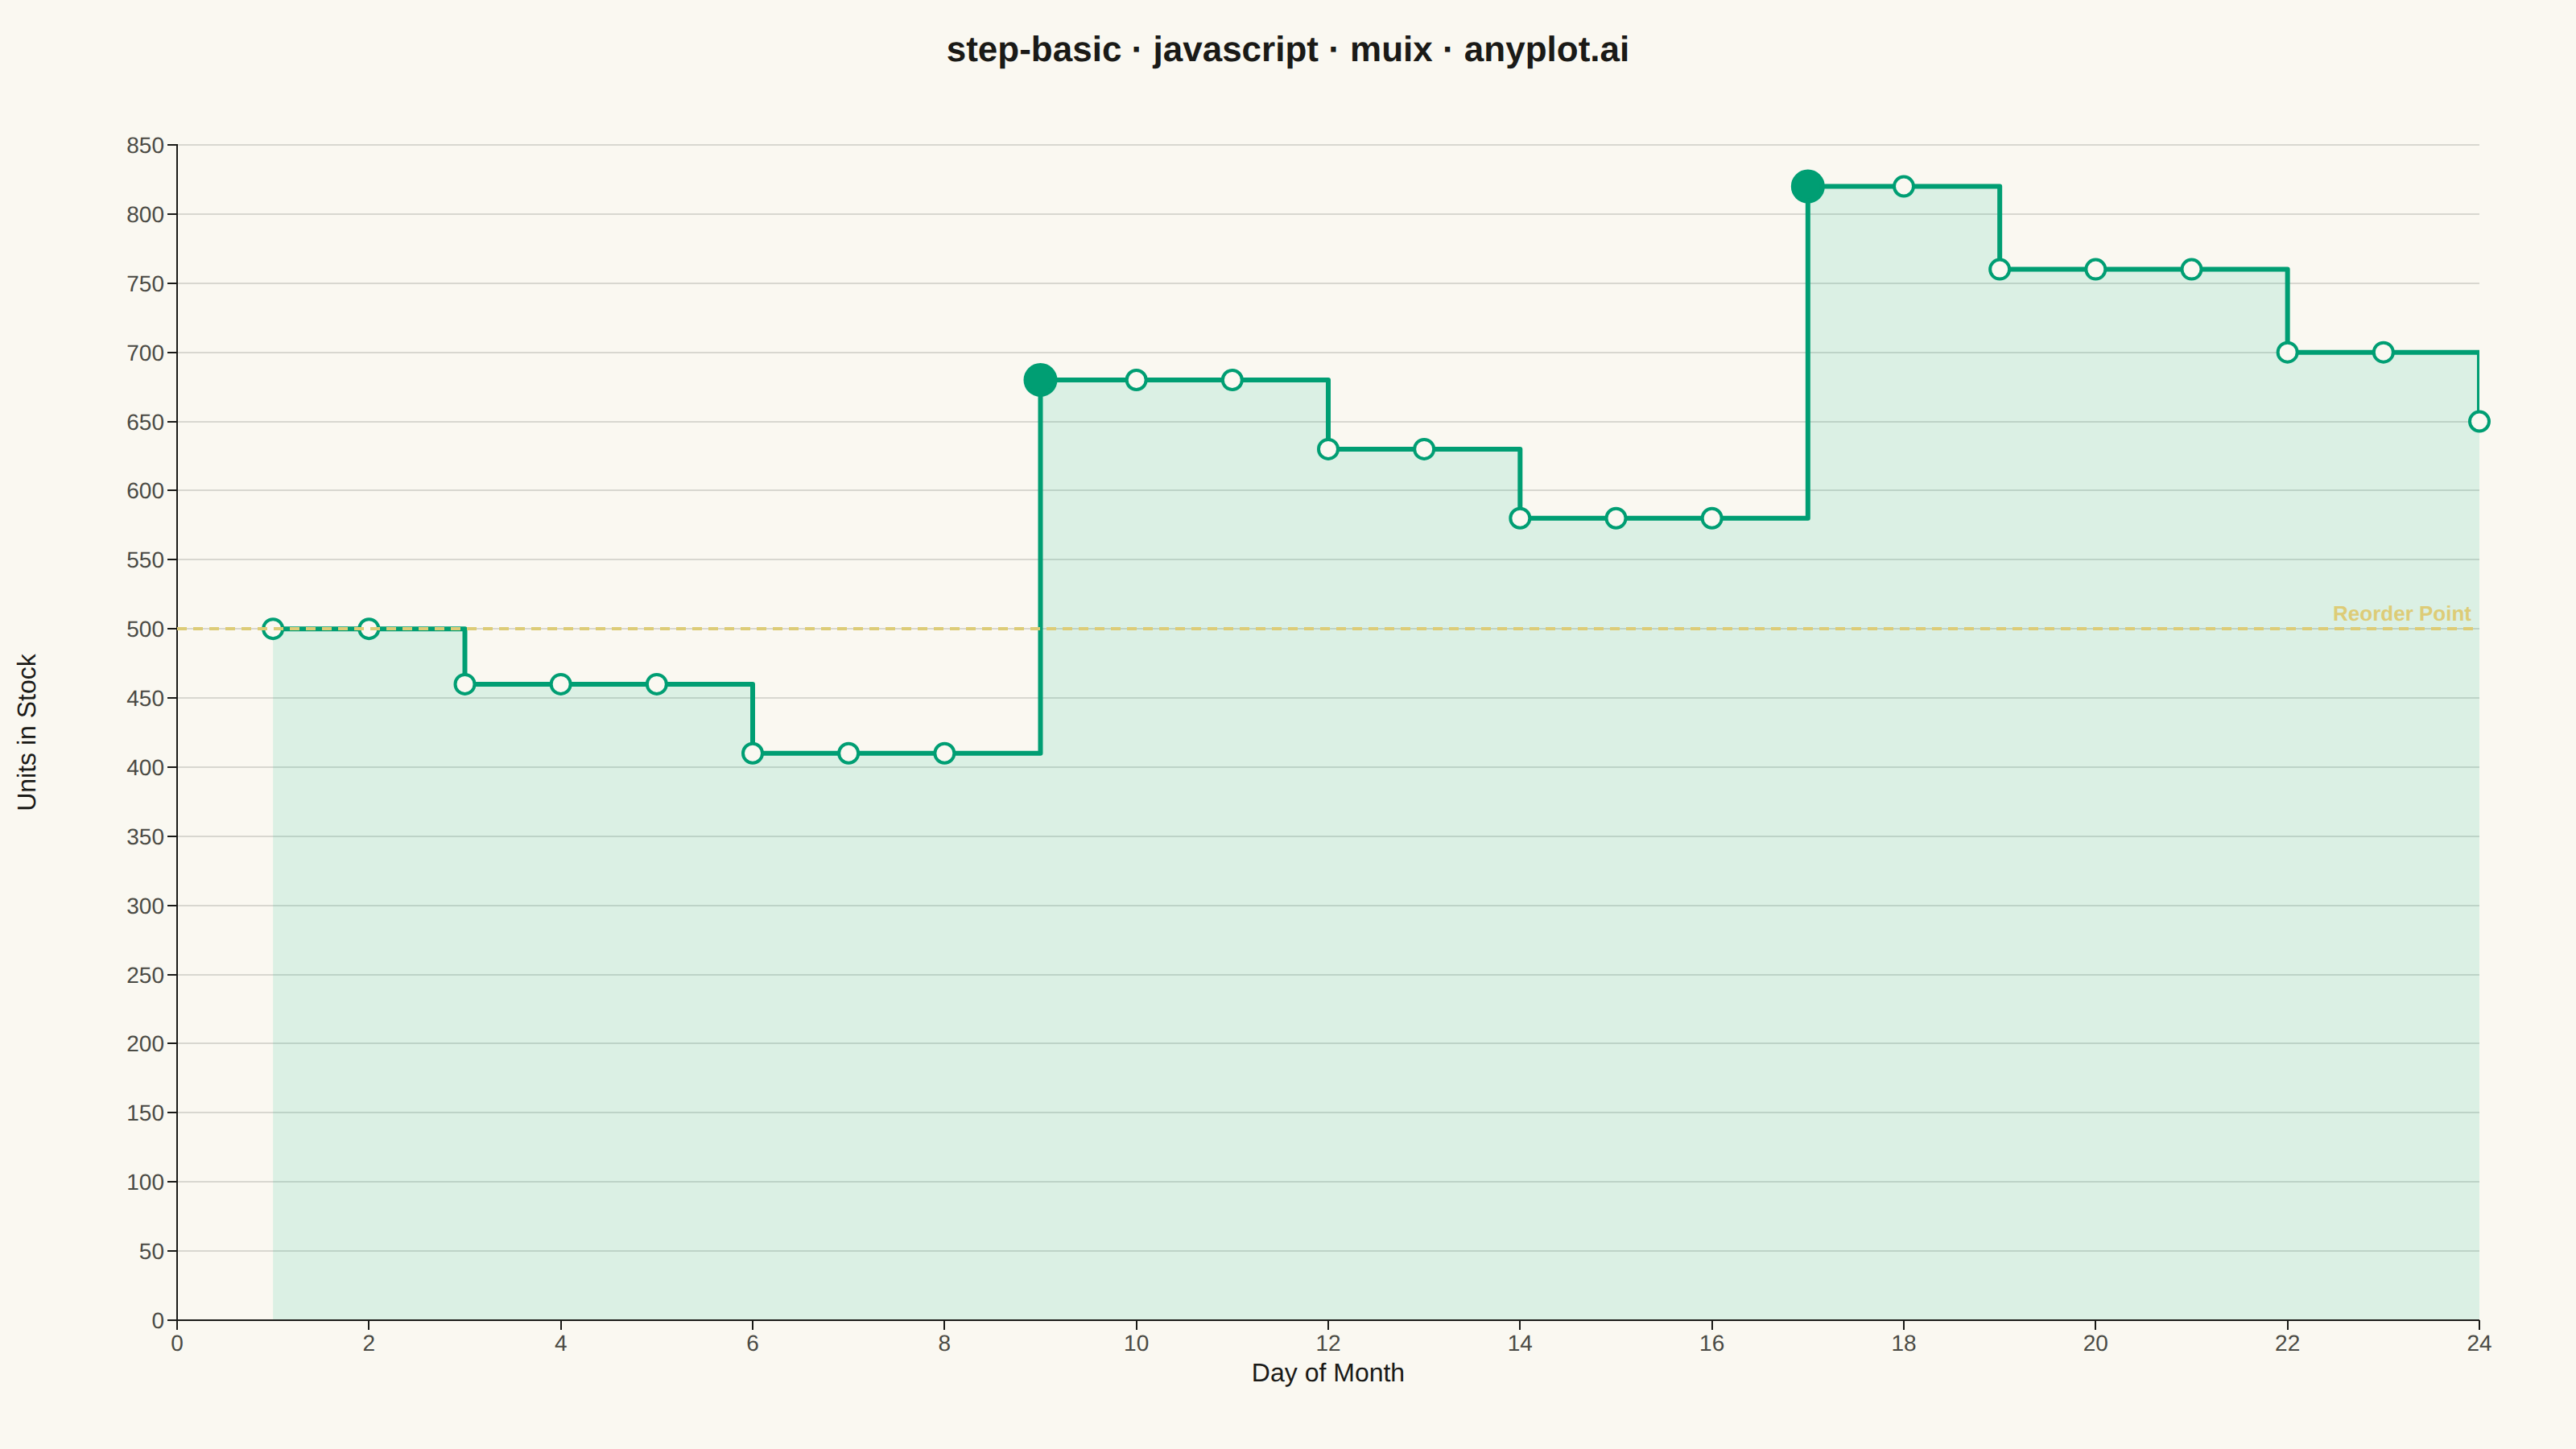
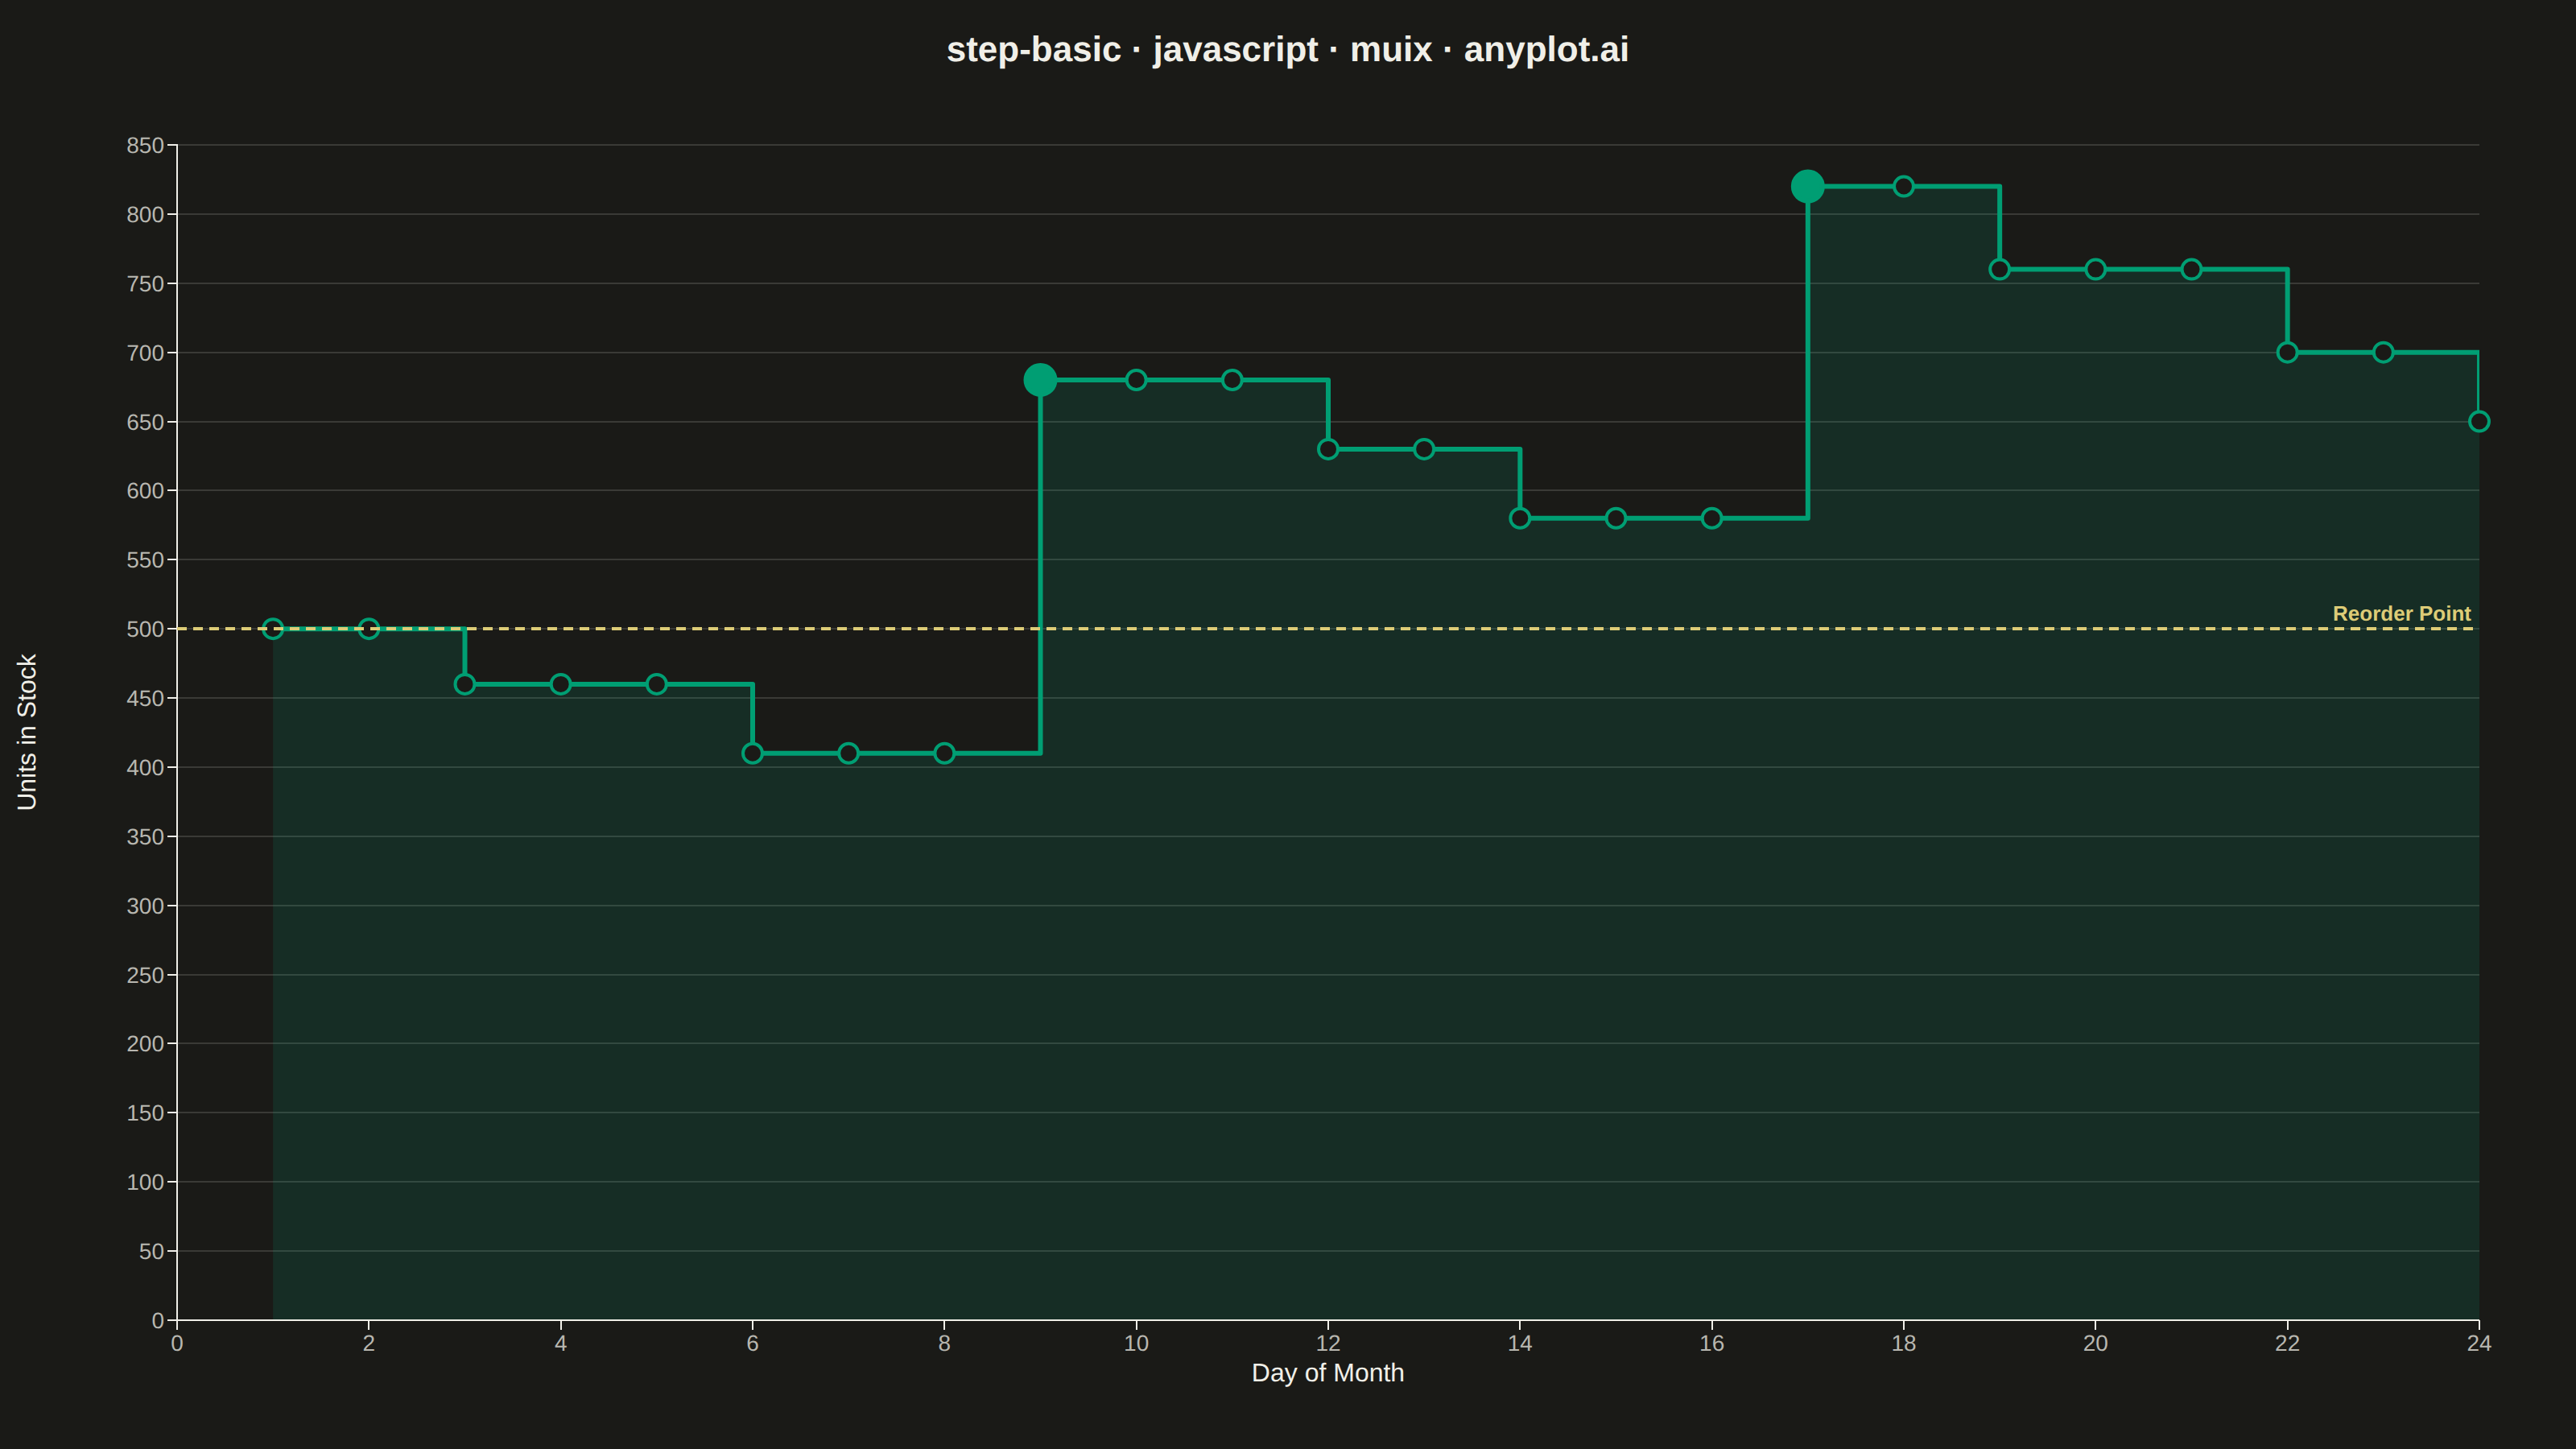
The same plot in 14 other libraries — JavaScript: Chart.js, D3.js, Apache ECharts, Highcharts; Python: Altair, Bokeh, lets-plot, Matplotlib, Plotly, plotnine, Pygal, Seaborn; R: ggplot2; Julia: Makie.jl. Compare all 15 side by side: Basic Step Plot in Python, R, Julia and JavaScript.
A step plot (also known as a stair plot or stepped line chart) displays data using horizontal lines connected by vertical lines, creating a stair-step pattern. Unlike line charts that interpolate between points, step plots show values as constant until the next change occurs. This makes them ideal for visualizing data that changes at discrete intervals, emphasizing the exact moments when values change.
// anyplot.ai
// step-basic: Basic Step Plot
// Library: muix 7.29.1 | JavaScript 22.23.1
// Quality: 93/100 | Created: 2026-07-25

import { LineChart } from "@mui/x-charts/LineChart";
import { ChartsReferenceLine } from "@mui/x-charts/ChartsReferenceLine";
import Box from "@mui/material/Box";
import Typography from "@mui/material/Typography";

const t = window.ANYPLOT_TOKENS;
const sz = window.ANYPLOT_SIZE;

// --- Data (in-memory, deterministic) ---------------------------------------
// Warehouse inventory level, sampled daily over a month. Stock holds
// constant between restock/shipment events, then jumps or drops on the
// event day — a textbook "stepAfter" pattern (the reported value applies
// from the current day until the next reading).
const days = Array.from({ length: 24 }, (_, i) => i + 1);
const unitsInStock = [
  500, 500, 460, 460, 460, 410, 410, 410, 680, 680, 680, 630, 630, 580, 580,
  580, 820, 820, 760, 760, 760, 700, 700, 650,
];
const REORDER_POINT = 500;

// The two largest restock jumps (day 9: 410 -> 680, day 17: 580 -> 820) get a
// bigger, filled marker so the chart's story reads at a glance instead of a
// uniform row of small dots.
const EVENT_INDICES = [8, 16];

function EventMark({ x, y, color, dataIndex }) {
  const isEvent = EVENT_INDICES.includes(dataIndex);
  return (
    <circle
      cx={x}
      cy={y}
      r={isEvent ? 9 : 6}
      fill={isEvent ? color : t.pageBg}
      stroke={color}
      strokeWidth={isEvent ? 3 : 2}
    />
  );
}

const margin = { top: 90, bottom: 80, left: 110, right: 60 };

// --- Chart (default-exported component — the harness mounts it) -------------
export default function Chart() {
  return (
    <Box sx={{ position: "relative", width: sz.width, height: sz.height }}>
      <Typography
        sx={{
          position: "absolute",
          top: 14,
          left: 0,
          right: 0,
          textAlign: "center",
          color: t.ink,
          fontSize: 22,
          fontWeight: 600,
          zIndex: 1,
          pointerEvents: "none",
        }}
      >
        step-basic · javascript · muix · anyplot.ai
      </Typography>

      {/* Rotated y-axis label, centered on the drawing area — rendered
          manually because ChartsYAxis positions its built-in `label` from
          `tickFontSize` rather than the tick labels' measured width, which
          overlaps 3-digit tick numbers at this font size. */}
      <Box
        sx={{
          position: "absolute",
          left: 4,
          top: margin.top,
          height: sz.height - margin.top - margin.bottom,
          width: 28,
          display: "flex",
          alignItems: "center",
          justifyContent: "center",
          pointerEvents: "none",
        }}
      >
        <Typography sx={{ transform: "rotate(-90deg)", whiteSpace: "nowrap", color: t.ink, fontSize: 16 }}>
          Units in Stock
        </Typography>
      </Box>

      <LineChart
        width={sz.width}
        height={sz.height}
        skipAnimation
        margin={margin}
        colors={[t.palette[0]]}
        grid={{ horizontal: true }}
        sx={{
          "& .MuiLineElement-root": { strokeWidth: 3 },
          "& .MuiAreaElement-root": { fillOpacity: 0.12 },
        }}
        xAxis={[
          {
            data: days,
            label: "Day of Month",
            scaleType: "linear",
            tickNumber: 12,
            labelStyle: { fontSize: 16, fill: t.ink },
            tickLabelStyle: { fontSize: 14, fill: t.inkSoft },
          },
        ]}
        yAxis={[
          {
            min: 0,
            tickLabelStyle: { fontSize: 14, fill: t.inkSoft },
          },
        ]}
        series={[
          {
            data: unitsInStock,
            label: "Warehouse Inventory",
            curve: "stepAfter",
            showMark: true,
            area: true,
          },
        ]}
        slots={{ mark: EventMark }}
        slotProps={{ legend: { hidden: true } }}
      >
        <ChartsReferenceLine
          y={REORDER_POINT}
          label="Reorder Point"
          labelAlign="end"
          lineStyle={{ stroke: t.amber, strokeDasharray: "6 4", strokeWidth: 2 }}
          labelStyle={{ fontSize: 13, fontWeight: 600, fill: t.amber }}
        />
      </LineChart>
    </Box>
  );
}
Runnable source as JSON, for any HTTP client: https://api.anyplot.ai/specs/step-basic/muix/code. Any spec id and library id listed in llms-full.txt fit the same URL shape; every URL below is complete and callable.
{
  "spec_id": "step-basic",
  "language": "javascript",
  "library": "muix",
  "page": "https://anyplot.ai/step-basic/javascript/muix",
  "hub": "https://anyplot.ai/step-basic",
  "code_json": "https://api.anyplot.ai/specs/step-basic/muix/code",
  "spec_json": "https://api.anyplot.ai/specs/step-basic",
  "render_light_png": "https://storage.googleapis.com/anyplot-images/plots/step-basic/javascript/muix/plot-light.png",
  "render_dark_png": "https://storage.googleapis.com/anyplot-images/plots/step-basic/javascript/muix/plot-dark.png",
  "interactive_light_html": "https://storage.googleapis.com/anyplot-images/plots/step-basic/javascript/muix/plot-light.html",
  "interactive_dark_html": "https://storage.googleapis.com/anyplot-images/plots/step-basic/javascript/muix/plot-dark.html",
  "quality_score": 93.0,
  "license": "MIT",
  "guide": "https://anyplot.ai/llms.txt"
}
Part of Basic Step Plot on anyplot.ai.