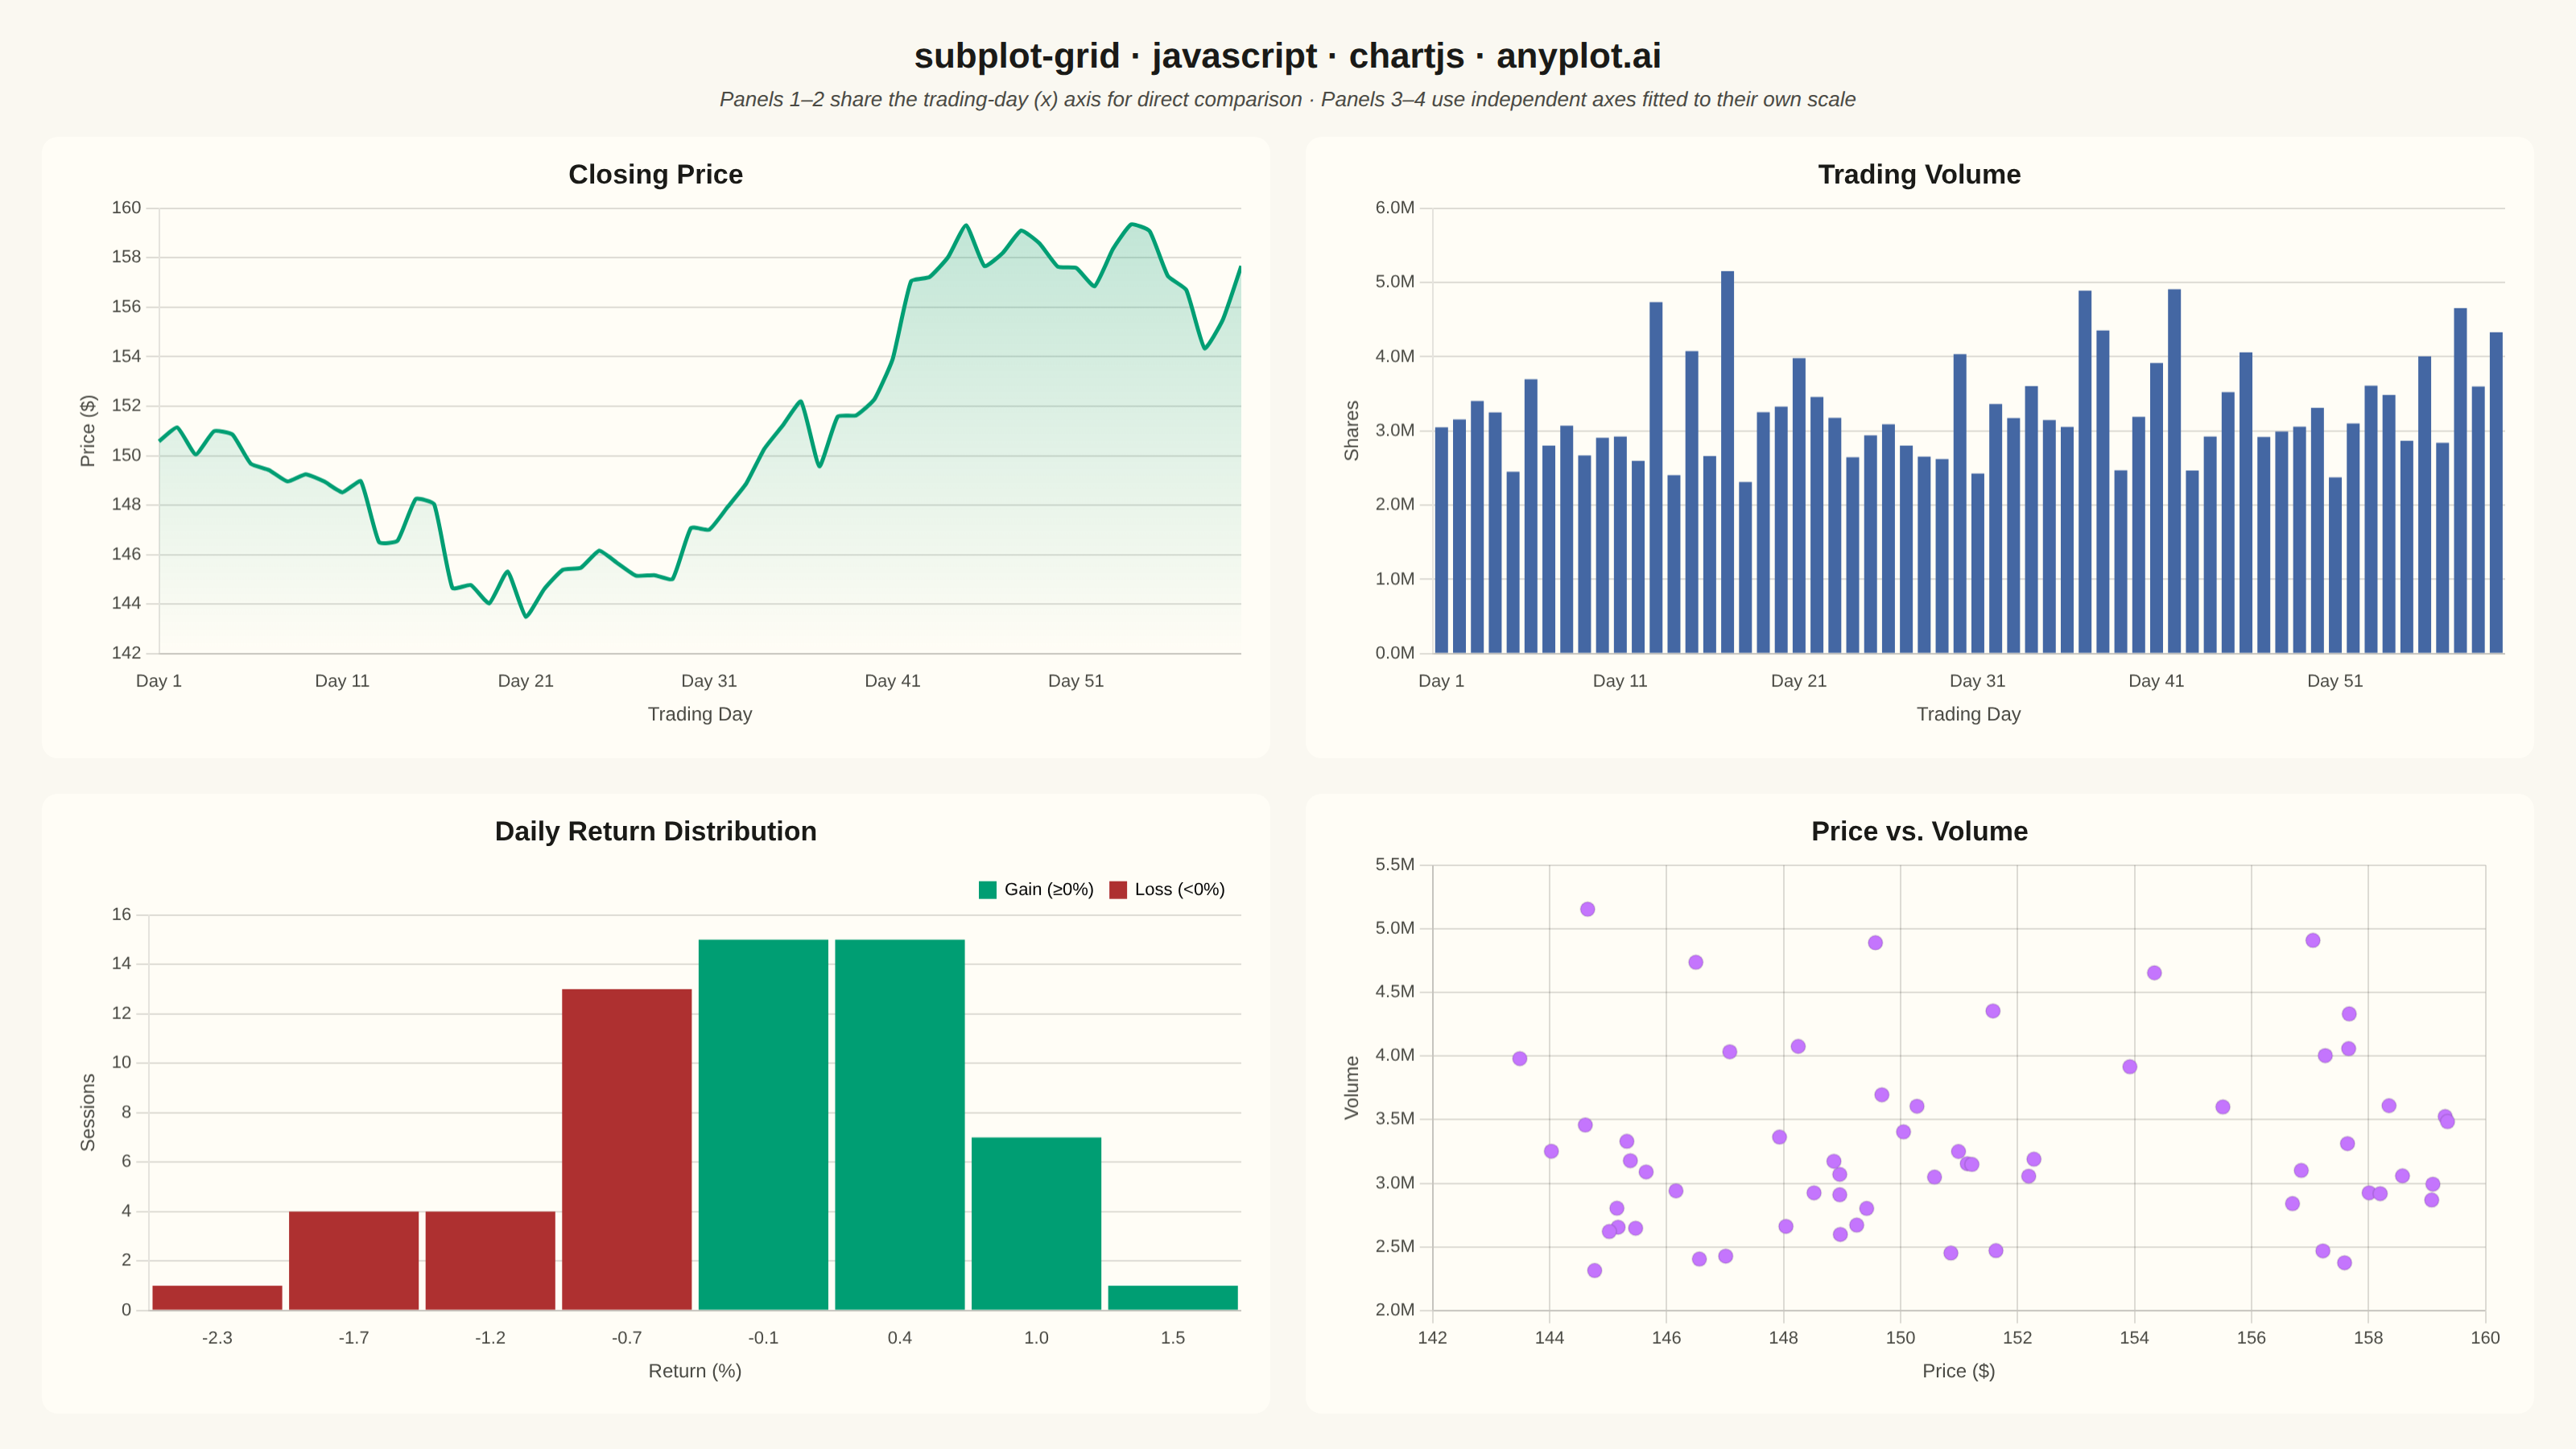
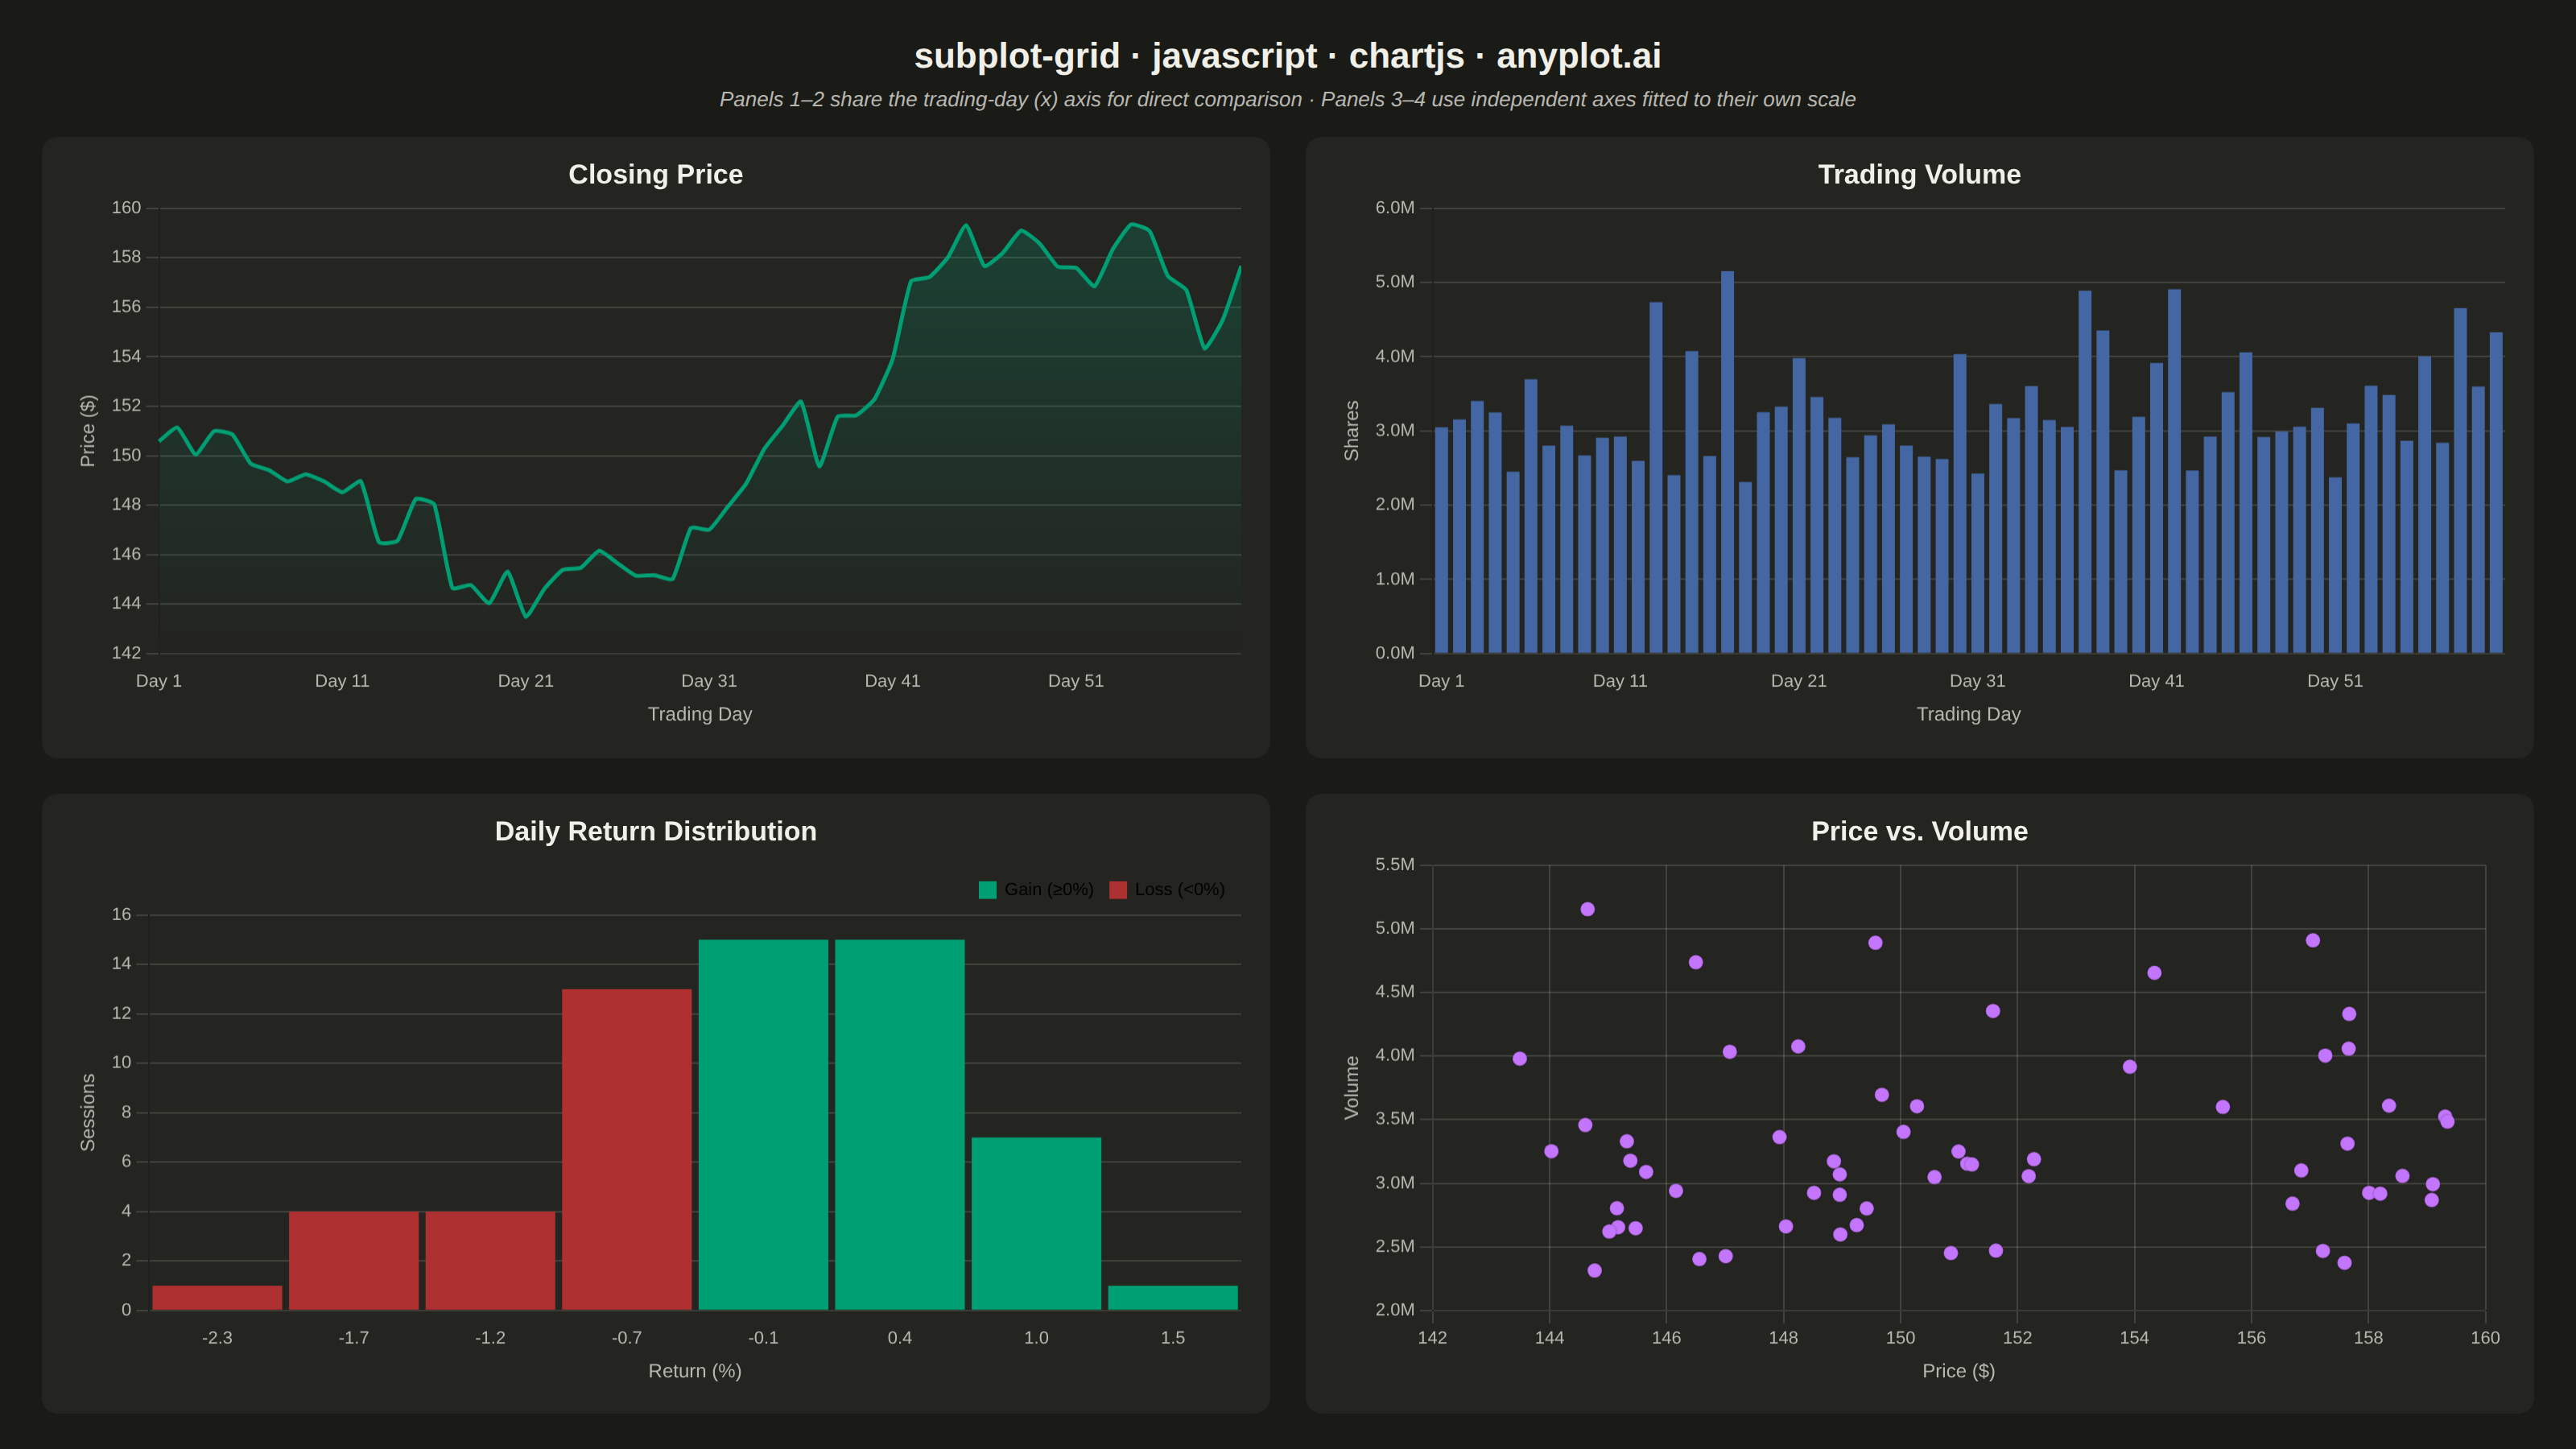
The same plot in 14 other libraries — JavaScript: D3.js, Apache ECharts, Highcharts, MUI X Charts; Python: Altair, Bokeh, lets-plot, Matplotlib, Plotly, plotnine, Pygal, Seaborn; R: ggplot2; Julia: Makie.jl. Compare all 15 side by side: Subplot Grid Layout in Python, R, Julia and JavaScript.
A customizable grid of multiple subplots allowing different plot types in each cell, with shared or independent axes. Unlike faceted plots that repeat the same visualization for data subsets, subplot grids enable combining distinct visualizations (scatter, line, bar, histogram, etc.) into a cohesive multi-panel figure for comprehensive data presentation.
// anyplot.ai
// subplot-grid: Subplot Grid Layout
// Library: chartjs 4.4.7 | JavaScript 22.23.2
// Quality: 88/100 | Created: 2026-09-09

//# anyplot-orientation: landscape

const t = window.ANYPLOT_TOKENS;

// --- Data: 60-session trading dashboard (deterministic LCG walk) -----------
function lcg(seed) {
  let state = seed >>> 0;
  return function () {
    state = (1103515245 * state + 12345) & 0x7fffffff;
    return state / 0x7fffffff;
  };
}
const rand = lcg(42);
const gaussian = () => {
  let sum = 0;
  for (let i = 0; i < 12; i++) sum += rand();
  return sum - 6;
};

const numDays = 60;
const dayLabels = Array.from({ length: numDays }, (_, i) => `Day ${i + 1}`);

let price = 150;
const prices = [];
const volumes = [];
const returns = [];
for (let i = 0; i < numDays; i++) {
  const prevPrice = price;
  const change = gaussian() * 1.1 + 0.15;
  price = Math.max(price + change, 50);
  prices.push(Number(price.toFixed(2)));
  returns.push(((price - prevPrice) / prevPrice) * 100);
  const volume = Math.round(2_200_000 + Math.abs(change) * 850_000 + rand() * 500_000);
  volumes.push(volume);
}

// Binned distribution of daily returns
const numBins = 8;
const minReturn = Math.min(...returns);
const maxReturn = Math.max(...returns);
const binWidth = (maxReturn - minReturn) / numBins;
const binCounts = new Array(numBins).fill(0);
const binLabels = Array.from({ length: numBins }, (_, i) =>
  (minReturn + i * binWidth).toFixed(1)
);
returns.forEach((r) => {
  const idx = Math.min(numBins - 1, Math.max(0, Math.floor((r - minReturn) / binWidth)));
  binCounts[idx]++;
});
// profit/loss semantic exception: bins centred above 0% read as gains
const binColors = binCounts.map((_, i) => {
  const binCenter = minReturn + (i + 0.5) * binWidth;
  return binCenter >= 0 ? t.palette[0] : t.palette[4];
});

const priceVolumePoints = prices.map((p, i) => ({ x: p, y: volumes[i] }));

// --- Layout: header + 2x2 grid of independent Chart.js canvases ------------
const root = document.createElement("div");
root.style.cssText = `
  width: 100%; height: 100%; box-sizing: border-box;
  display: flex; flex-direction: column;
  padding: 22px 26px; background: ${t.pageBg};
  font-family: -apple-system, "Segoe UI", Roboto, sans-serif;
`;
document.getElementById("container").appendChild(root);

const header = document.createElement("div");
header.textContent = "subplot-grid · javascript · chartjs · anyplot.ai";
header.style.cssText = `
  color: ${t.ink}; font-size: 22px; font-weight: 600;
  text-align: center; flex-shrink: 0; margin-bottom: 6px;
`;
root.appendChild(header);

const caption = document.createElement("div");
caption.textContent =
  "Panels 1–2 share the trading-day (x) axis for direct comparison · Panels 3–4 use independent axes fitted to their own scale";
caption.style.cssText = `
  color: ${t.inkSoft}; font-size: 13px; font-style: italic;
  text-align: center; flex-shrink: 0; margin-bottom: 16px;
`;
root.appendChild(caption);

const grid = document.createElement("div");
grid.style.cssText = `
  flex: 1; min-height: 0;
  display: grid; grid-template-columns: 1fr 1fr; grid-template-rows: 1fr 1fr;
  gap: 22px;
`;
root.appendChild(grid);

function makeCell() {
  const cell = document.createElement("div");
  cell.style.cssText = `
    position: relative; min-width: 0; min-height: 0; box-sizing: border-box;
    background: ${t.elevatedBg}; border-radius: 10px; padding: 14px 18px;
  `;
  const canvas = document.createElement("canvas");
  cell.appendChild(canvas);
  grid.appendChild(cell);
  return canvas;
}

// Shared x-axis (trading day) tick/title config reused verbatim by Panels 1 & 2
// so the two time-series panels line up for direct comparison.
const sharedDayTicks = {
  color: t.inkSoft,
  font: { size: 11 },
  autoSkip: false,
  callback: (_value, index) => (index % 10 === 0 ? dayLabels[index] : null),
};
const sharedDayTitle = { display: true, text: "Trading Day", color: t.inkSoft, font: { size: 12 } };

const commonTitle = (text) => ({
  display: true,
  text,
  color: t.ink,
  font: { size: 17, weight: "600" },
  padding: { bottom: 10 },
});
const axisTicks = { color: t.inkSoft, font: { size: 11 } };
const axisTitle = (text) => ({ display: true, text, color: t.inkSoft, font: { size: 12 } });

// Panel 1: closing price (line)
new Chart(makeCell(), {
  type: "line",
  data: {
    labels: dayLabels,
    datasets: [
      {
        label: "Close",
        data: prices,
        borderColor: t.palette[0],
        backgroundColor: (context) => {
          const { ctx, chartArea } = context.chart;
          if (!chartArea) return `${t.palette[0]}00`;
          const gradient = ctx.createLinearGradient(0, chartArea.top, 0, chartArea.bottom);
          gradient.addColorStop(0, `${t.palette[0]}40`);
          gradient.addColorStop(1, `${t.palette[0]}00`);
          return gradient;
        },
        fill: true,
        borderWidth: 2.5,
        pointRadius: 0,
        tension: 0.15,
      },
    ],
  },
  options: {
    responsive: true,
    maintainAspectRatio: false,
    animation: false,
    plugins: { title: commonTitle("Closing Price"), legend: { display: false } },
    scales: {
      x: { ticks: sharedDayTicks, grid: { display: false }, title: sharedDayTitle },
      y: { ticks: axisTicks, grid: { color: t.grid }, title: axisTitle("Price ($)") },
    },
  },
});

// Panel 2: trading volume (bar)
new Chart(makeCell(), {
  type: "bar",
  data: {
    labels: dayLabels,
    datasets: [
      {
        label: "Volume",
        data: volumes,
        backgroundColor: t.palette[2],
        borderWidth: 0,
      },
    ],
  },
  options: {
    responsive: true,
    maintainAspectRatio: false,
    animation: false,
    plugins: { title: commonTitle("Trading Volume"), legend: { display: false } },
    scales: {
      x: { ticks: sharedDayTicks, grid: { display: false }, title: sharedDayTitle },
      y: {
        ticks: { ...axisTicks, callback: (v) => `${(v / 1e6).toFixed(1)}M` },
        grid: { color: t.grid },
        title: axisTitle("Shares"),
        beginAtZero: true,
      },
    },
  },
});

// Panel 3: daily-return distribution (histogram)
new Chart(makeCell(), {
  type: "bar",
  data: {
    labels: binLabels,
    datasets: [
      {
        label: "Sessions",
        data: binCounts,
        backgroundColor: binColors,
        borderWidth: 0,
        categoryPercentage: 1.0,
        barPercentage: 0.95,
      },
    ],
  },
  options: {
    responsive: true,
    maintainAspectRatio: false,
    animation: false,
    plugins: {
      title: commonTitle("Daily Return Distribution"),
      legend: {
        display: true,
        position: "top",
        align: "end",
        onClick: () => {},
        labels: {
          color: t.inkSoft,
          font: { size: 11 },
          boxWidth: 10,
          boxHeight: 10,
          generateLabels: () => [
            { text: "Gain (≥0%)", fillStyle: t.palette[0], strokeStyle: t.palette[0] },
            { text: "Loss (<0%)", fillStyle: t.palette[4], strokeStyle: t.palette[4] },
          ],
        },
      },
    },
    scales: {
      x: { ticks: axisTicks, grid: { display: false }, title: axisTitle("Return (%)") },
      y: { ticks: axisTicks, grid: { color: t.grid }, title: axisTitle("Sessions"), beginAtZero: true },
    },
  },
});

// Panel 4: price vs. volume relationship (scatter)
new Chart(makeCell(), {
  type: "scatter",
  data: {
    datasets: [
      {
        label: "Session",
        data: priceVolumePoints,
        backgroundColor: t.palette[1],
        pointRadius: 4.5,
        pointHoverRadius: 4.5,
      },
    ],
  },
  options: {
    responsive: true,
    maintainAspectRatio: false,
    animation: false,
    plugins: { title: commonTitle("Price vs. Volume"), legend: { display: false } },
    scales: {
      x: { ticks: axisTicks, grid: { color: t.grid }, title: axisTitle("Price ($)") },
      y: {
        ticks: { ...axisTicks, callback: (v) => `${(v / 1e6).toFixed(1)}M` },
        grid: { color: t.grid },
        title: axisTitle("Volume"),
      },
    },
  },
});
Runnable source as JSON, for any HTTP client: https://api.anyplot.ai/specs/subplot-grid/chartjs/code. Any spec id and library id listed in llms-full.txt fit the same URL shape; every URL below is complete and callable.
{
  "spec_id": "subplot-grid",
  "language": "javascript",
  "library": "chartjs",
  "page": "https://anyplot.ai/subplot-grid/javascript/chartjs",
  "hub": "https://anyplot.ai/subplot-grid",
  "code_json": "https://api.anyplot.ai/specs/subplot-grid/chartjs/code",
  "spec_json": "https://api.anyplot.ai/specs/subplot-grid",
  "render_light_png": "https://storage.googleapis.com/anyplot-images/plots/subplot-grid/javascript/chartjs/plot-light.png",
  "render_dark_png": "https://storage.googleapis.com/anyplot-images/plots/subplot-grid/javascript/chartjs/plot-dark.png",
  "interactive_light_html": "https://storage.googleapis.com/anyplot-images/plots/subplot-grid/javascript/chartjs/plot-light.html",
  "interactive_dark_html": "https://storage.googleapis.com/anyplot-images/plots/subplot-grid/javascript/chartjs/plot-dark.html",
  "quality_score": 88.0,
  "license": "MIT",
  "guide": "https://anyplot.ai/llms.txt"
}
Part of Subplot Grid Layout on anyplot.ai.