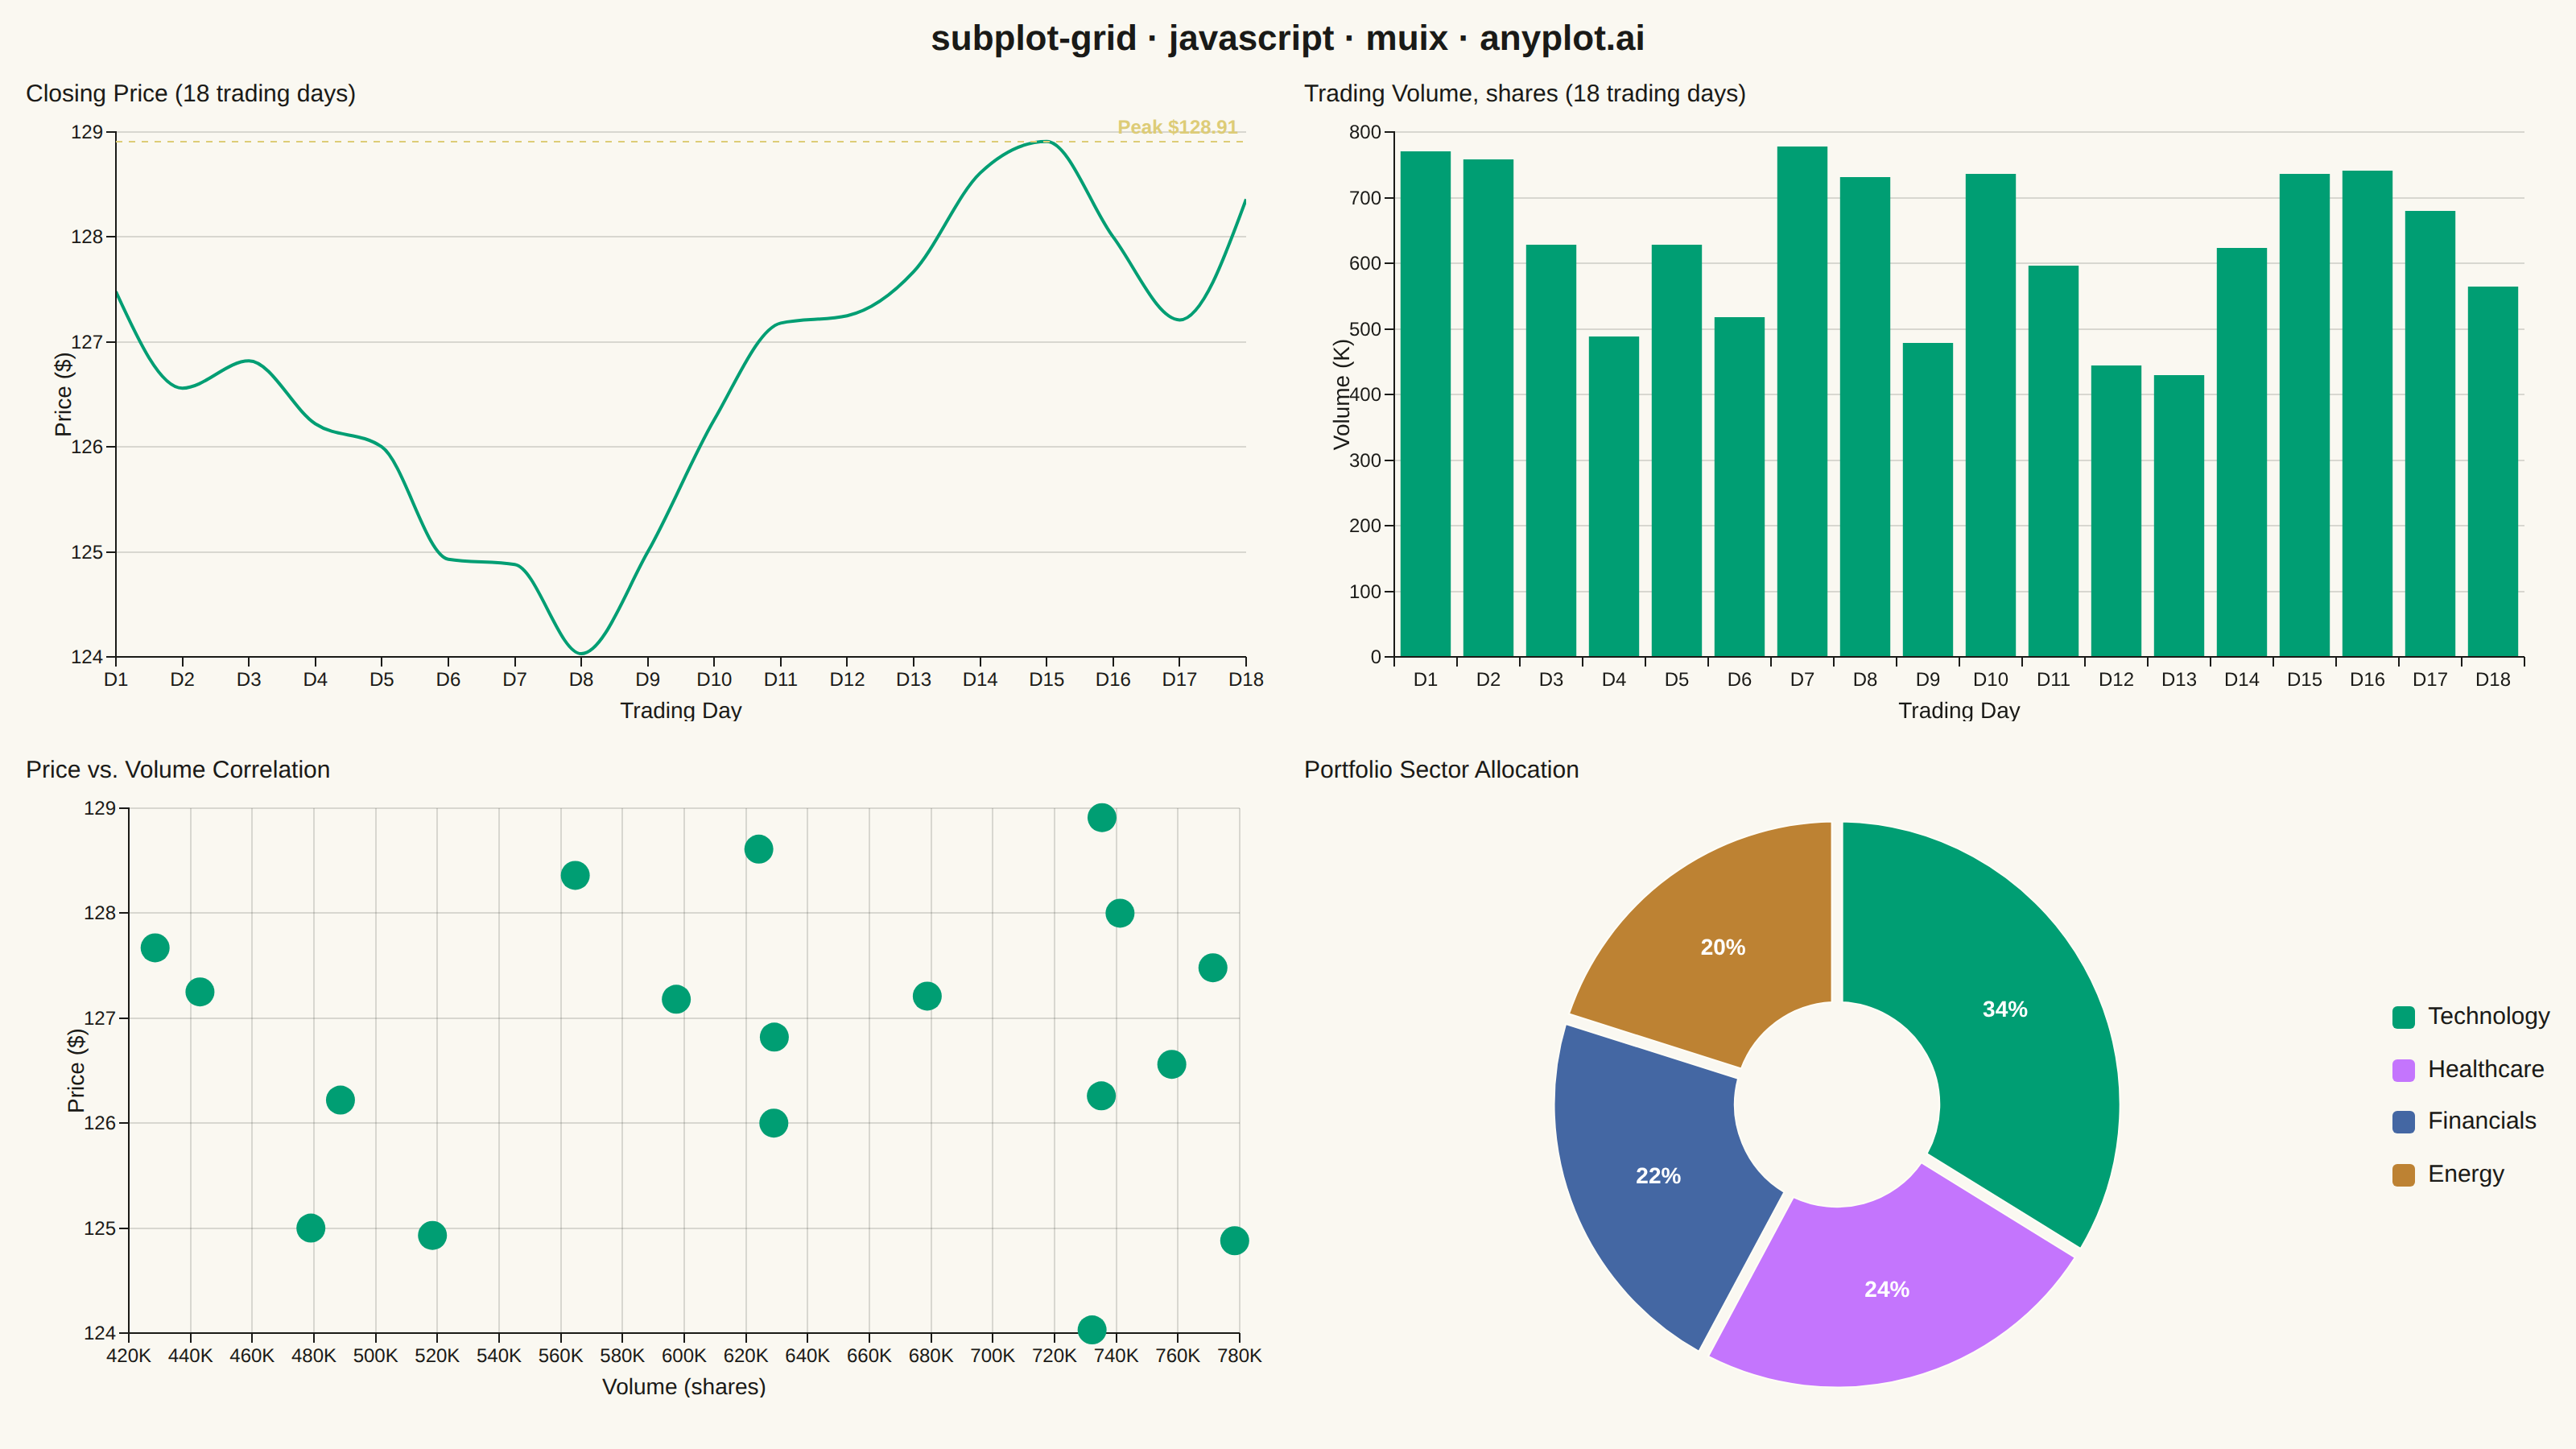
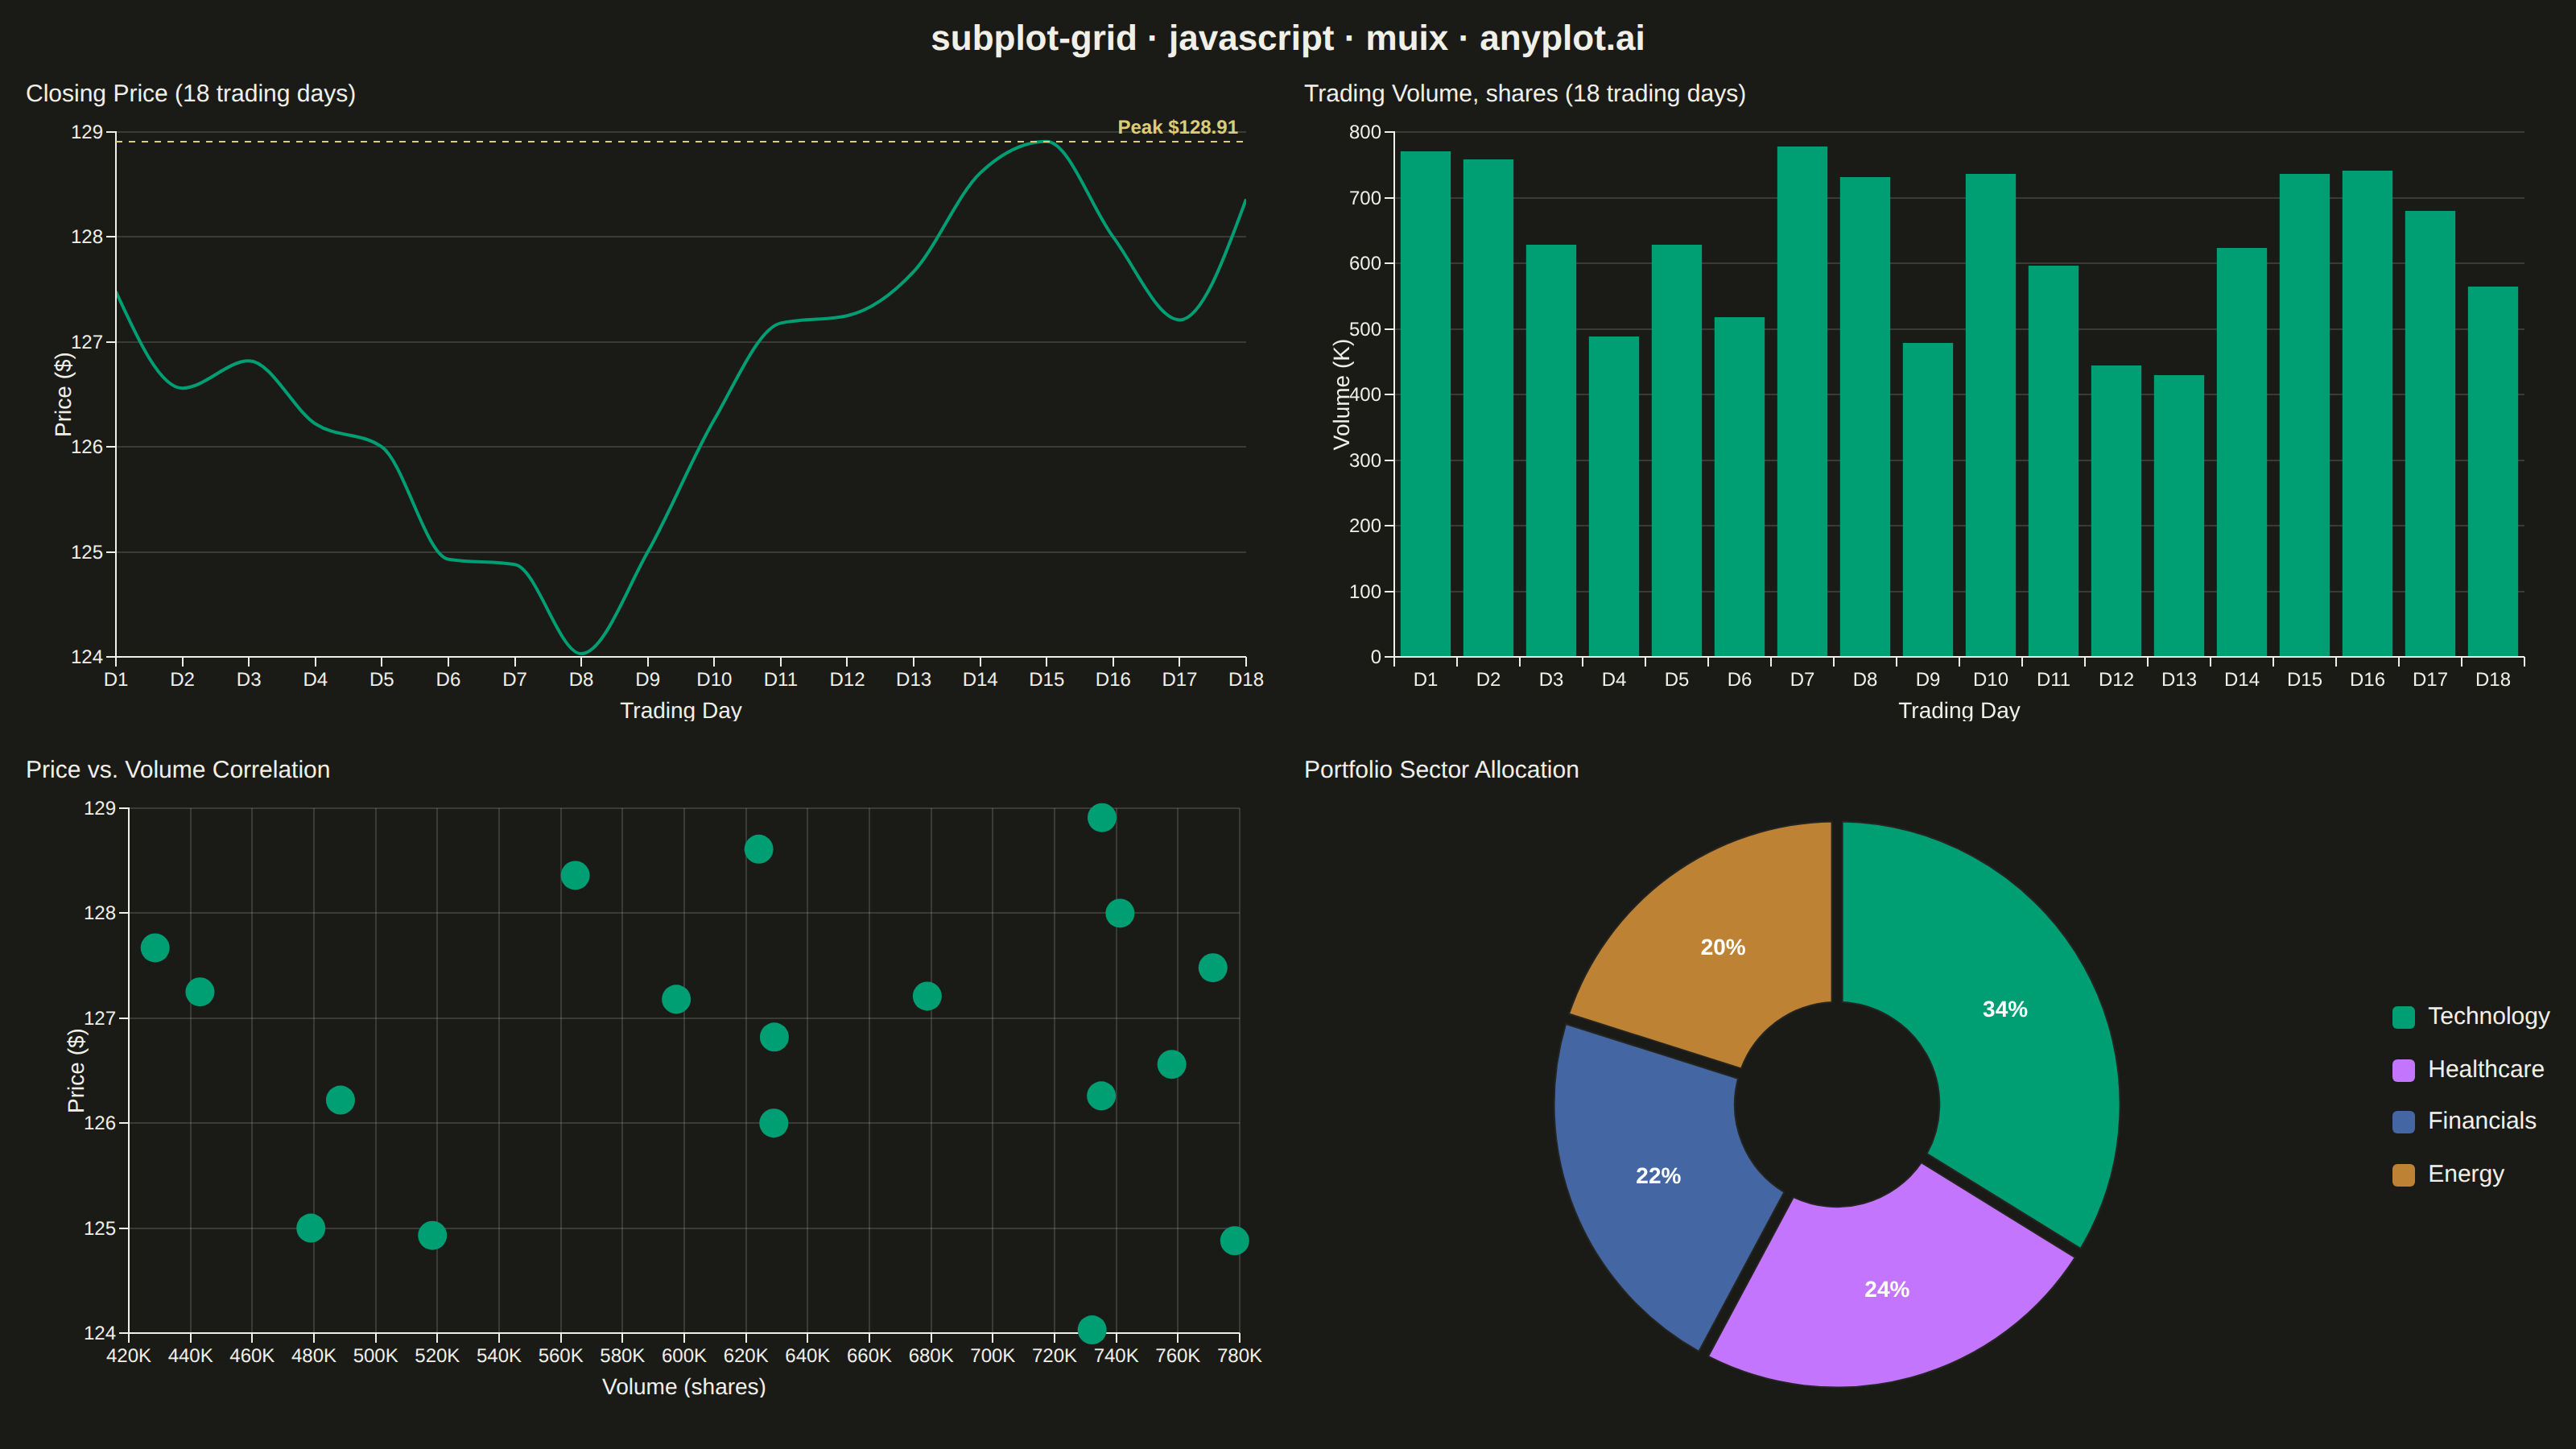
The same plot in 14 other libraries — JavaScript: Chart.js, D3.js, Apache ECharts, Highcharts; Python: Altair, Bokeh, lets-plot, Matplotlib, Plotly, plotnine, Pygal, Seaborn; R: ggplot2; Julia: Makie.jl. Compare all 15 side by side: Subplot Grid Layout in Python, R, Julia and JavaScript.
A customizable grid of multiple subplots allowing different plot types in each cell, with shared or independent axes. Unlike faceted plots that repeat the same visualization for data subsets, subplot grids enable combining distinct visualizations (scatter, line, bar, histogram, etc.) into a cohesive multi-panel figure for comprehensive data presentation.
// anyplot.ai
// subplot-grid: Subplot Grid Layout
// Library: muix 7.29.1 | JavaScript 22.23.2
// Quality: 85/100 | Created: 2026-09-09
//# anyplot-orientation: landscape
import { LineChart } from "@mui/x-charts/LineChart";
import { BarChart } from "@mui/x-charts/BarChart";
import { ScatterChart } from "@mui/x-charts/ScatterChart";
import { PieChart } from "@mui/x-charts/PieChart";
import { ChartsReferenceLine } from "@mui/x-charts/ChartsReferenceLine";
import { Box, Typography } from "@mui/material";

const t = window.ANYPLOT_TOKENS;
const W = window.ANYPLOT_SIZE.width;
const H = window.ANYPLOT_SIZE.height;

// --- Layout (2x2 grid: figure title + 4 independent panels) ----------------
const FIGURE_TITLE_H = 48;
const OUTER_GAP = 16;
const CELL_GAP = 20;
const CELL_TITLE_H = 26;
const GRID_W = W - OUTER_GAP * 2;
const GRID_H = H - FIGURE_TITLE_H - OUTER_GAP * 2;
const CELL_W = (GRID_W - CELL_GAP) / 2;
const CELL_H = (GRID_H - CELL_GAP) / 2;
const CHART_H = CELL_H - CELL_TITLE_H;

// --- Data (in-memory, deterministic LCG) ------------------------------------
function makeRng(seed: number) {
  let state = seed >>> 0;
  return () => {
    state = (state * 1664525 + 1013904223) >>> 0;
    return state / 4294967296;
  };
}
const rng = makeRng(42);

const dayLabels = Array.from({ length: 18 }, (_, i) => `D${i + 1}`);

let price = 128;
const closingPrices = dayLabels.map(() => {
  price += (rng() - 0.47) * 2.4;
  return Math.round(price * 100) / 100;
});

const peakPrice = Math.max(...closingPrices);

const tradingVolume = dayLabels.map(() => Math.round(420_000 + rng() * 380_000));

const priceVolumePoints = closingPrices.map((p, i) => ({
  id: i,
  x: tradingVolume[i],
  y: p,
}));

const sectorAllocation = [
  { id: 0, value: 34, label: "Technology" },
  { id: 1, value: 24, label: "Healthcare" },
  { id: 2, value: 22, label: "Financials" },
  { id: 3, value: 20, label: "Energy" },
];

// --- Chart (default-exported component — the harness mounts it) -----------
export default function Chart() {
  return (
    <Box
      sx={{
        width: W,
        height: H,
        bgcolor: "transparent",
        display: "flex",
        flexDirection: "column",
        alignItems: "center",
      }}
    >
      <Typography
        sx={{
          height: FIGURE_TITLE_H,
          lineHeight: `${FIGURE_TITLE_H}px`,
          fontSize: 22,
          fontWeight: 600,
          color: t.ink,
        }}
      >
        subplot-grid · javascript · muix · anyplot.ai
      </Typography>

      <Box
        sx={{
          display: "grid",
          gridTemplateColumns: `repeat(2, ${CELL_W}px)`,
          gridTemplateRows: `repeat(2, ${CELL_H}px)`,
          gap: `${CELL_GAP}px`,
        }}
      >
        {/* Top-left: line chart — price trend, shares the day-index axis with volume */}
        <Box>
          <Typography sx={{ height: CELL_TITLE_H, fontSize: 15, fontWeight: 500, color: t.ink }}>
            Closing Price (18 trading days)
          </Typography>
          <LineChart
            width={CELL_W}
            height={CHART_H}
            colors={[t.palette[0]]}
            skipAnimation
            grid={{ horizontal: true }}
            slotProps={{ legend: { hidden: true } }}
            margin={{ left: 56, right: 16, top: 8, bottom: 40 }}
            xAxis={[{ scaleType: "point", data: dayLabels, label: "Trading Day" }]}
            yAxis={[{ label: "Price ($)" }]}
            series={[{ data: closingPrices, label: "Close", showMark: false, curve: "monotoneX" }]}
          >
            <ChartsReferenceLine
              y={peakPrice}
              label={`Peak $${peakPrice.toFixed(2)}`}
              labelAlign="end"
              lineStyle={{ stroke: t.amber, strokeDasharray: "4 4" }}
              labelStyle={{ fill: t.amber, fontSize: 12, fontWeight: 600 }}
            />
          </LineChart>
        </Box>

        {/* Top-right: bar chart — volume, shares the day-index axis with price */}
        <Box>
          <Typography sx={{ height: CELL_TITLE_H, fontSize: 15, fontWeight: 500, color: t.ink }}>
            Trading Volume, shares (18 trading days)
          </Typography>
          <BarChart
            width={CELL_W}
            height={CHART_H}
            colors={[t.palette[0]]}
            skipAnimation
            grid={{ horizontal: true }}
            slotProps={{ legend: { hidden: true } }}
            margin={{ left: 56, right: 16, top: 8, bottom: 40 }}
            xAxis={[{ scaleType: "band", data: dayLabels, label: "Trading Day" }]}
            yAxis={[{ label: "Volume (K)", valueFormatter: (v: number) => `${Math.round(v / 1000)}` }]}
            series={[{ data: tradingVolume, label: "Volume" }]}
          />
        </Box>

        {/* Bottom-left: scatter chart — price vs. volume, fully independent axes */}
        <Box>
          <Typography sx={{ height: CELL_TITLE_H, fontSize: 15, fontWeight: 500, color: t.ink }}>
            Price vs. Volume Correlation
          </Typography>
          <ScatterChart
            width={CELL_W}
            height={CHART_H}
            colors={[t.palette[0]]}
            skipAnimation
            grid={{ horizontal: true, vertical: true }}
            slotProps={{ legend: { hidden: true } }}
            margin={{ left: 64, right: 20, top: 8, bottom: 40 }}
            xAxis={[{ label: "Volume (shares)", valueFormatter: (v: number) => `${Math.round(v / 1000)}K` }]}
            yAxis={[{ label: "Price ($)" }]}
            series={[{ data: priceVolumePoints, markerSize: 9 }]}
          />
        </Box>

        {/* Bottom-right: pie chart — sector allocation, independent, no cartesian axes */}
        <Box>
          <Typography sx={{ height: CELL_TITLE_H, fontSize: 15, fontWeight: 500, color: t.ink }}>
            Portfolio Sector Allocation
          </Typography>
          <Box sx={{ display: "flex", alignItems: "center", height: CHART_H, gap: "24px" }}>
            <PieChart
              width={CHART_H}
              height={CHART_H}
              colors={t.palette}
              skipAnimation
              slotProps={{ legend: { hidden: true } }}
              sx={{ "& .MuiPieArcLabel-root": { fill: "#FFFFFF", fontSize: 14, fontWeight: 600 } }}
              series={[
                {
                  data: sectorAllocation,
                  innerRadius: CHART_H * 0.17,
                  outerRadius: CHART_H * 0.47,
                  paddingAngle: 2,
                  cx: CHART_H / 2,
                  cy: CHART_H / 2,
                  arcLabel: (item) => `${item.value}%`,
                  arcLabelMinAngle: 15,
                },
              ]}
            />
            <Box sx={{ display: "flex", flexDirection: "column", gap: "10px" }}>
              {sectorAllocation.map((sector, i) => (
                <Box key={sector.id} sx={{ display: "flex", alignItems: "center", gap: "8px" }}>
                  <Box sx={{ width: 14, height: 14, borderRadius: "3px", bgcolor: t.palette[i] }} />
                  <Typography sx={{ fontSize: 15, color: t.ink }}>{sector.label}</Typography>
                </Box>
              ))}
            </Box>
          </Box>
        </Box>
      </Box>
    </Box>
  );
}
Runnable source as JSON, for any HTTP client: https://api.anyplot.ai/specs/subplot-grid/muix/code. Any spec id and library id listed in llms-full.txt fit the same URL shape; every URL below is complete and callable.
{
  "spec_id": "subplot-grid",
  "language": "javascript",
  "library": "muix",
  "page": "https://anyplot.ai/subplot-grid/javascript/muix",
  "hub": "https://anyplot.ai/subplot-grid",
  "code_json": "https://api.anyplot.ai/specs/subplot-grid/muix/code",
  "spec_json": "https://api.anyplot.ai/specs/subplot-grid",
  "render_light_png": "https://storage.googleapis.com/anyplot-images/plots/subplot-grid/javascript/muix/plot-light.png",
  "render_dark_png": "https://storage.googleapis.com/anyplot-images/plots/subplot-grid/javascript/muix/plot-dark.png",
  "interactive_light_html": "https://storage.googleapis.com/anyplot-images/plots/subplot-grid/javascript/muix/plot-light.html",
  "interactive_dark_html": "https://storage.googleapis.com/anyplot-images/plots/subplot-grid/javascript/muix/plot-dark.html",
  "quality_score": 85.0,
  "license": "MIT",
  "guide": "https://anyplot.ai/llms.txt"
}
Part of Subplot Grid Layout on anyplot.ai.