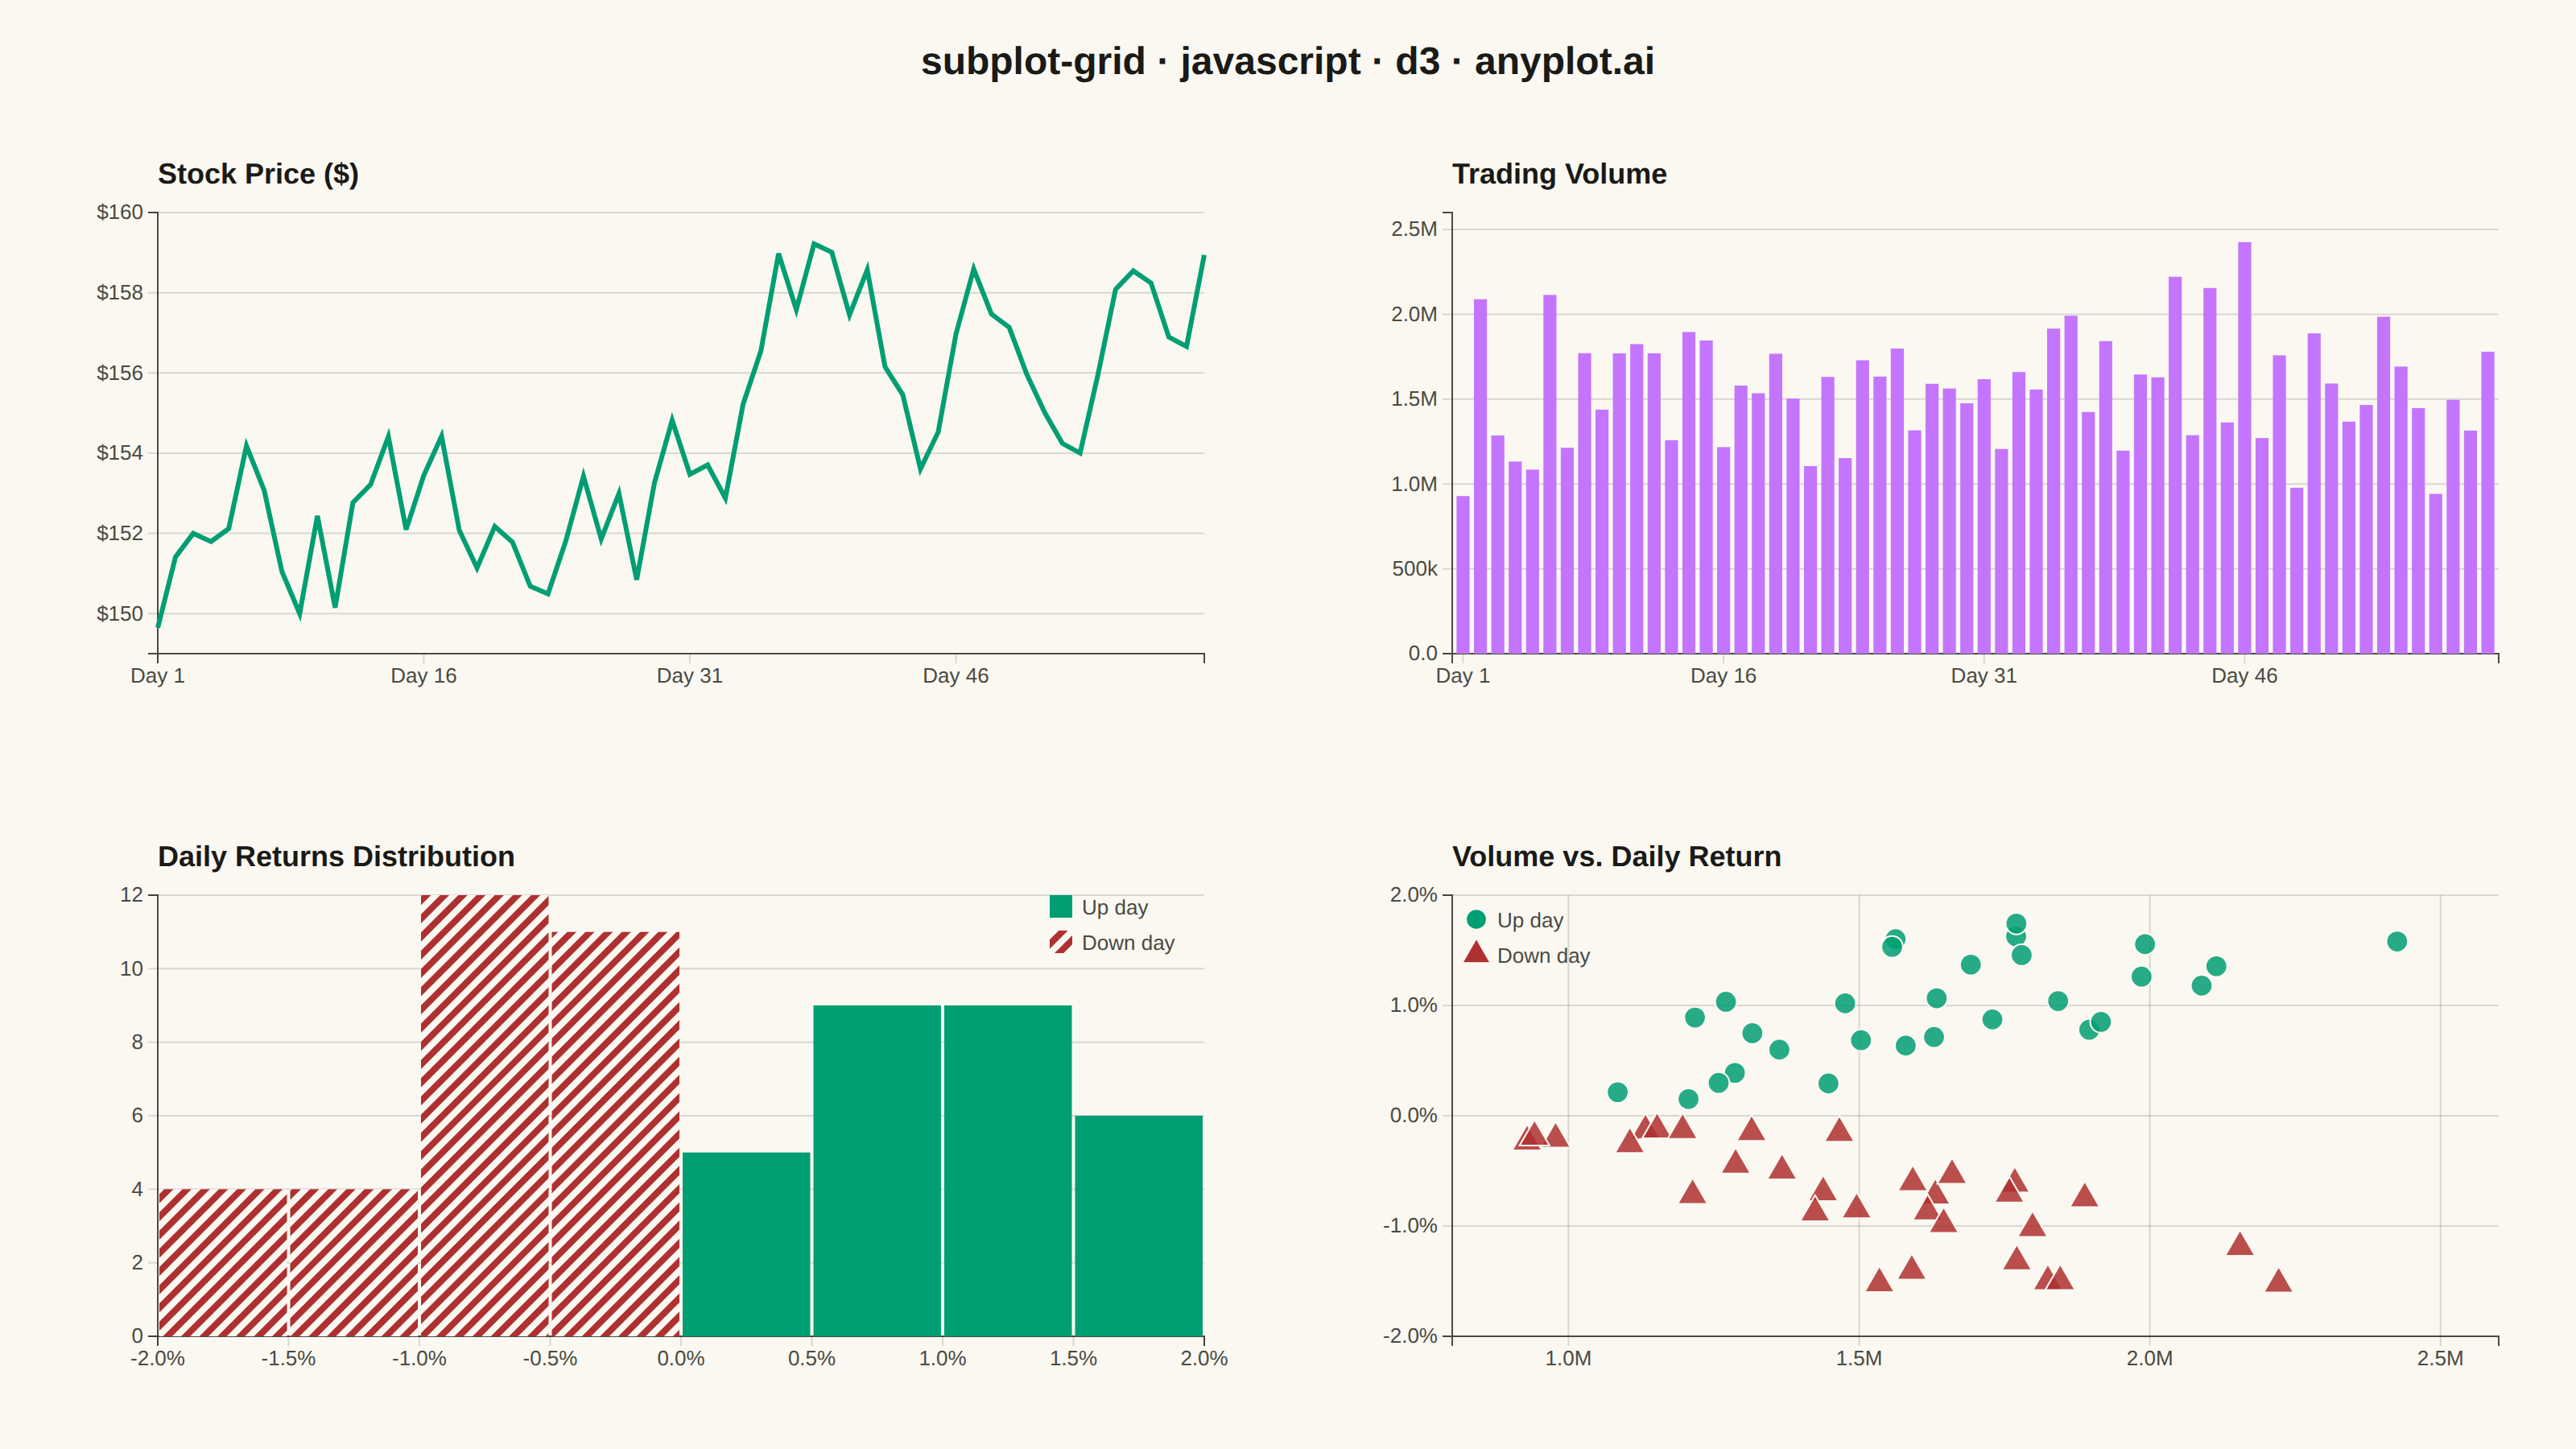
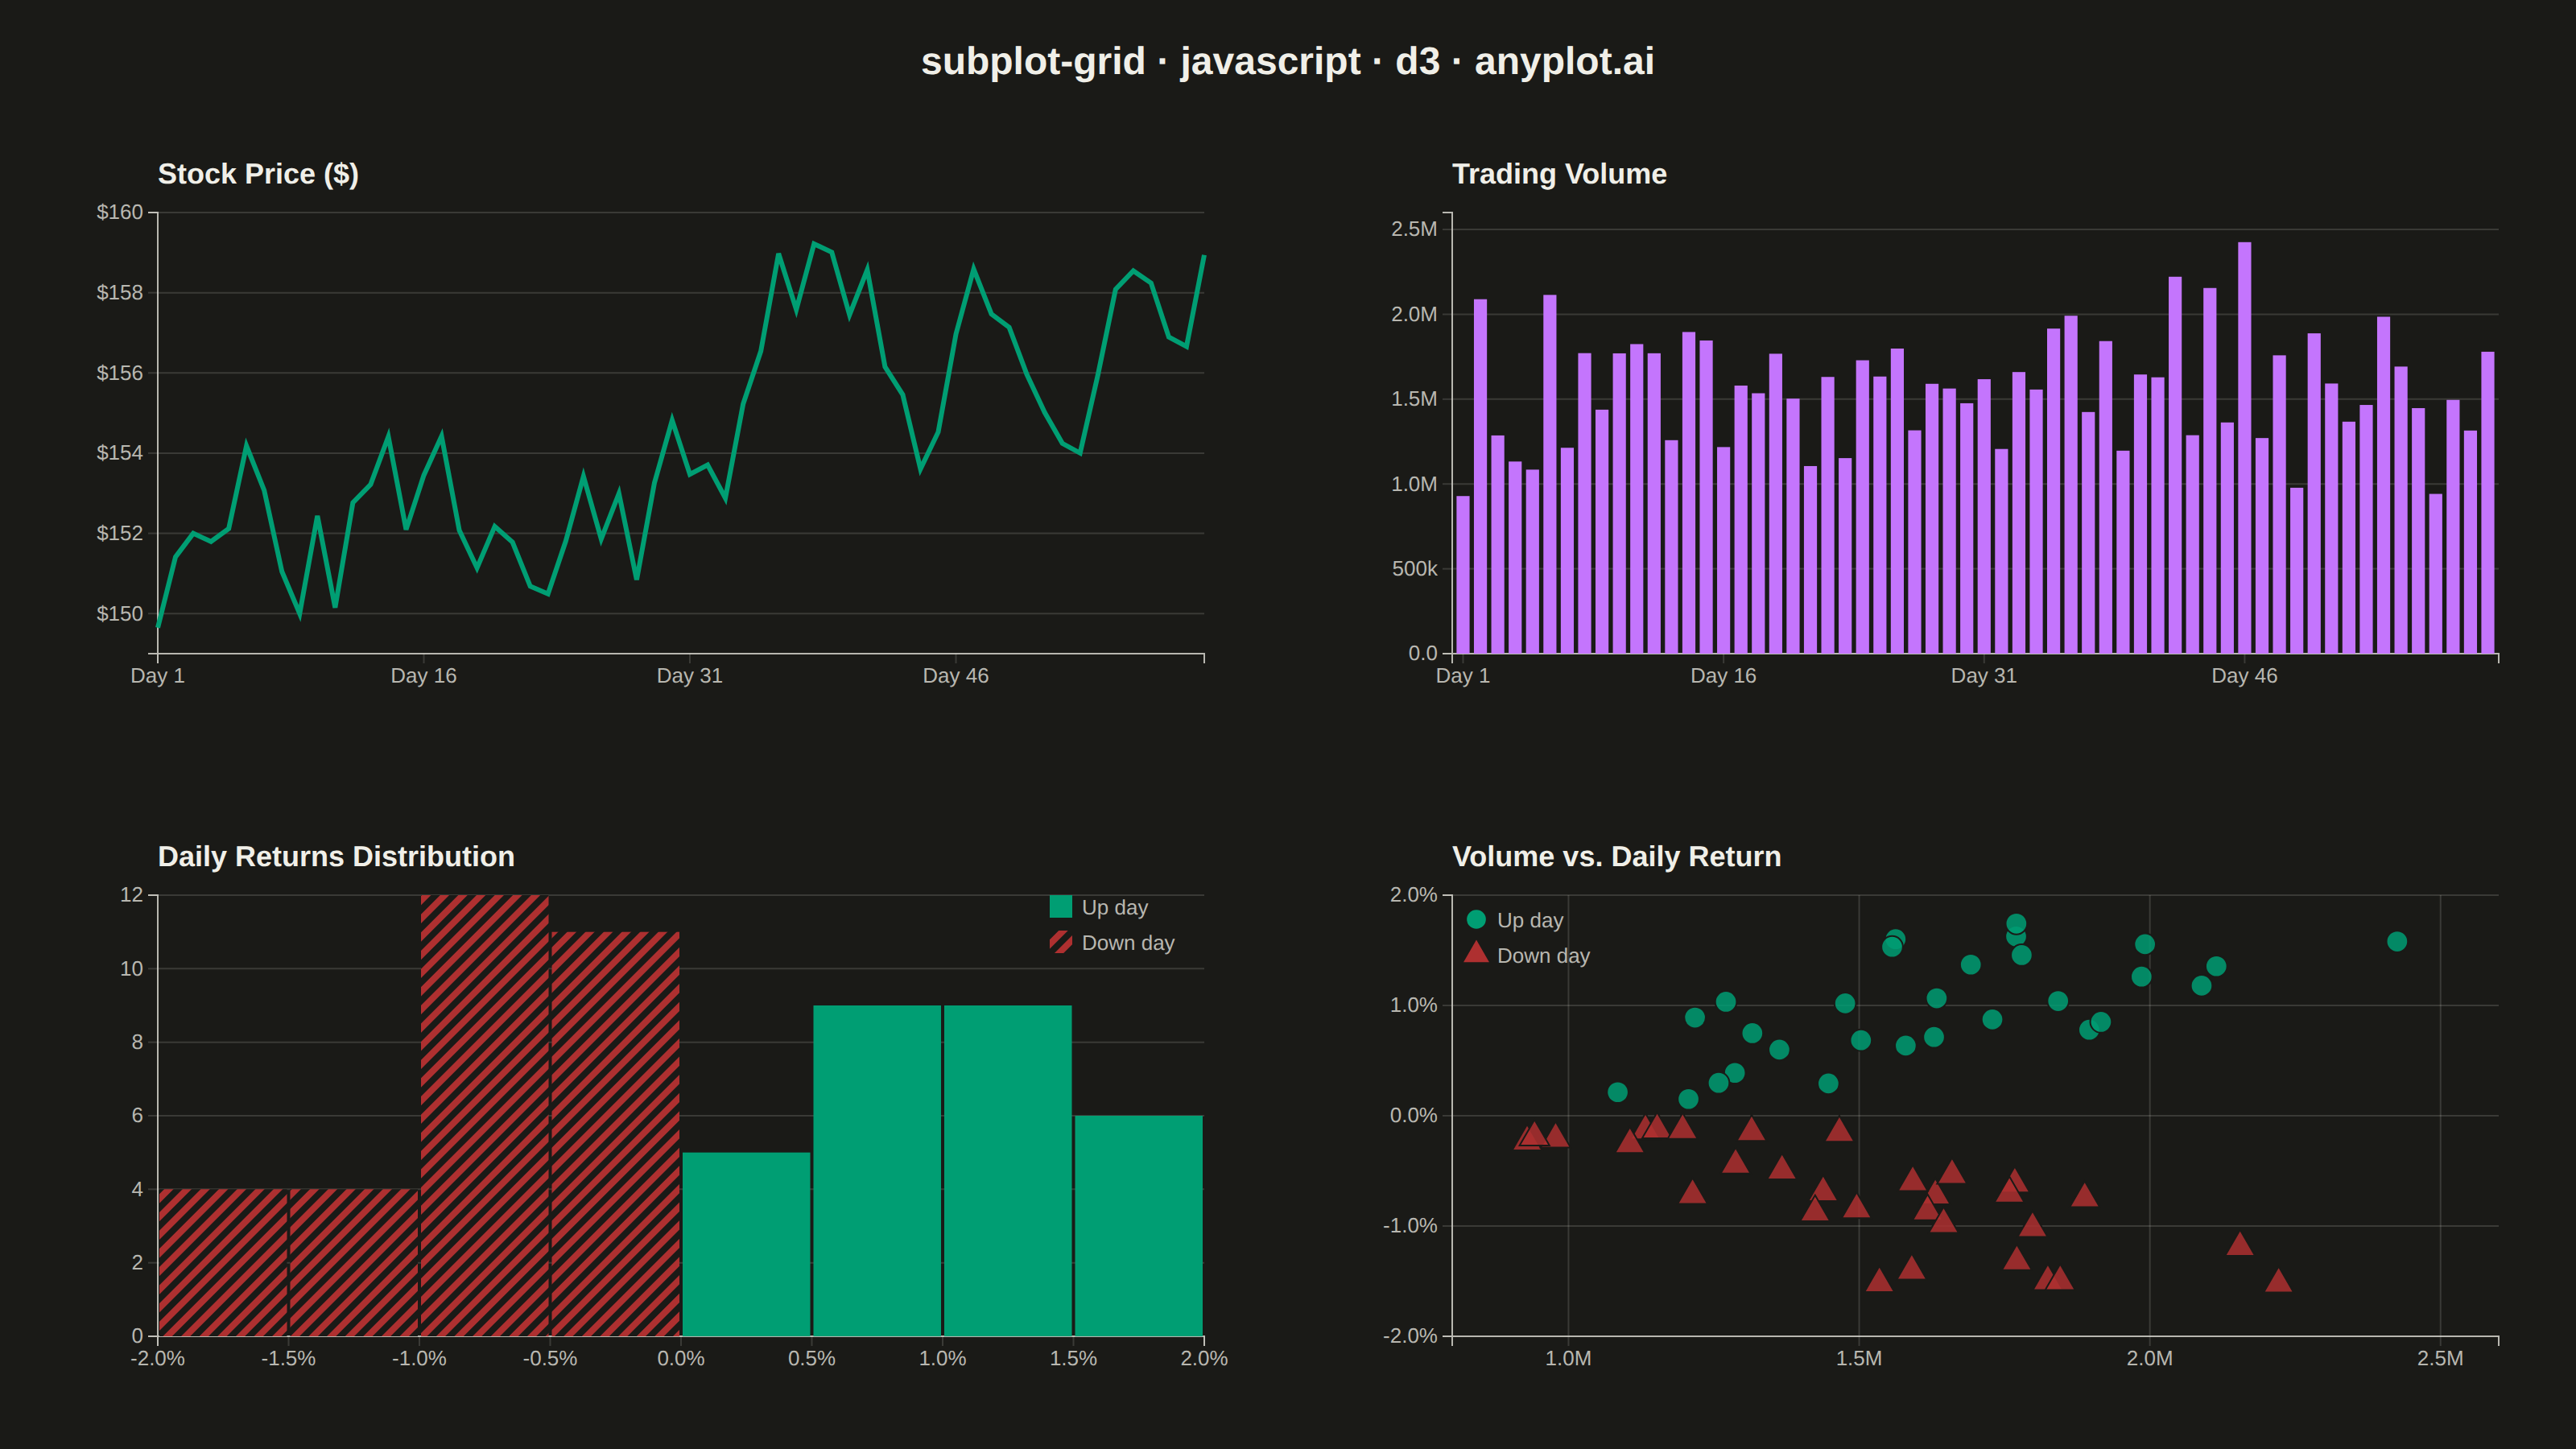
The same plot in 14 other libraries — JavaScript: Chart.js, Apache ECharts, Highcharts, MUI X Charts; Python: Altair, Bokeh, lets-plot, Matplotlib, Plotly, plotnine, Pygal, Seaborn; R: ggplot2; Julia: Makie.jl. Compare all 15 side by side: Subplot Grid Layout in Python, R, Julia and JavaScript.
A customizable grid of multiple subplots allowing different plot types in each cell, with shared or independent axes. Unlike faceted plots that repeat the same visualization for data subsets, subplot grids enable combining distinct visualizations (scatter, line, bar, histogram, etc.) into a cohesive multi-panel figure for comprehensive data presentation.
// anyplot.ai
// subplot-grid: Subplot Grid Layout
// Library: d3 7.9.0 | JavaScript 22.23.2
// Quality: 87/100 | Created: 2026-09-09

const t = window.ANYPLOT_TOKENS;
const { width, height } = window.ANYPLOT_SIZE;

// --- Data (in-memory, deterministic) ----------------------------------------
// Small fixed-seed LCG — the browser has no seeded RNG.
function makeLcg(seed) {
  let state = seed >>> 0;
  return function () {
    state = (Math.imul(state, 1664525) + 1013904223) >>> 0;
    return state / 4294967296;
  };
}
const rand = makeLcg(20260909);

// Financial dashboard scenario: 60 trading days of a single stock.
const numDays = 60;
const dayIndex = d3.range(numDays);
const dailyReturns = [];
const priceSeries = [];
const dailyVolumes = [];
let price = 150;
for (let i = 0; i < numDays; i++) {
  const pctChange = (rand() - 0.47) * 3.4; // percent, slight upward drift
  price *= 1 + pctChange / 100;
  priceSeries.push(price);
  dailyReturns.push(pctChange);
  dailyVolumes.push((1.1 + Math.abs(pctChange) * 0.55) * 1e6 * (0.75 + rand() * 0.5));
}

const priceColor = t.palette[0]; // #009E73 — brand green, headline series
const volumeColor = t.palette[1];
const upColor = t.palette[0]; // finance convention: up/profit -> green
const downColor = t.palette[4]; // finance convention: down/loss -> matte red

// --- SVG mount ----------------------------------------------------------------
const svg = d3.select("#container").append("svg").attr("width", width).attr("height", height);

// Diagonal hatch pattern gives "down day" a texture cue in addition to color,
// so red-green color-vision-deficient viewers can still tell up/down apart.
const hatchDownId = "hatch-down";
svg
  .append("defs")
  .append("pattern")
  .attr("id", hatchDownId)
  .attr("width", 8)
  .attr("height", 8)
  .attr("patternUnits", "userSpaceOnUse")
  .attr("patternTransform", "rotate(45)")
  .call((p) => {
    p.append("rect").attr("width", 8).attr("height", 8).attr("fill", downColor);
    p.append("rect").attr("width", 4).attr("height", 8).attr("fill", t.pageBg);
  });

svg
  .append("text")
  .attr("x", width / 2)
  .attr("y", 46)
  .attr("text-anchor", "middle")
  .attr("fill", t.ink)
  .style("font-size", "24px")
  .style("font-weight", "600")
  .text("subplot-grid · javascript · d3 · anyplot.ai");

// --- Grid geometry (2x2, independent axes per cell) --------------------------
const gridTop = 92;
const gridBottom = height - 24;
const gridLeft = 24;
const gridRight = width - 24;
const gutterX = 56;
const gutterY = 64;
const cellW = (gridRight - gridLeft - gutterX) / 2;
const cellH = (gridBottom - gridTop - gutterY) / 2;

const cells = [
  { x: gridLeft, y: gridTop },
  { x: gridLeft + cellW + gutterX, y: gridTop },
  { x: gridLeft, y: gridTop + cellH + gutterY },
  { x: gridLeft + cellW + gutterX, y: gridTop + cellH + gutterY },
];

const panelMargin = { top: 40, right: 24, bottom: 46, left: 74 };
const pw = cellW - panelMargin.left - panelMargin.right;
const ph = cellH - panelMargin.top - panelMargin.bottom;

function panel(cell, title) {
  const cellG = svg.append("g").attr("transform", `translate(${cell.x},${cell.y})`);
  cellG
    .append("text")
    .attr("x", panelMargin.left)
    .attr("y", 22)
    .attr("fill", t.ink)
    .style("font-size", "18px")
    .style("font-weight", "600")
    .text(title);
  return cellG.append("g").attr("transform", `translate(${panelMargin.left},${panelMargin.top})`);
}

function styleAxis(ax) {
  ax.selectAll("text").attr("fill", t.inkSoft).style("font-size", "13px");
  ax.selectAll("line").attr("stroke", t.grid);
  ax.select(".domain").attr("stroke", t.inkSoft);
}

function legend(g, items, x, y) {
  const lg = g.append("g").attr("transform", `translate(${x},${y})`);
  items.forEach((item, i) => {
    const row = lg.append("g").attr("transform", `translate(0,${i * 22})`);
    if (item.shape) {
      row
        .append("path")
        .attr("transform", "translate(7,7)")
        .attr("d", item.shape.size(110)())
        .attr("fill", item.color);
    } else {
      row.append("rect").attr("width", 14).attr("height", 14).attr("fill", item.fill ?? item.color);
    }
    row
      .append("text")
      .attr("x", 20)
      .attr("y", 12)
      .attr("fill", t.inkSoft)
      .style("font-size", "13px")
      .text(item.label);
  });
}

// --- Cell 1: price line chart --------------------------------------------------
const g1 = panel(cells[0], "Stock Price ($)");
const x1 = d3.scaleLinear().domain([0, numDays - 1]).range([0, pw]);
const y1 = d3.scaleLinear().domain(d3.extent(priceSeries)).nice().range([ph, 0]);
g1
  .append("g")
  .selectAll("line")
  .data(y1.ticks(5))
  .join("line")
  .attr("x1", 0)
  .attr("x2", pw)
  .attr("y1", (d) => y1(d))
  .attr("y2", (d) => y1(d))
  .attr("stroke", t.grid);
const yAxis1 = g1.append("g").call(d3.axisLeft(y1).ticks(5).tickFormat(d3.format("$.0f")));
const xAxis1 = g1
  .append("g")
  .attr("transform", `translate(0,${ph})`)
  .call(
    d3
      .axisBottom(x1)
      .tickValues(dayIndex.filter((d) => d % 15 === 0))
      .tickFormat((d) => `Day ${d + 1}`)
  );
[xAxis1, yAxis1].forEach(styleAxis);
const priceLine = d3
  .line()
  .x((d, i) => x1(i))
  .y((d) => y1(d));
g1
  .append("path")
  .datum(priceSeries)
  .attr("fill", "none")
  .attr("stroke", priceColor)
  .attr("stroke-width", 3)
  .attr("d", priceLine);

// --- Cell 2: trading volume bar chart -------------------------------------------
const g2 = panel(cells[1], "Trading Volume");
const x2 = d3.scaleBand().domain(dayIndex).range([0, pw]).padding(0.25);
const y2 = d3.scaleLinear().domain([0, d3.max(dailyVolumes)]).nice().range([ph, 0]);
g2
  .append("g")
  .selectAll("line")
  .data(y2.ticks(5))
  .join("line")
  .attr("x1", 0)
  .attr("x2", pw)
  .attr("y1", (d) => y2(d))
  .attr("y2", (d) => y2(d))
  .attr("stroke", t.grid);
const yAxis2 = g2.append("g").call(d3.axisLeft(y2).ticks(5).tickFormat(d3.format(".2s")));
const xAxis2 = g2
  .append("g")
  .attr("transform", `translate(0,${ph})`)
  .call(
    d3
      .axisBottom(x2)
      .tickValues(x2.domain().filter((d) => d % 15 === 0))
      .tickFormat((d) => `Day ${d + 1}`)
  );
[xAxis2, yAxis2].forEach(styleAxis);
g2
  .selectAll("rect.bar")
  .data(dailyVolumes)
  .join("rect")
  .attr("class", "bar")
  .attr("x", (d, i) => x2(i))
  .attr("y", (d) => y2(d))
  .attr("width", x2.bandwidth())
  .attr("height", (d) => ph - y2(d))
  .attr("fill", volumeColor);

// --- Cell 3: daily returns histogram --------------------------------------------
const g3 = panel(cells[2], "Daily Returns Distribution");
const x3 = d3.scaleLinear().domain(d3.extent(dailyReturns)).nice().range([0, pw]);
const bins = d3.bin().domain(x3.domain()).thresholds(10)(dailyReturns);
const y3 = d3
  .scaleLinear()
  .domain([0, d3.max(bins, (b) => b.length)])
  .nice()
  .range([ph, 0]);
g3
  .append("g")
  .selectAll("line")
  .data(y3.ticks(5))
  .join("line")
  .attr("x1", 0)
  .attr("x2", pw)
  .attr("y1", (d) => y3(d))
  .attr("y2", (d) => y3(d))
  .attr("stroke", t.grid);
const yAxis3 = g3.append("g").call(d3.axisLeft(y3).ticks(5));
const xAxis3 = g3
  .append("g")
  .attr("transform", `translate(0,${ph})`)
  .call(
    d3
      .axisBottom(x3)
      .ticks(6)
      .tickFormat((d) => `${d.toFixed(1)}%`)
  );
[xAxis3, yAxis3].forEach(styleAxis);
g3
  .selectAll("rect.bin")
  .data(bins)
  .join("rect")
  .attr("class", "bin")
  .attr("x", (d) => x3(d.x0) + 1)
  .attr("y", (d) => y3(d.length))
  .attr("width", (d) => Math.max(0, x3(d.x1) - x3(d.x0) - 2))
  .attr("height", (d) => ph - y3(d.length))
  .attr("fill", (d) => ((d.x0 + d.x1) / 2 >= 0 ? upColor : `url(#${hatchDownId})`));
legend(
  g3,
  [
    { color: upColor, fill: upColor, label: "Up day" },
    { color: downColor, fill: `url(#${hatchDownId})`, label: "Down day" },
  ],
  pw - 96,
  0
);

// --- Cell 4: volume vs. return scatter -------------------------------------------
const g4 = panel(cells[3], "Volume vs. Daily Return");
const x4 = d3.scaleLinear().domain(d3.extent(dailyVolumes)).nice().range([0, pw]);
const y4 = d3.scaleLinear().domain(d3.extent(dailyReturns)).nice().range([ph, 0]);
g4
  .append("g")
  .selectAll("line.h")
  .data(y4.ticks(5))
  .join("line")
  .attr("class", "h")
  .attr("x1", 0)
  .attr("x2", pw)
  .attr("y1", (d) => y4(d))
  .attr("y2", (d) => y4(d))
  .attr("stroke", t.grid);
g4
  .append("g")
  .selectAll("line.v")
  .data(x4.ticks(5))
  .join("line")
  .attr("class", "v")
  .attr("y1", 0)
  .attr("y2", ph)
  .attr("x1", (d) => x4(d))
  .attr("x2", (d) => x4(d))
  .attr("stroke", t.grid);
const yAxis4 = g4
  .append("g")
  .call(
    d3
      .axisLeft(y4)
      .ticks(5)
      .tickFormat((d) => `${d.toFixed(1)}%`)
  );
const xAxis4 = g4
  .append("g")
  .attr("transform", `translate(0,${ph})`)
  .call(d3.axisBottom(x4).ticks(5).tickFormat(d3.format(".2s")));
[xAxis4, yAxis4].forEach(styleAxis);
// Up days are circles, down days are triangles — a shape cue alongside color
// so the encoding still reads for red-green color-vision-deficient viewers.
const symbolUp = d3.symbol().type(d3.symbolCircle).size(140);
const symbolDown = d3.symbol().type(d3.symbolTriangle).size(150);
g4
  .selectAll("path.pt")
  .data(dailyVolumes.map((v, i) => ({ volume: v, ret: dailyReturns[i] })))
  .join("path")
  .attr("class", "pt")
  .attr("transform", (d) => `translate(${x4(d.volume)},${y4(d.ret)})`)
  .attr("d", (d) => (d.ret >= 0 ? symbolUp : symbolDown)())
  .attr("fill", (d) => (d.ret >= 0 ? upColor : downColor))
  .attr("fill-opacity", 0.85)
  .attr("stroke", t.pageBg)
  .attr("stroke-width", 1);
legend(
  g4,
  [
    { color: upColor, shape: d3.symbol().type(d3.symbolCircle), label: "Up day" },
    { color: downColor, shape: d3.symbol().type(d3.symbolTriangle), label: "Down day" },
  ],
  8,
  8
);
Runnable source as JSON, for any HTTP client: https://api.anyplot.ai/specs/subplot-grid/d3/code. Any spec id and library id listed in llms-full.txt fit the same URL shape; every URL below is complete and callable.
{
  "spec_id": "subplot-grid",
  "language": "javascript",
  "library": "d3",
  "page": "https://anyplot.ai/subplot-grid/javascript/d3",
  "hub": "https://anyplot.ai/subplot-grid",
  "code_json": "https://api.anyplot.ai/specs/subplot-grid/d3/code",
  "spec_json": "https://api.anyplot.ai/specs/subplot-grid",
  "render_light_png": "https://storage.googleapis.com/anyplot-images/plots/subplot-grid/javascript/d3/plot-light.png",
  "render_dark_png": "https://storage.googleapis.com/anyplot-images/plots/subplot-grid/javascript/d3/plot-dark.png",
  "interactive_light_html": "https://storage.googleapis.com/anyplot-images/plots/subplot-grid/javascript/d3/plot-light.html",
  "interactive_dark_html": "https://storage.googleapis.com/anyplot-images/plots/subplot-grid/javascript/d3/plot-dark.html",
  "quality_score": 87.0,
  "license": "MIT",
  "guide": "https://anyplot.ai/llms.txt"
}
Part of Subplot Grid Layout on anyplot.ai.