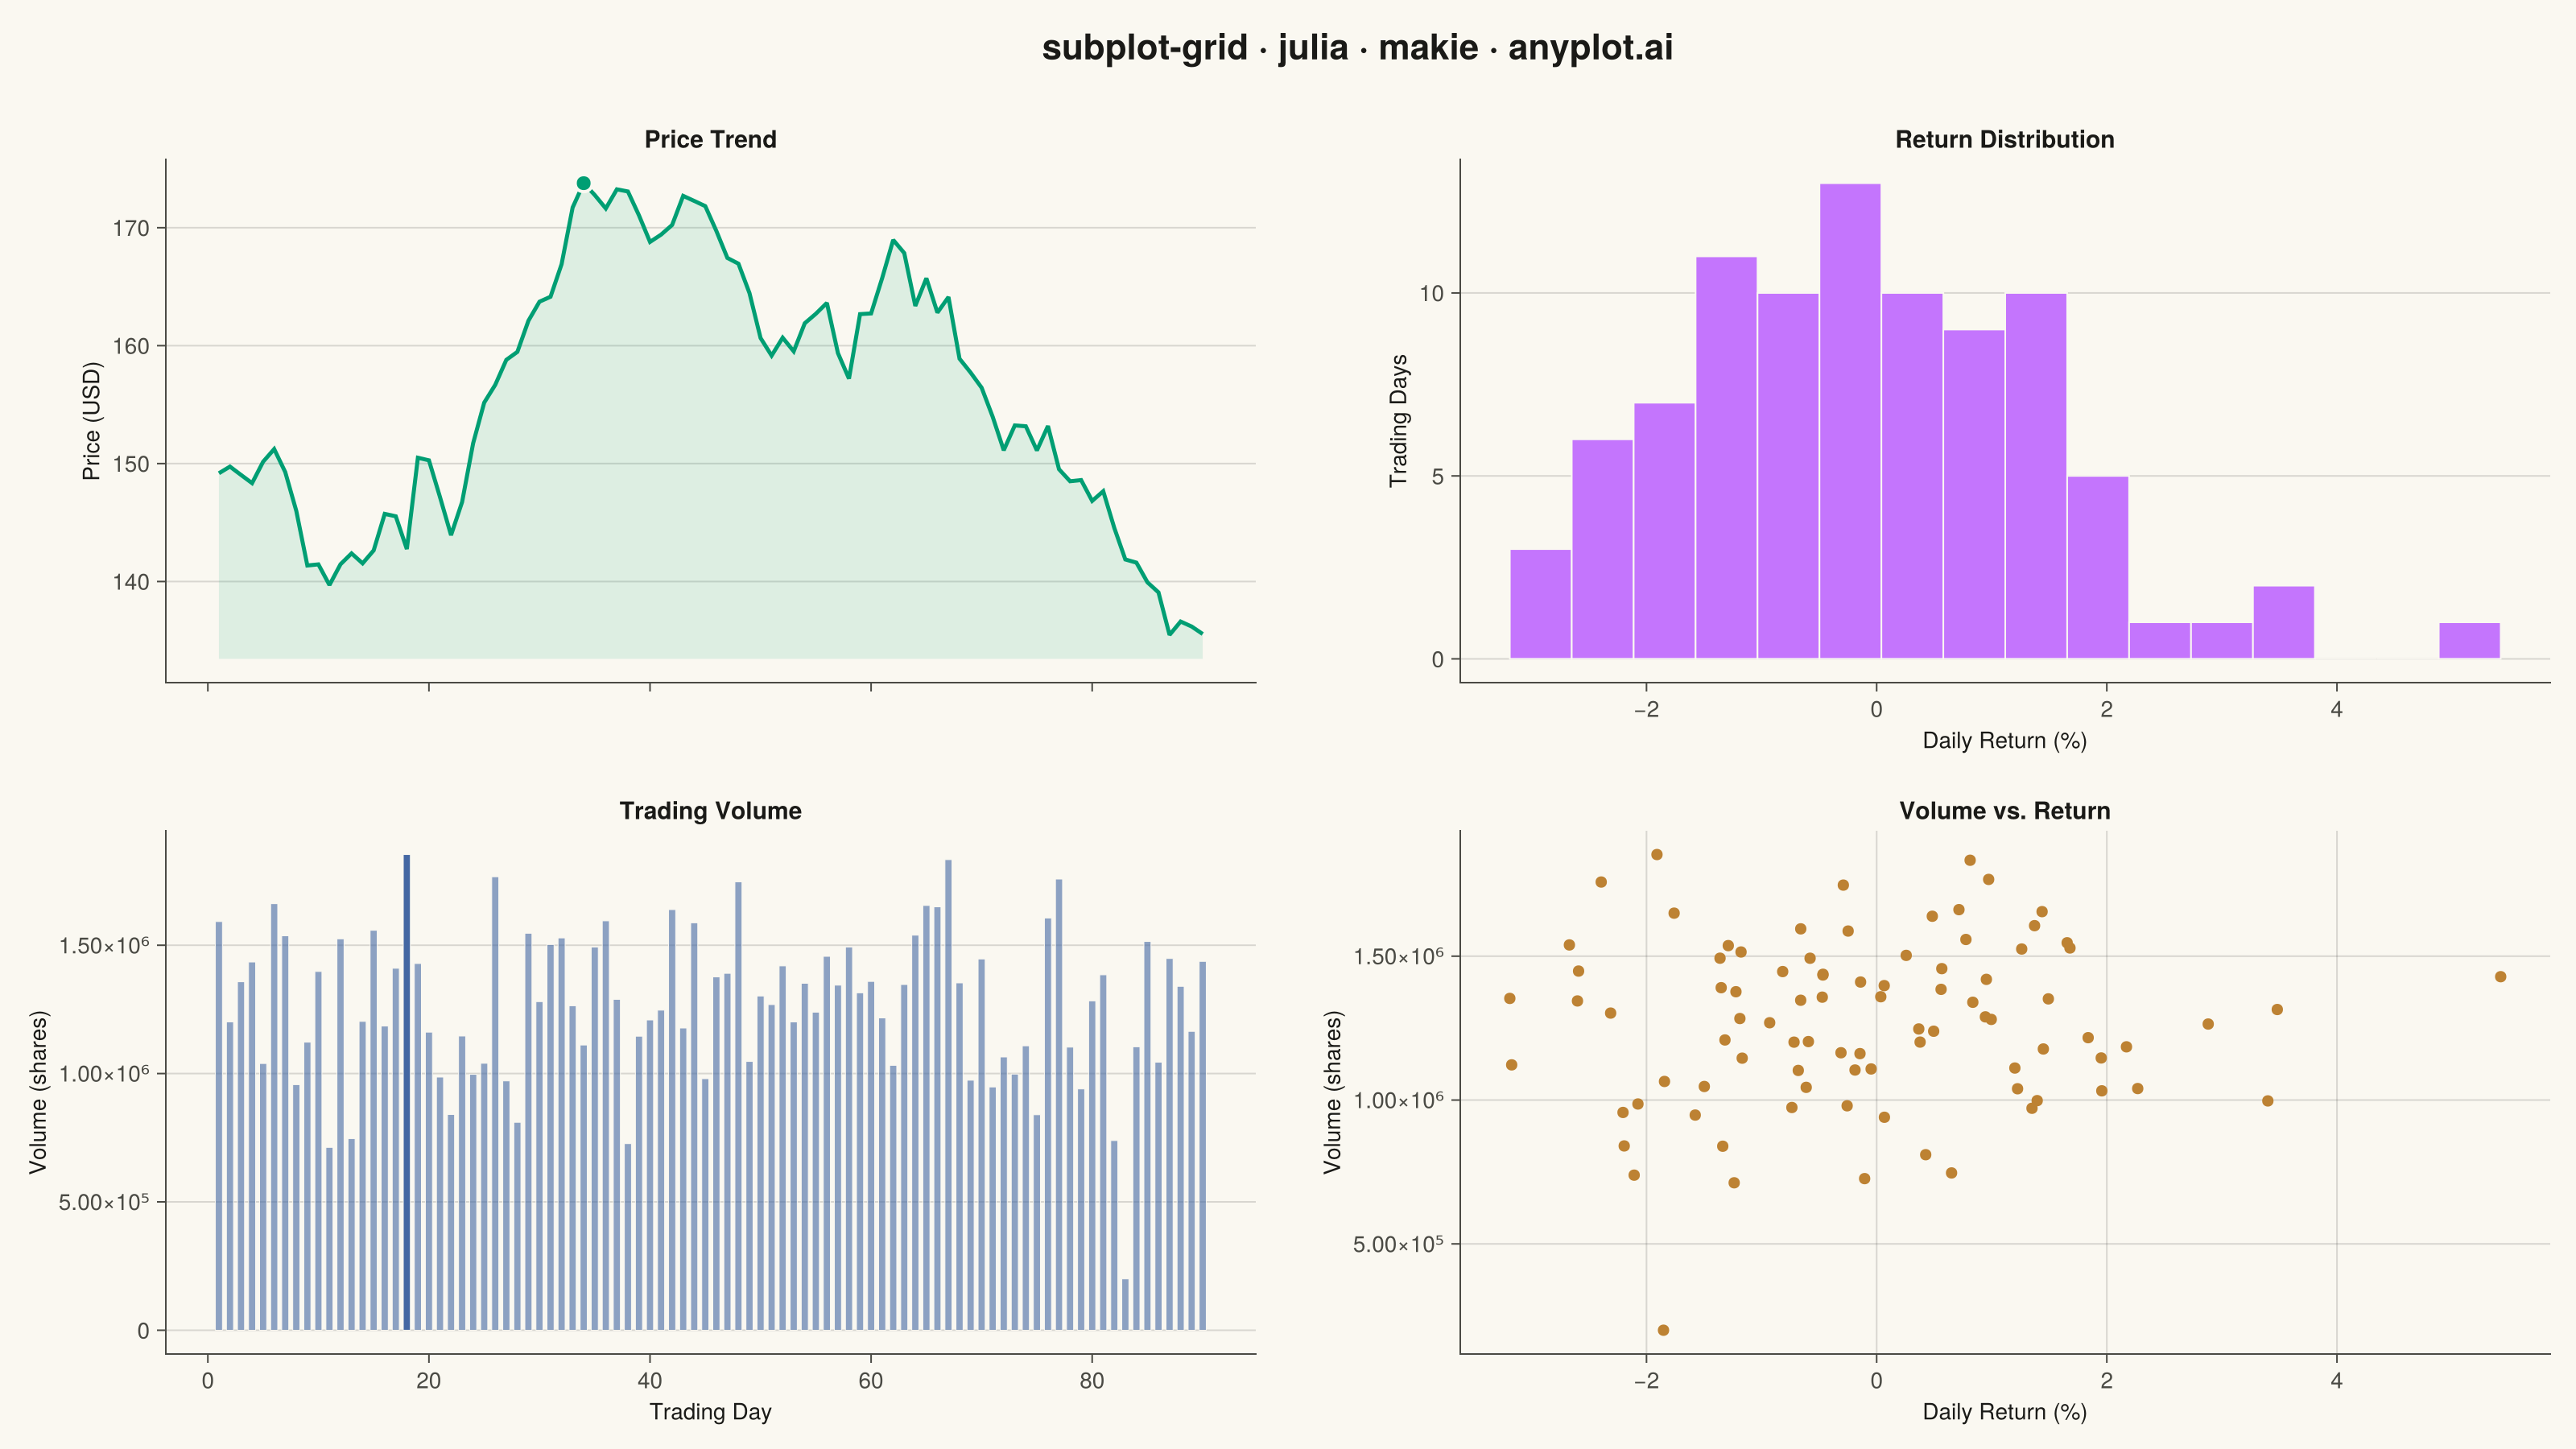
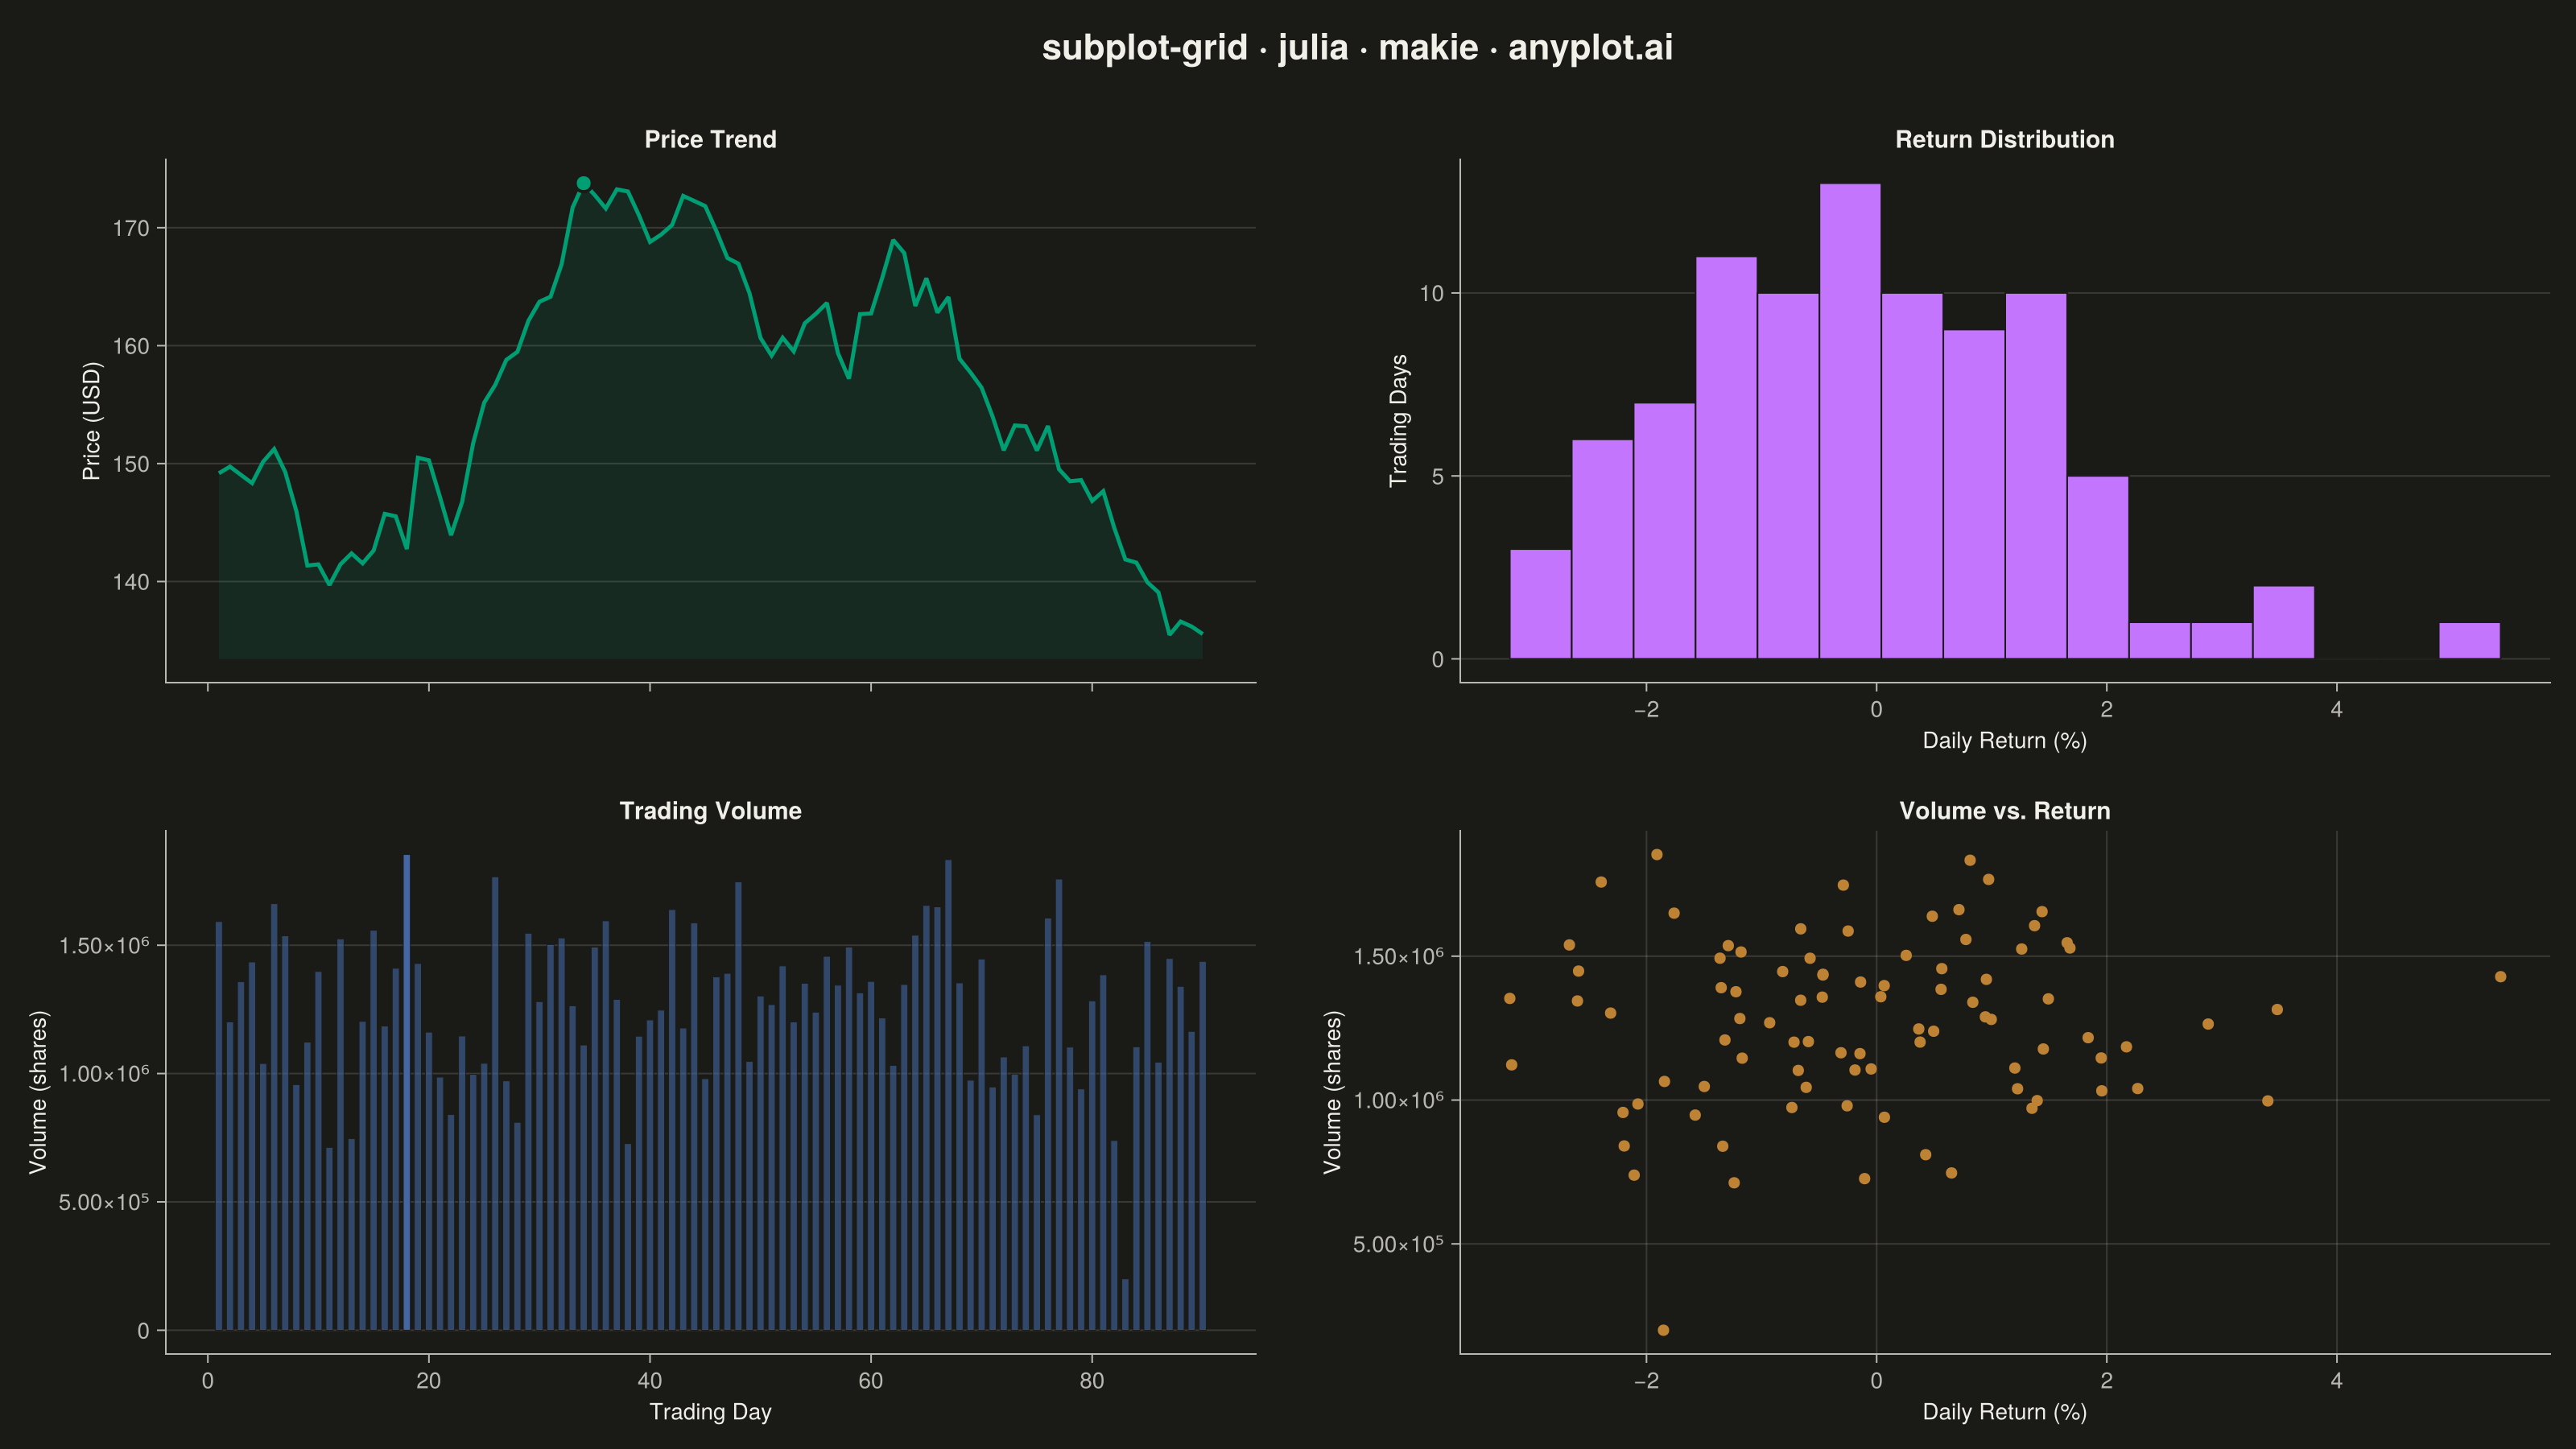
The same plot in 14 other libraries — Python: Altair, Bokeh, lets-plot, Matplotlib, Plotly, plotnine, Pygal, Seaborn; R: ggplot2; JavaScript: Chart.js, D3.js, Apache ECharts, Highcharts, MUI X Charts. Compare all 15 side by side: Subplot Grid Layout in Python, R, Julia and JavaScript.
A customizable grid of multiple subplots allowing different plot types in each cell, with shared or independent axes. Unlike faceted plots that repeat the same visualization for data subsets, subplot grids enable combining distinct visualizations (scatter, line, bar, histogram, etc.) into a cohesive multi-panel figure for comprehensive data presentation.
# anyplot.ai
# subplot-grid: Subplot Grid Layout
# Library: makie 0.21.9 | Julia 1.11.9
# Quality: 94/100 | Created: 2026-09-09

using CairoMakie
using Colors
using Random

Random.seed!(42)

# --- Theme tokens ------------------------------------------------------------
const THEME    = get(ENV, "ANYPLOT_THEME", "light")
const PAGE_BG  = THEME == "light" ? colorant"#FAF8F1" : colorant"#1A1A17"
const INK      = THEME == "light" ? colorant"#1A1A17" : colorant"#F0EFE8"
const INK_SOFT = THEME == "light" ? colorant"#4A4A44" : colorant"#B8B7B0"
const GRID_RGBA = RGBAf(INK.r, INK.g, INK.b, 0.15)
const IMPRINT_PALETTE = [
    colorant"#009E73", colorant"#C475FD", colorant"#4467A3", colorant"#BD8233",
    colorant"#AE3030", colorant"#2ABCCD", colorant"#954477", colorant"#99B314",
]

# --- Data ---------------------------------------------------------------------
# Financial dashboard: closing price, trading volume, return distribution,
# and how daily volume relates to the size of the day's price move.
n_days = 90
trading_day = 1:n_days

daily_pct_change = randn(n_days) .* 0.015
price = 150 .* cumprod(1 .+ daily_pct_change)
daily_return = diff(price) ./ price[1:(end - 1)] .* 100

volume = 1.2e6 .+ 4.5e6 .* abs.(daily_pct_change) .+ 3e5 .* randn(n_days)
volume = max.(volume, 2e5)

# Focal points for the dashboard's two linked panels — highlighted via color/size
# emphasis rather than text callouts (the spec doesn't request annotations).
peak_day    = argmax(price)
spike_day   = argmax(volume)
price_floor = minimum(price) * 0.985

# --- Plot -----------------------------------------------------------------
fig = Figure(
    resolution      = (1600, 900),
    fontsize        = 14,
    backgroundcolor = PAGE_BG,
)

Label(
    fig[0, 1:2],
    "subplot-grid · julia · makie · anyplot.ai";
    fontsize = 22,
    color    = INK,
    font     = :bold,
    padding  = (0, 0, 8, 0),
)

chrome = (;
    backgroundcolor   = PAGE_BG,
    titlecolor        = INK,
    xlabelcolor       = INK,
    ylabelcolor       = INK,
    xticklabelcolor   = INK_SOFT,
    yticklabelcolor   = INK_SOFT,
    xtickcolor        = INK_SOFT,
    ytickcolor        = INK_SOFT,
    leftspinecolor    = INK_SOFT,
    bottomspinecolor  = INK_SOFT,
    topspinevisible   = false,
    rightspinevisible = false,
    xminorgridvisible = false,
    yminorgridvisible = false,
)

ax_price = Axis(
    fig[1, 1];
    title               = "Price Trend",
    titlesize           = 15,
    ylabel              = "Price (USD)",
    ylabelsize          = 14,
    xticklabelsvisible  = false,
    xgridvisible        = false,
    ygridcolor          = GRID_RGBA,
    chrome...,
)

ax_hist = Axis(
    fig[1, 2];
    title        = "Return Distribution",
    titlesize    = 15,
    xlabel       = "Daily Return (%)",
    ylabel       = "Trading Days",
    xlabelsize   = 14,
    ylabelsize   = 14,
    xgridvisible = false,
    ygridcolor   = GRID_RGBA,
    chrome...,
)

ax_volume = Axis(
    fig[2, 1];
    title        = "Trading Volume",
    titlesize    = 15,
    xlabel       = "Trading Day",
    ylabel       = "Volume (shares)",
    xlabelsize   = 14,
    ylabelsize   = 14,
    xgridvisible = false,
    ygridcolor   = GRID_RGBA,
    chrome...,
)

ax_scatter = Axis(
    fig[2, 2];
    title         = "Volume vs. Return",
    titlesize     = 15,
    xlabel        = "Daily Return (%)",
    ylabel        = "Volume (shares)",
    xlabelsize    = 14,
    ylabelsize    = 14,
    xgridcolor    = GRID_RGBA,
    ygridcolor    = GRID_RGBA,
    chrome...,
)

# Price and volume share the trading-day axis — a real dashboard comparison.
linkxaxes!(ax_price, ax_volume)

band!(
    ax_price, trading_day, fill(price_floor, n_days), price;
    color = (IMPRINT_PALETTE[1], 0.12),
)
lines!(ax_price, trading_day, price; color = IMPRINT_PALETTE[1], linewidth = 2.5)
scatter!(
    ax_price, [peak_day], [price[peak_day]];
    color = IMPRINT_PALETTE[1], markersize = 15,
    strokewidth = 2, strokecolor = PAGE_BG,
)

hist!(
    ax_hist, daily_return;
    bins = 16, color = IMPRINT_PALETTE[2],
    strokewidth = 1, strokecolor = PAGE_BG,
)

volume_colors = [
    d == spike_day ? IMPRINT_PALETTE[3] : RGBAf(IMPRINT_PALETTE[3].r, IMPRINT_PALETTE[3].g, IMPRINT_PALETTE[3].b, 0.6)
    for d in trading_day
]
barplot!(
    ax_volume, trading_day, volume;
    color = volume_colors, width = 0.8,
    strokewidth = 0.5, strokecolor = PAGE_BG,
)

scatter!(
    ax_scatter, daily_return, volume[2:end];
    color = IMPRINT_PALETTE[4], markersize = 10, strokewidth = 0,
)

colgap!(fig.layout, 40)
rowgap!(fig.layout, 28)

# --- Save -------------------------------------------------------------------
save("plot-$(THEME).png", fig; px_per_unit = 2)
Runnable source as JSON, for any HTTP client: https://api.anyplot.ai/specs/subplot-grid/makie/code. Any spec id and library id listed in llms-full.txt fit the same URL shape; every URL below is complete and callable.
{
  "spec_id": "subplot-grid",
  "language": "julia",
  "library": "makie",
  "page": "https://anyplot.ai/subplot-grid/julia/makie",
  "hub": "https://anyplot.ai/subplot-grid",
  "code_json": "https://api.anyplot.ai/specs/subplot-grid/makie/code",
  "spec_json": "https://api.anyplot.ai/specs/subplot-grid",
  "render_light_png": "https://storage.googleapis.com/anyplot-images/plots/subplot-grid/julia/makie/plot-light.png",
  "render_dark_png": "https://storage.googleapis.com/anyplot-images/plots/subplot-grid/julia/makie/plot-dark.png",
  "quality_score": 94.0,
  "license": "MIT",
  "guide": "https://anyplot.ai/llms.txt"
}
Part of Subplot Grid Layout on anyplot.ai.