The same plot in 14 other libraries — JavaScript: Chart.js, D3.js, Highcharts, MUI X Charts; Python: Altair, Bokeh, lets-plot, Matplotlib, Plotly, plotnine, Pygal, Seaborn; R: ggplot2; Julia: Makie.jl. Compare all 15 side by side: Subplot Grid Layout in Python, R, Julia and JavaScript.
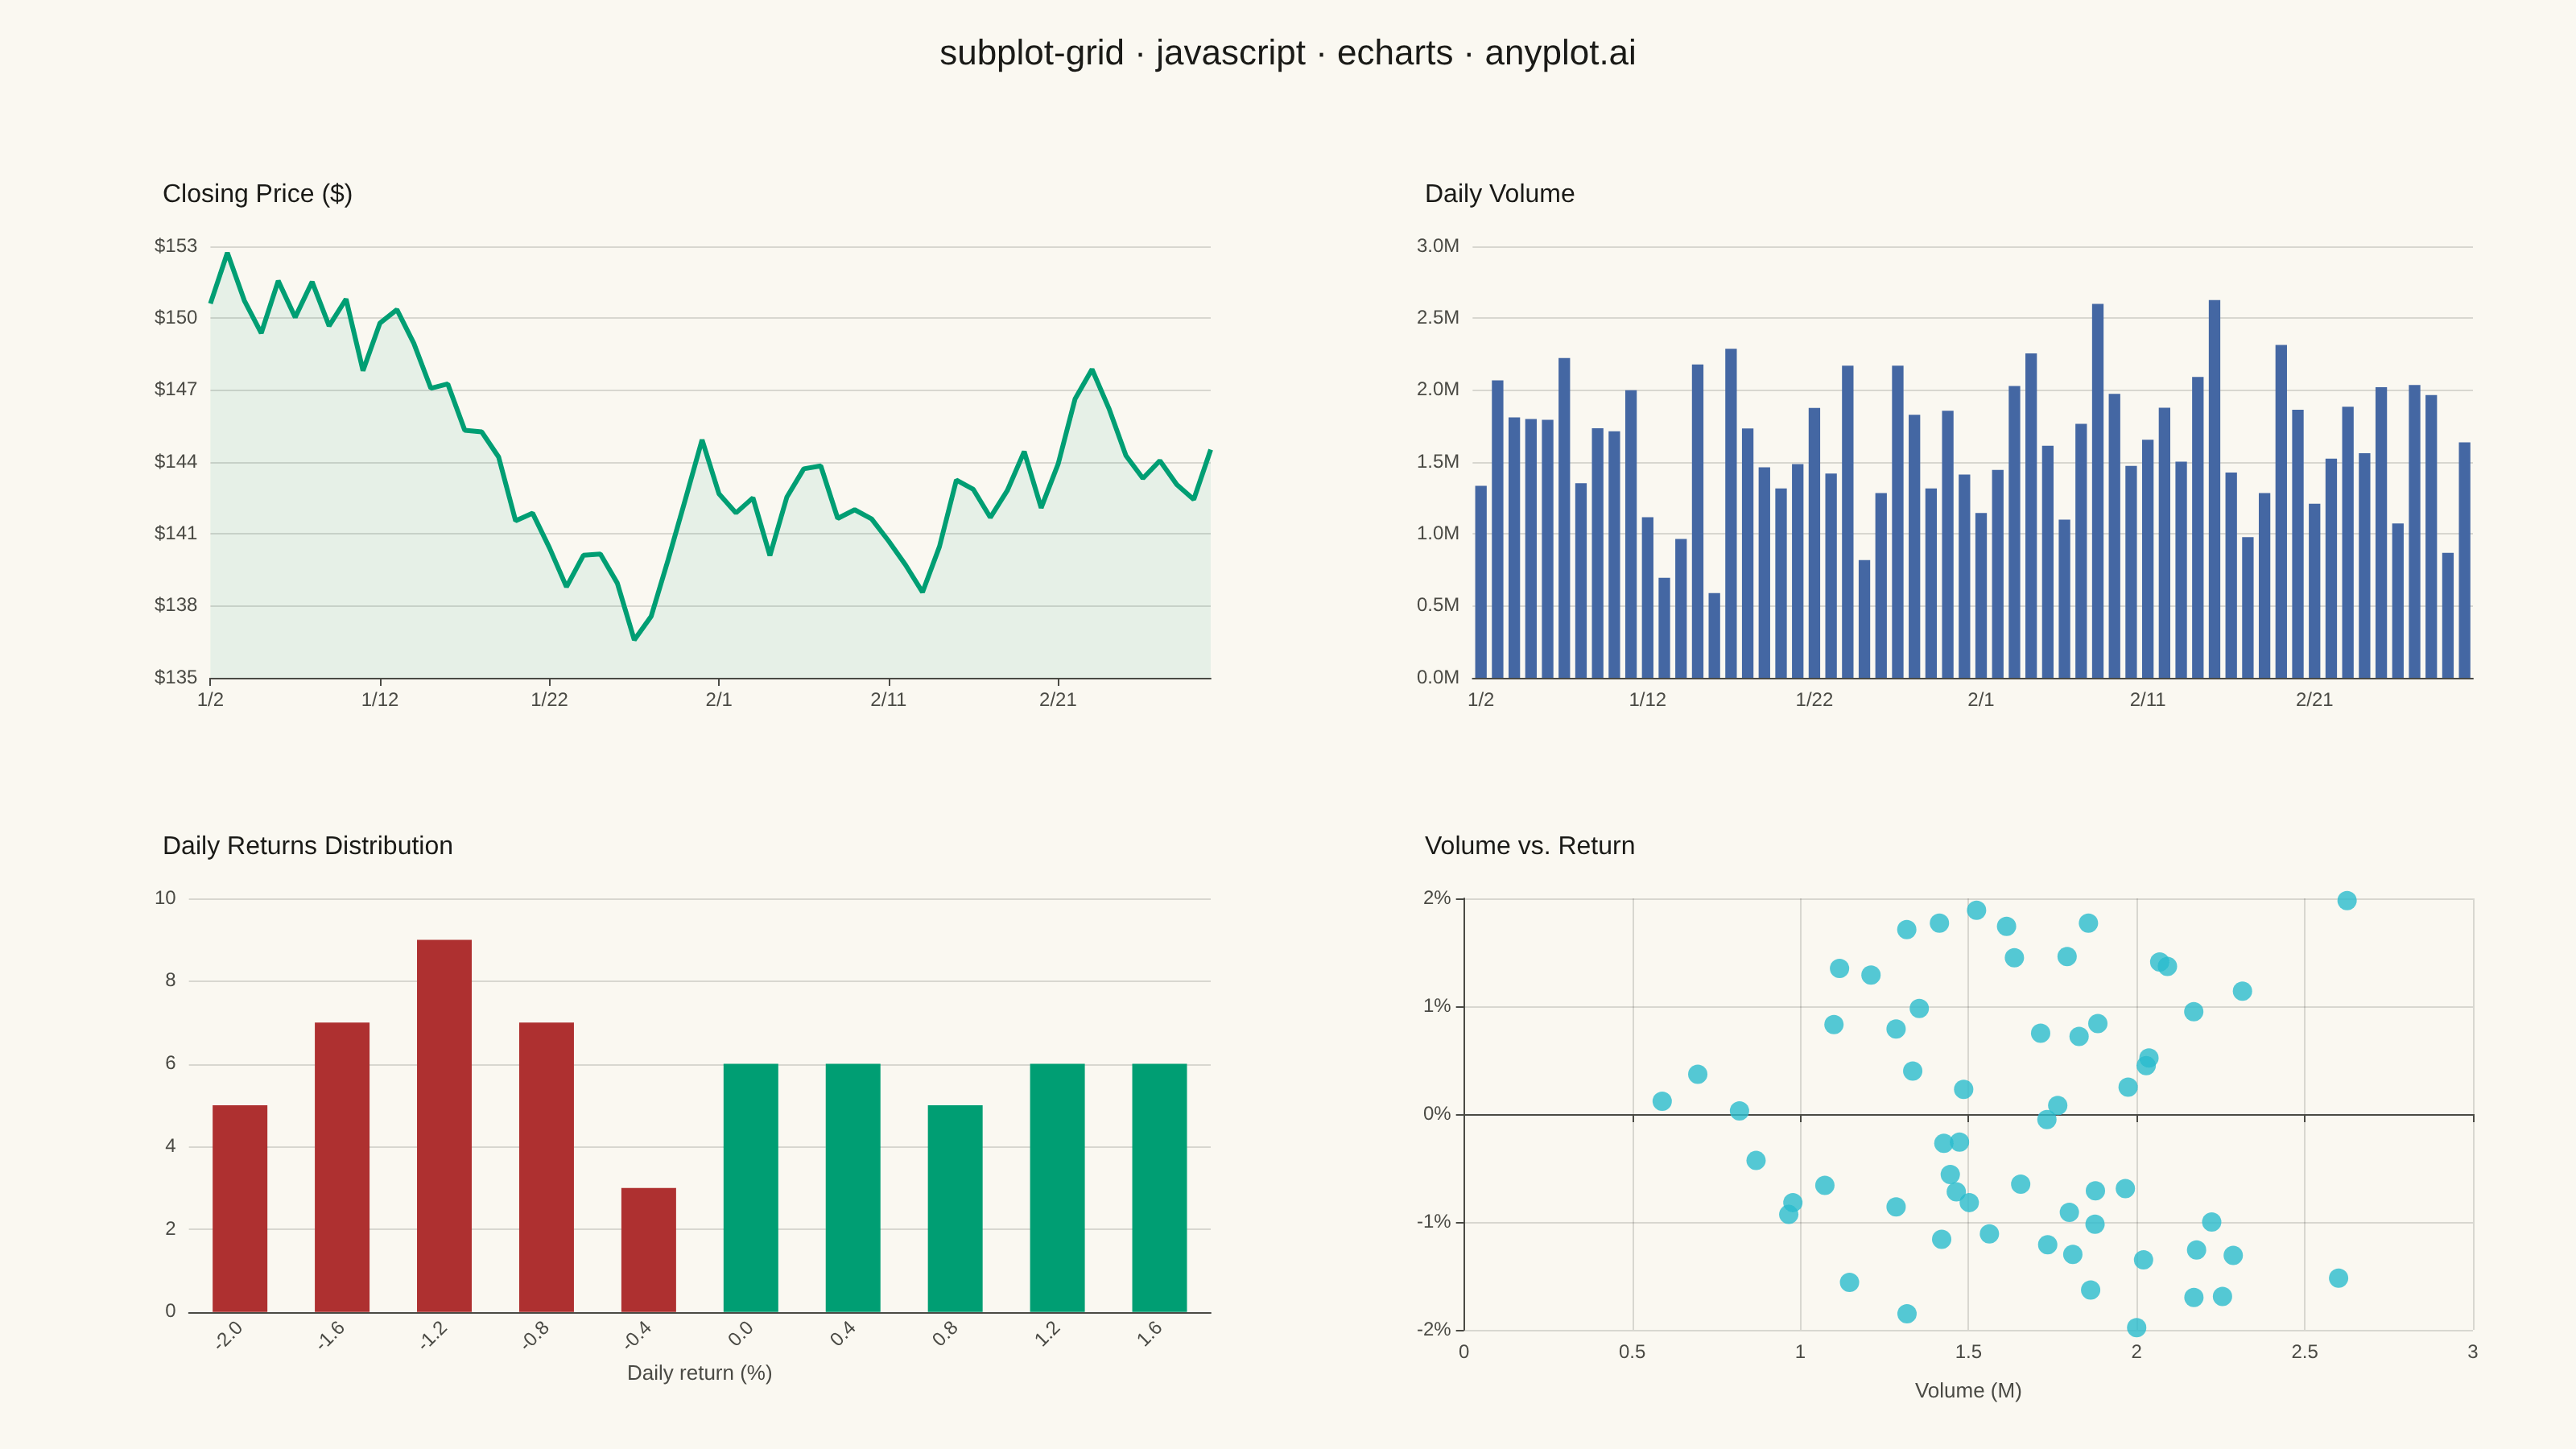
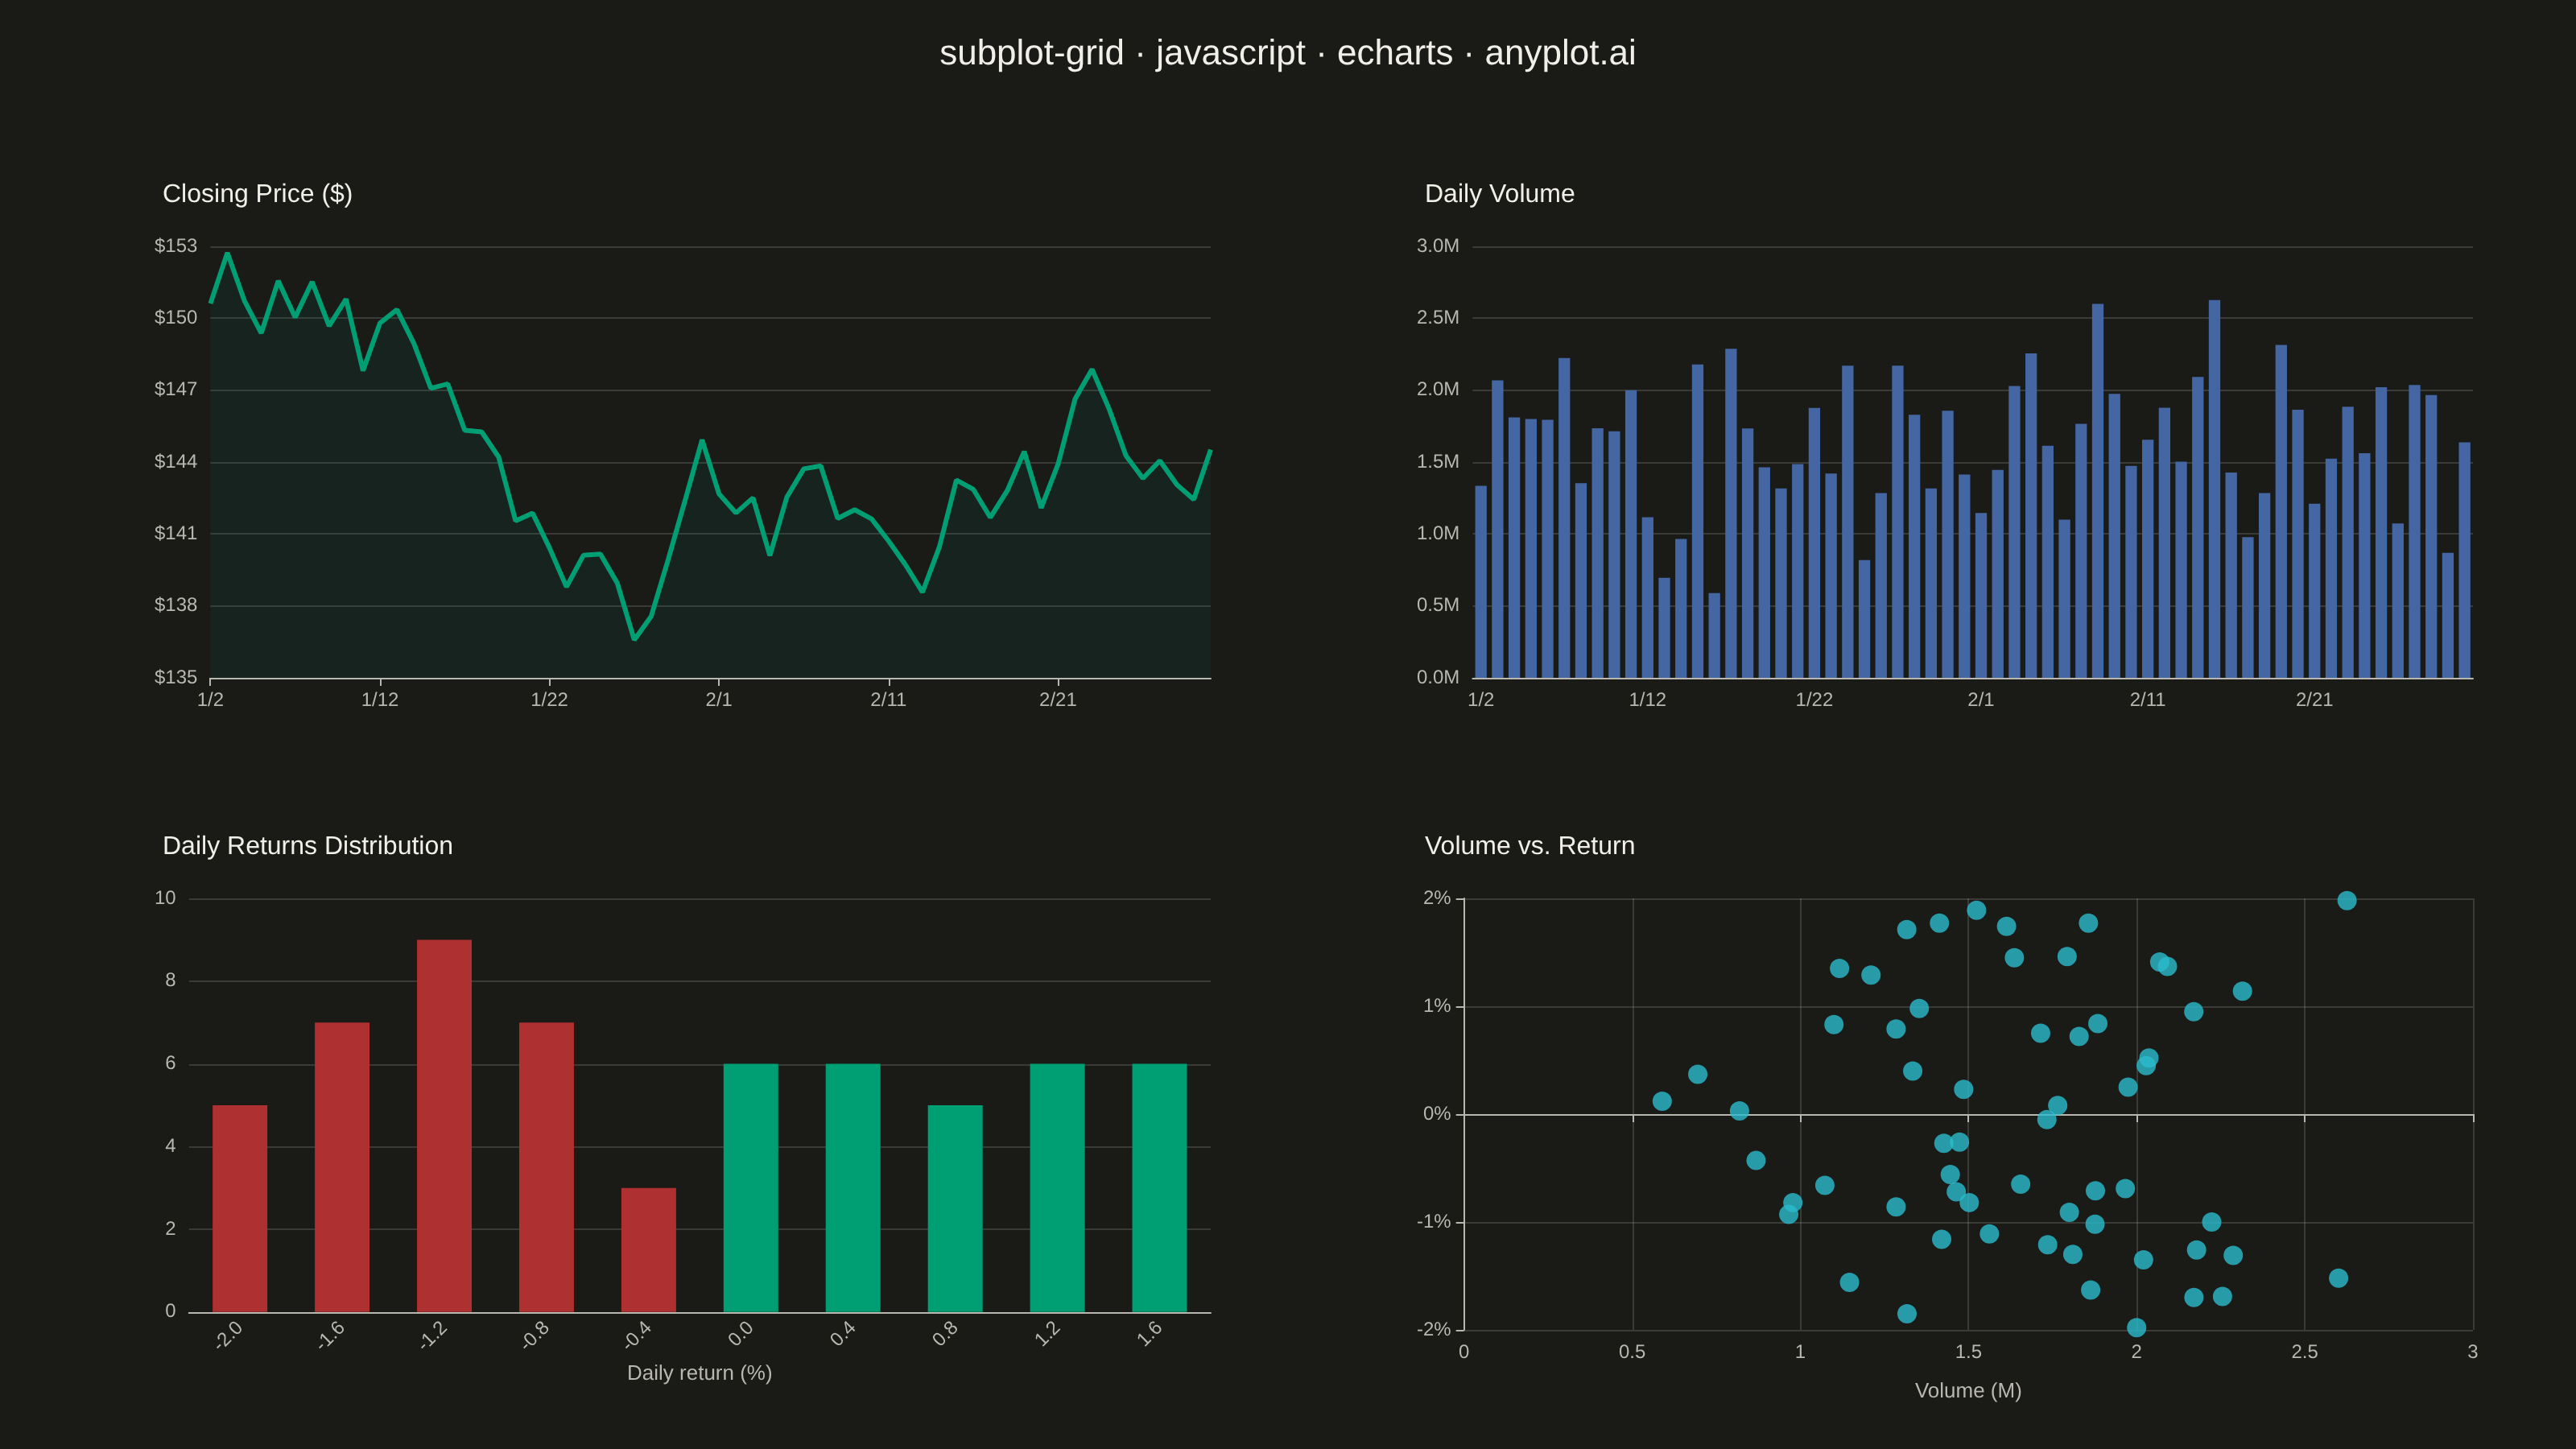
A customizable grid of multiple subplots allowing different plot types in each cell, with shared or independent axes. Unlike faceted plots that repeat the same visualization for data subsets, subplot grids enable combining distinct visualizations (scatter, line, bar, histogram, etc.) into a cohesive multi-panel figure for comprehensive data presentation.
// anyplot.ai
// subplot-grid: Subplot Grid Layout
// Library: echarts 6.1.0 | JavaScript 22.23.2
// Quality: 82/100 | Created: 2026-09-09

const t = window.ANYPLOT_TOKENS;

// --- Data (in-memory, deterministic) ----------------------------------------
// Mulberry32 PRNG — the browser has no seeded Math.random(), so a tiny
// fixed-seed generator stands in for np.random.seed(42) / set.seed(42).
function mulberry32(seed) {
  return () => {
    seed = (seed + 0x6d2b79f5) | 0;
    let x = Math.imul(seed ^ (seed >>> 15), 1 | seed);
    x = (x + Math.imul(x ^ (x >>> 7), 61 | x)) ^ x;
    return ((x ^ (x >>> 14)) >>> 0) / 4294967296;
  };
}
const rand = mulberry32(42);

const DAYS = 60;
const startDate = new Date(Date.UTC(2024, 0, 2));
const dates = [];
const closePrices = [];
const dailyVolumes = [];
const dailyReturns = [];

let price = 150;
for (let i = 0; i < DAYS; i++) {
  const d = new Date(startDate);
  d.setUTCDate(d.getUTCDate() + i);
  dates.push(`${d.getUTCMonth() + 1}/${d.getUTCDate()}`);

  const changePct = (rand() - 0.5) * 4; // daily move in [-2%, +2%]
  price *= 1 + changePct / 100;
  closePrices.push(Math.round(price * 100) / 100);
  dailyReturns.push(Math.round(changePct * 100) / 100);

  const baseVolume = 500000 + rand() * 1500000;
  const spike = Math.abs(changePct) * 400000; // big moves trade heavier volume
  dailyVolumes.push(Math.round(baseVolume + spike));
}

// Histogram of daily returns — 10 equal-width bins.
const BIN_COUNT = 10;
const minReturn = Math.min(...dailyReturns);
const maxReturn = Math.max(...dailyReturns);
const binWidth = (maxReturn - minReturn) / BIN_COUNT;
const binLabels = [];
const binCounts = new Array(BIN_COUNT).fill(0);
for (let i = 0; i < BIN_COUNT; i++) {
  binLabels.push((minReturn + i * binWidth).toFixed(1));
}
dailyReturns.forEach((r) => {
  let idx = Math.floor((r - minReturn) / binWidth);
  if (idx >= BIN_COUNT) idx = BIN_COUNT - 1;
  if (idx < 0) idx = 0;
  binCounts[idx]++;
});
const binData = binCounts.map((count, i) => ({
  value: count,
  // Semantic exception: up/gain -> green, down/loss -> red (finance convention).
  itemStyle: { color: Number(binLabels[i]) >= 0 ? t.palette[0] : t.palette[4] },
}));

// Volume-vs-return scatter (bottom-right cell) — volume in millions.
const returnVsVolume = dailyReturns.map((r, i) => [dailyVolumes[i] / 1e6, r]);

// --- Init ---------------------------------------------------------------
const chart = echarts.init(document.getElementById("container"));

// --- Option ---------------------------------------------------------------
// Layout: 2x2 grid — each cell a distinct plot type against the same trading
// window. Top row shares the date axis geometry (price vs. volume, same
// x-domain and width) for direct visual comparison; bottom row uses
// independent axes since the histogram (return bins) and scatter (volume)
// plot unrelated domains.
const COLUMN = { left: "6%", width: "41%" };
const COLUMN_RIGHT = { left: "55%", width: "41%" };
const ROW_TOP = { top: "16%", height: "30%" };
const ROW_BOTTOM = { top: "63%", height: "30%" };

chart.setOption({
  animation: false,
  color: t.palette,
  backgroundColor: "transparent",
  textStyle: { color: t.inkSoft },
  tooltip: { trigger: "axis" },
  title: [
    {
      text: "subplot-grid · javascript · echarts · anyplot.ai",
      left: "center",
      top: "2%",
      textStyle: { color: t.ink, fontSize: 22, fontWeight: 500 },
    },
    { text: "Closing Price ($)", left: COLUMN.left, top: "10%", textStyle: { color: t.ink, fontSize: 17, fontWeight: "normal" } },
    { text: "Daily Volume", left: COLUMN_RIGHT.left, top: "10%", textStyle: { color: t.ink, fontSize: 17, fontWeight: "normal" } },
    { text: "Daily Returns Distribution", left: COLUMN.left, top: "56%", textStyle: { color: t.ink, fontSize: 17, fontWeight: "normal" } },
    { text: "Volume vs. Return", left: COLUMN_RIGHT.left, top: "56%", textStyle: { color: t.ink, fontSize: 17, fontWeight: "normal" } },
  ],
  grid: [
    { ...COLUMN, ...ROW_TOP, containLabel: true }, // 0: price line
    { ...COLUMN_RIGHT, ...ROW_TOP, containLabel: true }, // 1: volume bar
    { ...COLUMN, ...ROW_BOTTOM, containLabel: true }, // 2: returns histogram
    { ...COLUMN_RIGHT, ...ROW_BOTTOM, containLabel: true }, // 3: volume-vs-return scatter
  ],
  xAxis: [
    {
      gridIndex: 0,
      type: "category",
      data: dates,
      boundaryGap: false,
      axisLabel: { color: t.inkSoft, fontSize: 13, interval: 9 },
      axisLine: { lineStyle: { color: t.inkSoft } },
      splitLine: { show: false },
    },
    {
      gridIndex: 1,
      type: "category",
      data: dates,
      axisLabel: { color: t.inkSoft, fontSize: 13, interval: 9 },
      axisLine: { lineStyle: { color: t.inkSoft } },
      splitLine: { show: false },
    },
    {
      gridIndex: 2,
      type: "category",
      data: binLabels,
      name: "Daily return (%)",
      nameLocation: "middle",
      nameGap: 32,
      nameTextStyle: { color: t.inkSoft, fontSize: 14 },
      axisLabel: { color: t.inkSoft, fontSize: 13, rotate: 45 },
      axisLine: { lineStyle: { color: t.inkSoft } },
      splitLine: { show: false },
    },
    {
      gridIndex: 3,
      type: "value",
      name: "Volume (M)",
      nameLocation: "middle",
      nameGap: 32,
      nameTextStyle: { color: t.inkSoft, fontSize: 14 },
      axisLabel: { color: t.inkSoft, fontSize: 13 },
      axisLine: { lineStyle: { color: t.inkSoft } },
      splitLine: { lineStyle: { color: t.grid } },
    },
  ],
  yAxis: [
    {
      // Extra headroom (not plain scale:true) so the "Period high" markPoint
      // pin has clearance above the line and never collides with the subtitle.
      gridIndex: 0,
      type: "value",
      min: (value) => Math.floor(value.min - (value.max - value.min) * 0.08),
      max: (value) => Math.ceil(value.max + (value.max - value.min) * 0.18),
      axisLabel: { color: t.inkSoft, fontSize: 13, formatter: "${value}" },
      axisLine: { lineStyle: { color: t.inkSoft } },
      splitLine: { lineStyle: { color: t.grid } },
    },
    {
      gridIndex: 1,
      type: "value",
      axisLabel: { color: t.inkSoft, fontSize: 13, formatter: (v) => `${(v / 1e6).toFixed(1)}M` },
      axisLine: { lineStyle: { color: t.inkSoft } },
      splitLine: { lineStyle: { color: t.grid } },
    },
    {
      gridIndex: 2,
      type: "value",
      axisLabel: { color: t.inkSoft, fontSize: 13 },
      axisLine: { lineStyle: { color: t.inkSoft } },
      splitLine: { lineStyle: { color: t.grid } },
    },
    {
      gridIndex: 3,
      type: "value",
      axisLabel: { color: t.inkSoft, fontSize: 13, formatter: "{value}%" },
      axisLine: { lineStyle: { color: t.inkSoft } },
      splitLine: { lineStyle: { color: t.grid } },
    },
  ],
  series: [
    {
      name: "Close price",
      type: "line",
      xAxisIndex: 0,
      yAxisIndex: 0,
      data: closePrices,
      showSymbol: false,
      lineStyle: { width: 3, color: t.palette[0] },
      areaStyle: { color: t.palette[0], opacity: 0.08 },
      markPoint: {
        symbolSize: 48,
        symbolOffset: [22, "-45%"],
        itemStyle: { color: t.palette[0] },
        label: { color: "#fff", fontSize: 11, fontWeight: 600, formatter: (p) => `$${p.value.toFixed(2)}` },
        data: [{ type: "max", name: "Period high" }],
      },
    },
    {
      name: "Volume",
      type: "bar",
      xAxisIndex: 1,
      yAxisIndex: 1,
      data: dailyVolumes,
      itemStyle: { color: t.palette[2] },
      barMaxWidth: 10,
      markPoint: {
        symbolSize: 52,
        itemStyle: { color: t.palette[2] },
        label: { color: "#fff", fontSize: 10, fontWeight: 600, formatter: (p) => `${(p.value / 1e6).toFixed(1)}M` },
        data: [{ type: "max", name: "Peak volume" }],
      },
    },
    {
      name: "Return frequency",
      type: "bar",
      xAxisIndex: 2,
      yAxisIndex: 2,
      data: binData,
      barMaxWidth: 34,
    },
    {
      name: "Volume vs. return",
      type: "scatter",
      xAxisIndex: 3,
      yAxisIndex: 3,
      data: returnVsVolume,
      symbolSize: 12,
      itemStyle: { color: t.palette[5], opacity: 0.8 },
    },
  ],
});
Runnable source as JSON, for any HTTP client: https://api.anyplot.ai/specs/subplot-grid/echarts/code. Any spec id and library id listed in llms-full.txt fit the same URL shape; every URL below is complete and callable.
{
  "spec_id": "subplot-grid",
  "language": "javascript",
  "library": "echarts",
  "page": "https://anyplot.ai/subplot-grid/javascript/echarts",
  "hub": "https://anyplot.ai/subplot-grid",
  "code_json": "https://api.anyplot.ai/specs/subplot-grid/echarts/code",
  "spec_json": "https://api.anyplot.ai/specs/subplot-grid",
  "render_light_png": "https://storage.googleapis.com/anyplot-images/plots/subplot-grid/javascript/echarts/plot-light.png",
  "render_dark_png": "https://storage.googleapis.com/anyplot-images/plots/subplot-grid/javascript/echarts/plot-dark.png",
  "interactive_light_html": "https://storage.googleapis.com/anyplot-images/plots/subplot-grid/javascript/echarts/plot-light.html",
  "interactive_dark_html": "https://storage.googleapis.com/anyplot-images/plots/subplot-grid/javascript/echarts/plot-dark.html",
  "quality_score": 82.0,
  "license": "MIT",
  "guide": "https://anyplot.ai/llms.txt"
}
Part of Subplot Grid Layout on anyplot.ai.