The same plot in 14 other libraries — JavaScript: D3.js, Apache ECharts, Highcharts, MUI X Charts; Python: Altair, Bokeh, lets-plot, Matplotlib, Plotly, plotnine, Pygal, Seaborn; R: ggplot2; Julia: Makie.jl. Compare all 15 side by side: Mosaic Subplot Layout with Varying Sizes in Python, R, Julia and JavaScript.
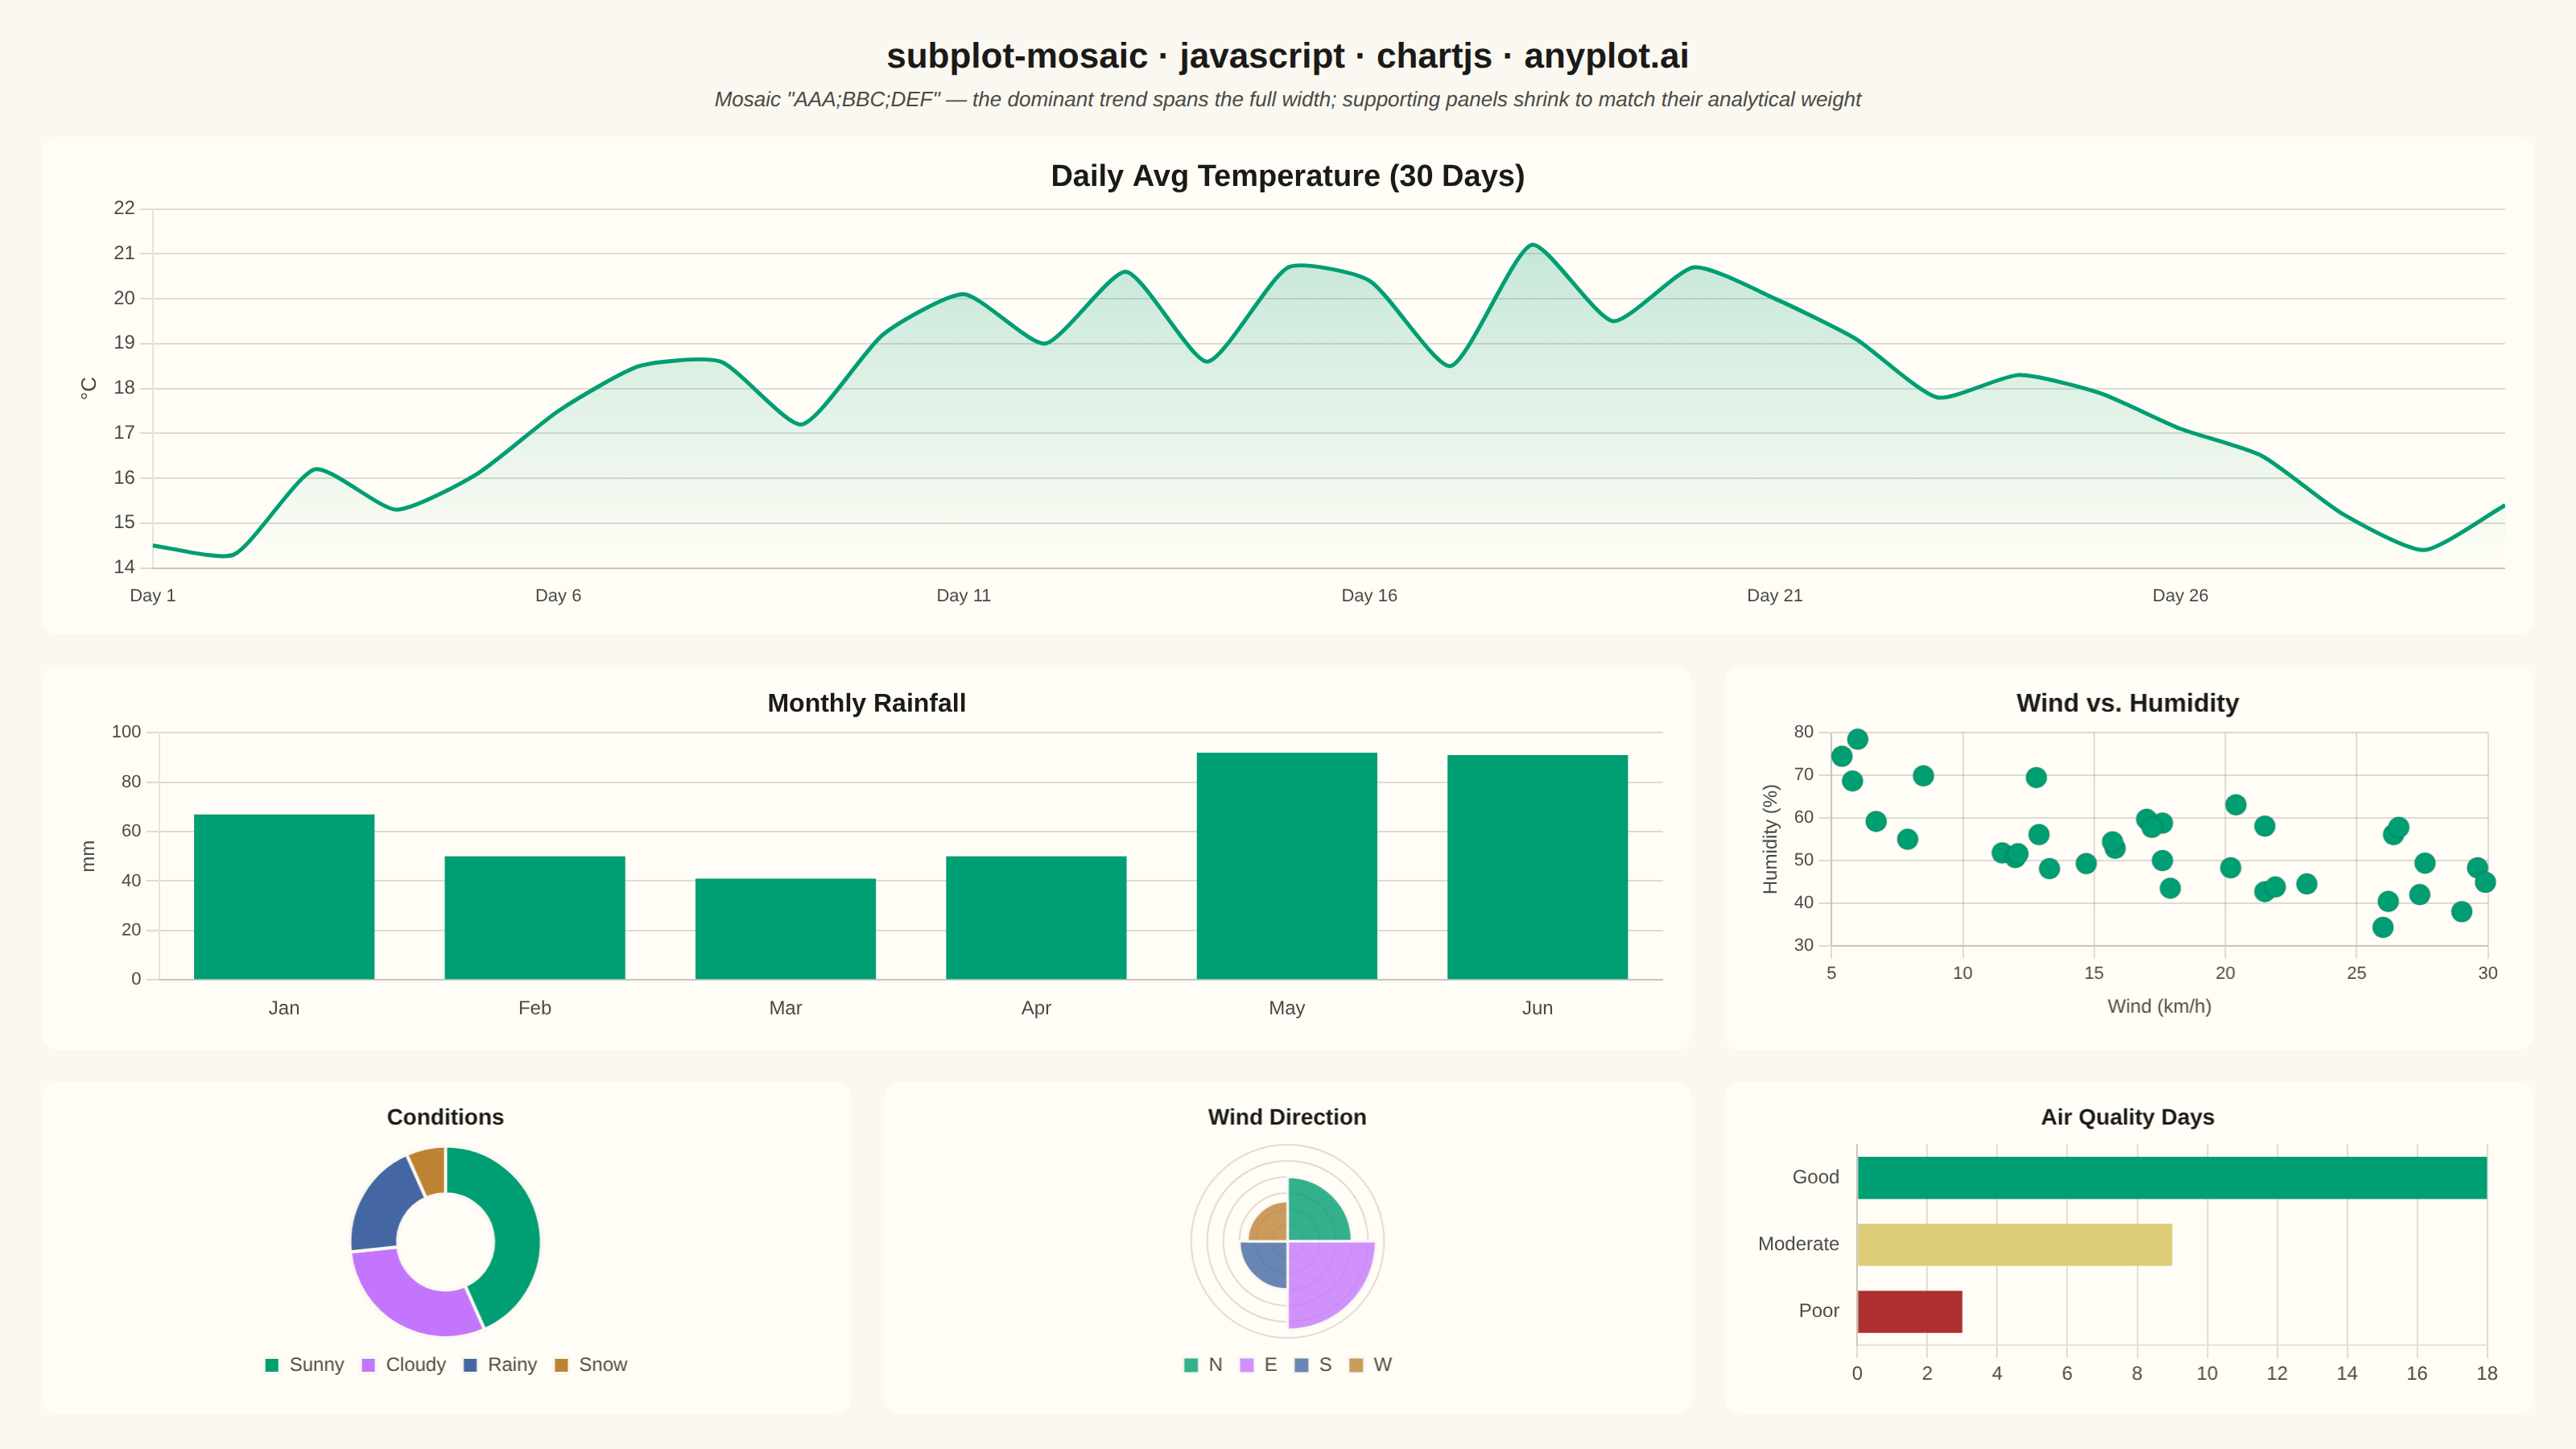
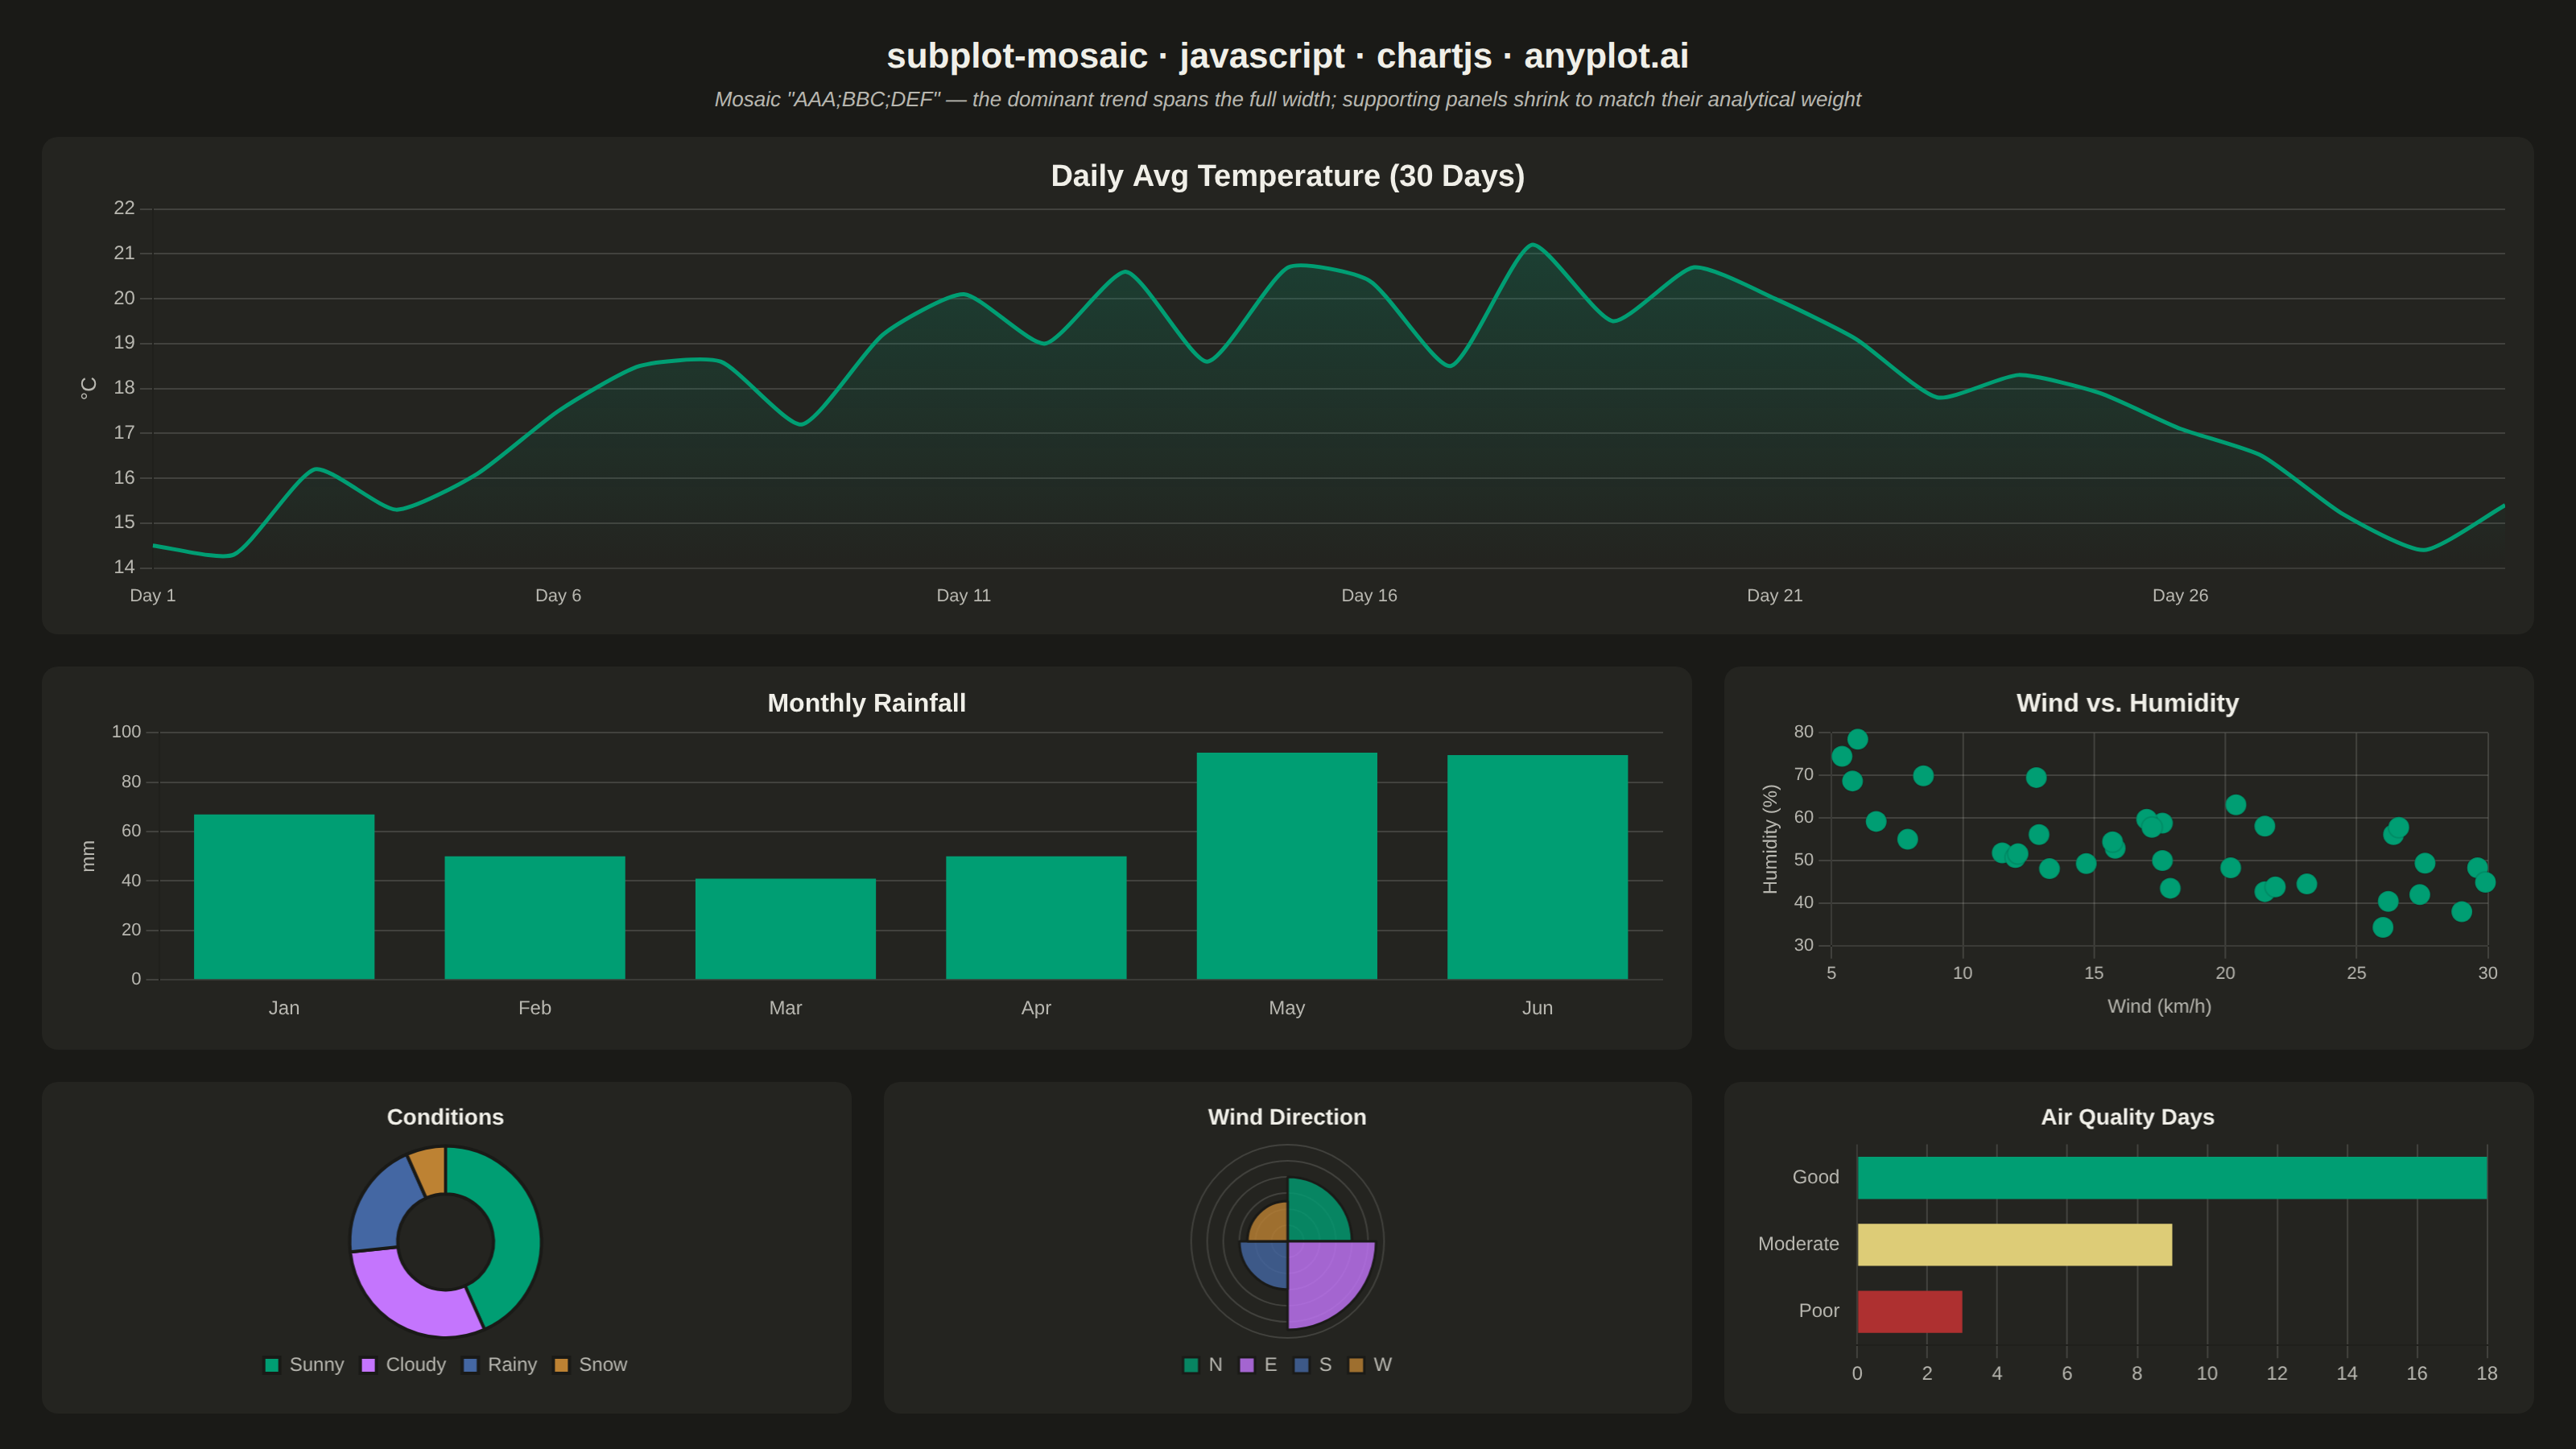
A complex subplot layout where different subplots can have varying sizes and arrangements using intuitive ASCII-art style string definitions. Unlike GridSpec approaches that require explicit row/column spanning, mosaic layouts allow defining layouts through visual string patterns (e.g., "AB;CC" creates A and B on top, C spanning below), making complex configurations more readable and maintainable.
// anyplot.ai
// subplot-mosaic: Mosaic Subplot Layout with Varying Sizes
// Library: chartjs 4.4.7 | JavaScript 22.23.2
// Quality: 91/100 | Created: 2026-09-09

const t = window.ANYPLOT_TOKENS;

// --- Data: 30-day weather station dashboard (deterministic LCG) ------------
function lcg(seed) {
  let state = seed >>> 0;
  return function () {
    state = (1103515245 * state + 12345) & 0x7fffffff;
    return state / 0x7fffffff;
  };
}
const rand = lcg(11);

const numDays = 30;
const dayLabels = Array.from({ length: numDays }, (_, i) => `Day ${i + 1}`);
const temperatures = Array.from({ length: numDays }, (_, i) =>
  Number((14 + 6 * Math.sin((i / numDays) * Math.PI) + (rand() - 0.5) * 3).toFixed(1))
);

const months = ["Jan", "Feb", "Mar", "Apr", "May", "Jun"];
const rainfallMm = months.map(() => Math.round(40 + rand() * 60));

const windHumidityPoints = Array.from({ length: 35 }, () => {
  const windSpeed = Number((5 + rand() * 25).toFixed(1));
  const humidity = Number(
    Math.max(20, Math.min(95, 75 - windSpeed * 1.1 + (rand() - 0.5) * 25)).toFixed(1)
  );
  return { x: windSpeed, y: humidity };
});

const conditionLabels = ["Sunny", "Cloudy", "Rainy", "Snow"];
const conditionCounts = [13, 9, 6, 2]; // sums to numDays

const directionLabels = ["N", "E", "S", "W"];
const directionCounts = [8, 11, 6, 5]; // sums to numDays

// Air-quality tiers use the traffic-light semantic exception (good/warning/bad)
const aqiLabels = ["Good", "Moderate", "Poor"];
const aqiCounts = [18, 9, 3]; // sums to numDays
const aqiColors = [t.palette[0], t.amber, t.palette[4]];

// --- Layout: "AAA;BBC;DEF" mosaic string -> CSS grid-template-areas --------
// Mirrors the ASCII-art mosaic syntax from the spec (e.g. matplotlib's
// subplot_mosaic "AB;CC"): repeated letters span cells, each unique letter
// becomes one independently-sized Chart.js canvas.
const mosaicPattern = "AAA;BBC;DEF";
const mosaicRows = mosaicPattern.split(";");
const gridTemplateAreas = mosaicRows.map((row) => `"${row.split("").join(" ")}"`).join(" ");

const root = document.createElement("div");
root.style.cssText = `
  width: 100%; height: 100%; box-sizing: border-box;
  display: flex; flex-direction: column;
  padding: 22px 26px; background: ${t.pageBg};
  font-family: -apple-system, "Segoe UI", Roboto, sans-serif;
`;
document.getElementById("container").appendChild(root);

const header = document.createElement("div");
header.textContent = "subplot-mosaic · javascript · chartjs · anyplot.ai";
header.style.cssText = `
  color: ${t.ink}; font-size: 22px; font-weight: 600;
  text-align: center; flex-shrink: 0; margin-bottom: 6px;
`;
root.appendChild(header);

const caption = document.createElement("div");
caption.textContent =
  "Mosaic \"AAA;BBC;DEF\" — the dominant trend spans the full width; supporting panels shrink to match their analytical weight";
caption.style.cssText = `
  color: ${t.inkSoft}; font-size: 13px; font-style: italic;
  text-align: center; flex-shrink: 0; margin-bottom: 16px;
`;
root.appendChild(caption);

const grid = document.createElement("div");
grid.style.cssText = `
  flex: 1; min-height: 0;
  display: grid; grid-template-columns: repeat(3, 1fr);
  grid-template-rows: 1.5fr 1.15fr 1fr; grid-template-areas: ${gridTemplateAreas};
  gap: 20px;
`;
root.appendChild(grid);

function makeCell(area) {
  const cell = document.createElement("div");
  cell.style.cssText = `
    grid-area: ${area}; position: relative; min-width: 0; min-height: 0; box-sizing: border-box;
    background: ${t.elevatedBg}; border-radius: 10px; padding: 14px 18px;
  `;
  const canvas = document.createElement("canvas");
  cell.appendChild(canvas);
  grid.appendChild(cell);
  return canvas;
}

const titleFont = (size) => ({ display: true, text: "", color: t.ink, font: { size, weight: "600" }, padding: { bottom: 8 } });
const panelTitle = (text, size) => ({ ...titleFont(size), text });
const axisTicks = (size) => ({ color: t.inkSoft, font: { size } });
const axisTitle = (text, size) => ({ display: true, text, color: t.inkSoft, font: { size } });

// Panel A (dominant, full width): 30-day temperature trend
new Chart(makeCell("A"), {
  type: "line",
  data: {
    labels: dayLabels,
    datasets: [
      {
        label: "Avg Temperature",
        data: temperatures,
        borderColor: t.palette[0],
        backgroundColor: (context) => {
          const { ctx, chartArea } = context.chart;
          if (!chartArea) return `${t.palette[0]}00`;
          const gradient = ctx.createLinearGradient(0, chartArea.top, 0, chartArea.bottom);
          gradient.addColorStop(0, `${t.palette[0]}40`);
          gradient.addColorStop(1, `${t.palette[0]}00`);
          return gradient;
        },
        fill: true,
        borderWidth: 2.5,
        pointRadius: 0,
        tension: 0.2,
      },
    ],
  },
  options: {
    responsive: true,
    maintainAspectRatio: false,
    animation: false,
    plugins: {
      title: panelTitle("Daily Avg Temperature (30 Days)", 19),
      legend: { display: false },
    },
    scales: {
      x: {
        ticks: { ...axisTicks(11), autoSkip: false, callback: (_v, i) => (i % 5 === 0 ? dayLabels[i] : null) },
        grid: { display: false },
      },
      y: { ticks: axisTicks(12), grid: { color: t.grid }, title: axisTitle("°C", 13) },
    },
  },
});

// Panel B (medium, 2 cols): rainfall by month
new Chart(makeCell("B"), {
  type: "bar",
  data: {
    labels: months,
    datasets: [{ label: "Rainfall", data: rainfallMm, backgroundColor: t.palette[0], borderWidth: 0 }],
  },
  options: {
    responsive: true,
    maintainAspectRatio: false,
    animation: false,
    plugins: { title: panelTitle("Monthly Rainfall", 16), legend: { display: false } },
    scales: {
      x: { ticks: axisTicks(12), grid: { display: false } },
      y: { ticks: axisTicks(11), grid: { color: t.grid }, title: axisTitle("mm", 12), beginAtZero: true },
    },
  },
});

// Panel C (medium, 1 col): wind speed vs. humidity
new Chart(makeCell("C"), {
  type: "scatter",
  data: {
    datasets: [{ label: "Reading", data: windHumidityPoints, backgroundColor: t.palette[0], pointRadius: 6.5 }],
  },
  options: {
    responsive: true,
    maintainAspectRatio: false,
    animation: false,
    plugins: { title: panelTitle("Wind vs. Humidity", 16), legend: { display: false } },
    scales: {
      x: { ticks: axisTicks(11), grid: { color: t.grid }, title: axisTitle("Wind (km/h)", 12) },
      y: { ticks: axisTicks(11), grid: { color: t.grid }, title: axisTitle("Humidity (%)", 12) },
    },
  },
});

// Panel D (small): weather condition split
new Chart(makeCell("D"), {
  type: "doughnut",
  data: {
    labels: conditionLabels,
    datasets: [{ data: conditionCounts, backgroundColor: t.palette.slice(0, 4), borderColor: t.pageBg, borderWidth: 2 }],
  },
  options: {
    responsive: true,
    maintainAspectRatio: false,
    animation: false,
    plugins: {
      title: panelTitle("Conditions", 14),
      legend: { position: "bottom", labels: { color: t.inkSoft, font: { size: 12 }, boxWidth: 10, boxHeight: 10 } },
    },
  },
});

// Panel E (small): wind direction frequency
new Chart(makeCell("E"), {
  type: "polarArea",
  data: {
    labels: directionLabels,
    datasets: [{ data: directionCounts, backgroundColor: t.palette.slice(0, 4).map((c) => `${c}CC`), borderColor: t.pageBg, borderWidth: 1.5 }],
  },
  options: {
    responsive: true,
    maintainAspectRatio: false,
    animation: false,
    plugins: {
      title: panelTitle("Wind Direction", 14),
      legend: { position: "bottom", labels: { color: t.inkSoft, font: { size: 12 }, boxWidth: 10, boxHeight: 10 } },
    },
    scales: { r: { ticks: { display: false }, grid: { color: t.grid }, angleLines: { color: t.grid } } },
  },
});

// Panel F (small): air-quality tiers (traffic-light semantic colors)
new Chart(makeCell("F"), {
  type: "bar",
  data: {
    labels: aqiLabels,
    datasets: [{ data: aqiCounts, backgroundColor: aqiColors, borderWidth: 0, categoryPercentage: 0.7 }],
  },
  options: {
    indexAxis: "y",
    responsive: true,
    maintainAspectRatio: false,
    animation: false,
    plugins: { title: panelTitle("Air Quality Days", 14), legend: { display: false } },
    scales: {
      x: { ticks: axisTicks(12), grid: { color: t.grid }, beginAtZero: true },
      y: { ticks: axisTicks(12), grid: { display: false } },
    },
  },
});
Runnable source as JSON, for any HTTP client: https://api.anyplot.ai/specs/subplot-mosaic/chartjs/code. Any spec id and library id listed in llms-full.txt fit the same URL shape; every URL below is complete and callable.
{
  "spec_id": "subplot-mosaic",
  "language": "javascript",
  "library": "chartjs",
  "page": "https://anyplot.ai/subplot-mosaic/javascript/chartjs",
  "hub": "https://anyplot.ai/subplot-mosaic",
  "code_json": "https://api.anyplot.ai/specs/subplot-mosaic/chartjs/code",
  "spec_json": "https://api.anyplot.ai/specs/subplot-mosaic",
  "render_light_png": "https://storage.googleapis.com/anyplot-images/plots/subplot-mosaic/javascript/chartjs/plot-light.png",
  "render_dark_png": "https://storage.googleapis.com/anyplot-images/plots/subplot-mosaic/javascript/chartjs/plot-dark.png",
  "interactive_light_html": "https://storage.googleapis.com/anyplot-images/plots/subplot-mosaic/javascript/chartjs/plot-light.html",
  "interactive_dark_html": "https://storage.googleapis.com/anyplot-images/plots/subplot-mosaic/javascript/chartjs/plot-dark.html",
  "quality_score": 91.0,
  "license": "MIT",
  "guide": "https://anyplot.ai/llms.txt"
}
Part of Mosaic Subplot Layout with Varying Sizes on anyplot.ai.