The same plot in 14 other libraries — JavaScript: Chart.js, D3.js, Apache ECharts, Highcharts; Python: Altair, Bokeh, lets-plot, Matplotlib, Plotly, plotnine, Pygal, Seaborn; R: ggplot2; Julia: Makie.jl. Compare all 15 side by side: Mosaic Subplot Layout with Varying Sizes in Python, R, Julia and JavaScript.
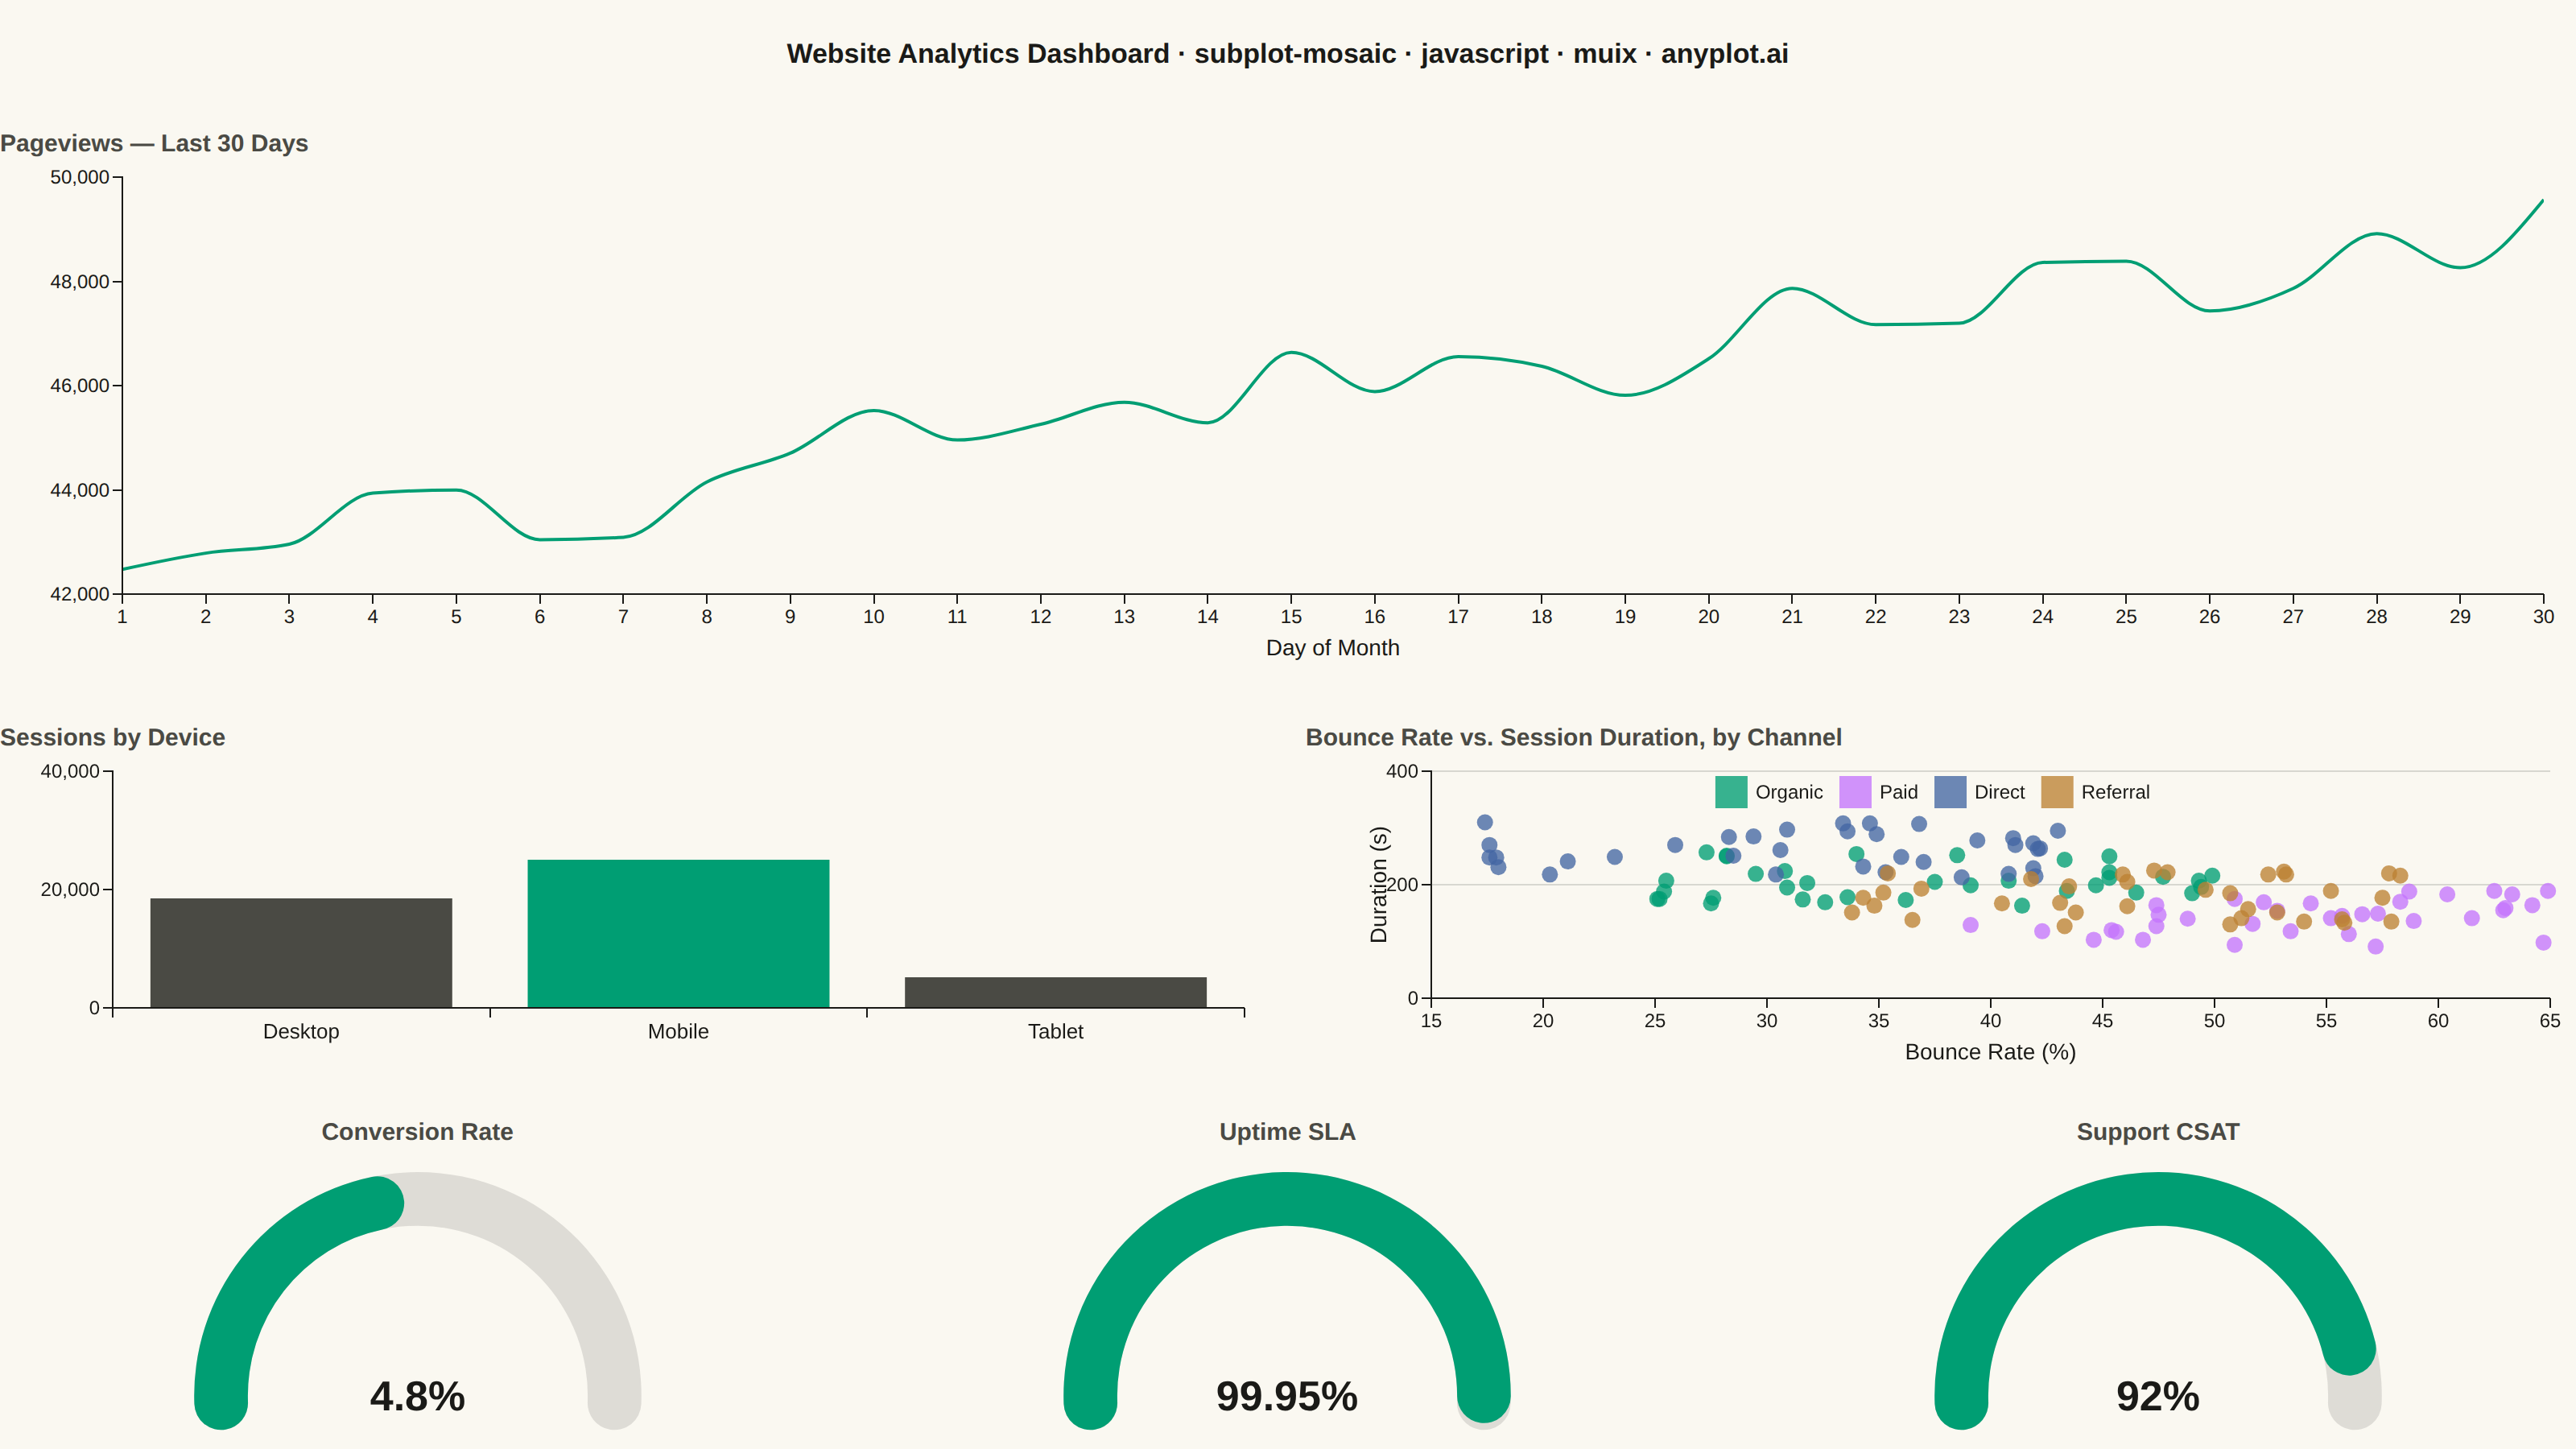
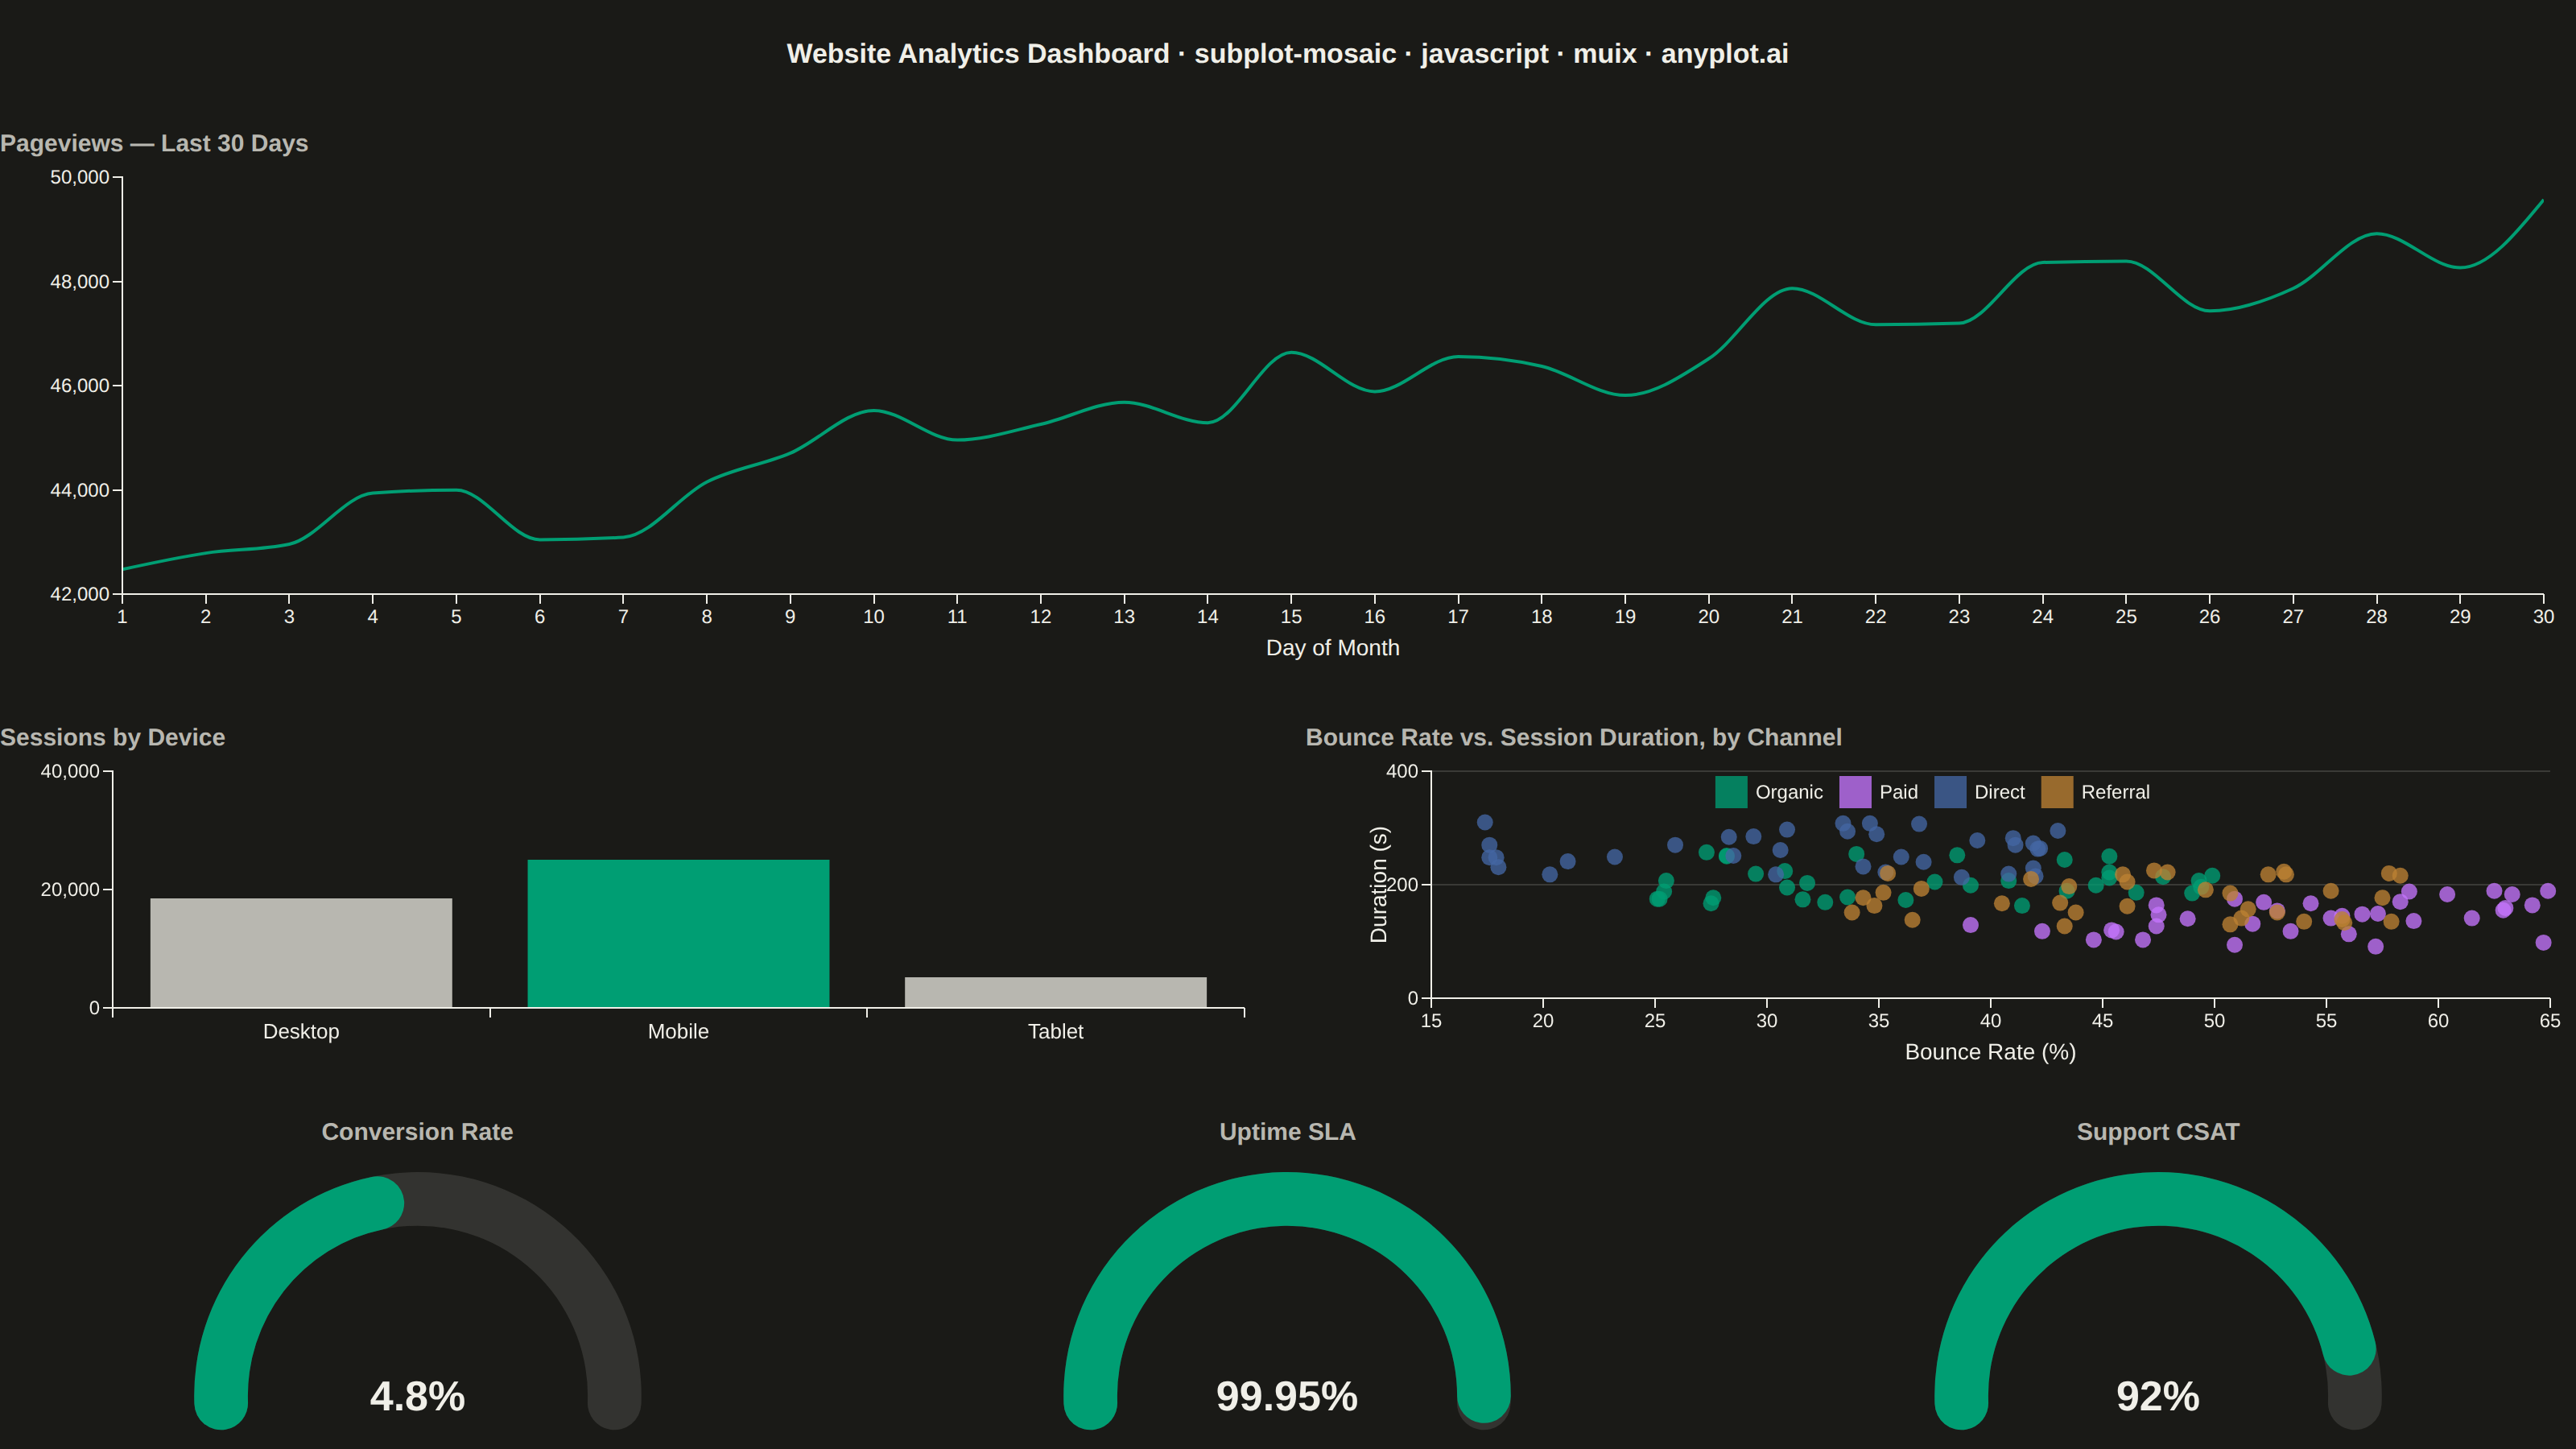
A complex subplot layout where different subplots can have varying sizes and arrangements using intuitive ASCII-art style string definitions. Unlike GridSpec approaches that require explicit row/column spanning, mosaic layouts allow defining layouts through visual string patterns (e.g., "AB;CC" creates A and B on top, C spanning below), making complex configurations more readable and maintainable.
// anyplot.ai
// subplot-mosaic: Mosaic Subplot Layout with Varying Sizes
// Library: muix 7.29.1 | JavaScript 22.23.2
// Quality: 93/100 | Created: 2026-09-09
import { LineChart } from "@mui/x-charts/LineChart";
import { BarChart } from "@mui/x-charts/BarChart";
import { ScatterChart } from "@mui/x-charts/ScatterChart";
import { Gauge, gaugeClasses } from "@mui/x-charts/Gauge";

const t = window.ANYPLOT_TOKENS;
const { width, height } = window.ANYPLOT_SIZE;

// --- Data (in-memory, deterministic) ----------------------------------------
let seed = 42;
const nextRandom = () => {
  seed = (Math.imul(seed, 1103515245) + 12345) & 0x7fffffff;
  return seed / 0x7fffffff;
};

// Panel A — 30-day pageview trend for the whole site (the dominant panel)
const days = Array.from({ length: 30 }, (_, i) => i + 1);
let pageviewLevel = 42000;
const pageviews = days.map(() => {
  pageviewLevel += (nextRandom() - 0.4) * 2600;
  return Math.round(Math.max(30000, pageviewLevel));
});

// Panel B — sessions by device category (Mobile leads — called out below)
const devices = ["Desktop", "Mobile", "Tablet"];
const sessionsByDevice = [18400, 24900, 5100];
const leadDeviceIndex = sessionsByDevice.indexOf(Math.max(...sessionsByDevice));

// Panel C — bounce rate vs. avg. session duration, by acquisition channel
const channels = [
  { label: "Organic", bounceBase: 38, durationBase: 210 },
  { label: "Paid", bounceBase: 52, durationBase: 140 },
  { label: "Direct", bounceBase: 30, durationBase: 260 },
  { label: "Referral", bounceBase: 46, durationBase: 175 },
];
const channelSeries = channels.map((c) => ({
  label: c.label,
  data: Array.from({ length: 35 }, (_, i) => ({
    id: i,
    x: Number(Math.max(5, Math.min(95, c.bounceBase + (nextRandom() - 0.5) * 26)).toFixed(1)),
    y: Math.round(Math.max(20, c.durationBase + (nextRandom() - 0.5) * 100)),
  })),
}));

// Panels D/E/F — small KPI gauges
const kpis = [
  { label: "Conversion Rate", value: 4.8, min: 0, max: 10, unit: "%" },
  { label: "Uptime SLA", value: 99.95, min: 95, max: 100, unit: "%" },
  { label: "Support CSAT", value: 92, min: 0, max: 100, unit: "%" },
];

const withAlpha = (hex, alpha) => {
  const n = parseInt(hex.slice(1), 16);
  return `rgba(${(n >> 16) & 255}, ${(n >> 8) & 255}, ${n & 255}, ${alpha})`;
};

// --- Mosaic layout — ASCII pattern → CSS Grid areas -------------------------
// Mirrors matplotlib's subplot_mosaic: repeated letters span cells ("." would
// mark a gap — CSS grid-template-areas treats "." as an empty cell natively).
// One wide overview on top, two medium detail panels in the middle, three
// small metric panels at the bottom.
const MOSAIC = ["AAAAAA", "BBBCCC", "DDEEFF"];
const ROW_FRACTION = [0.44, 0.29, 0.27]; // the wide overview gets the most height
const GAP = 22;
const CAPTION_H = 30;
const TITLE_H = 68;

const mosaicRect = (letter) => {
  let r0 = Infinity;
  let r1 = -1;
  let c0 = Infinity;
  let c1 = -1;
  MOSAIC.forEach((row, r) => {
    for (let c = 0; c < row.length; c += 1) {
      if (row[c] === letter) {
        r0 = Math.min(r0, r);
        r1 = Math.max(r1, r);
        c0 = Math.min(c0, c);
        c1 = Math.max(c1, c);
      }
    }
  });
  return { row: r0, rowSpan: r1 - r0 + 1, col: c0, colSpan: c1 - c0 + 1 };
};

const cols = MOSAIC[0].length;
const plotAreaH = height - TITLE_H;
const colWidth = (width - GAP * (cols - 1)) / cols;
const rowHeights = ROW_FRACTION.map((f) => Math.round((plotAreaH - GAP * (MOSAIC.length - 1)) * f));
const gridTemplateAreas = MOSAIC.map((row) => `"${row.split("").join(" ")}"`).join(" ");

const cellSize = (letter) => {
  const { row, rowSpan, colSpan } = mosaicRect(letter);
  const cellWidth = Math.round(colWidth * colSpan + GAP * (colSpan - 1));
  const cellHeight =
    rowHeights.slice(row, row + rowSpan).reduce((sum, h) => sum + h, 0) + GAP * (rowSpan - 1);
  return { width: cellWidth, height: cellHeight - CAPTION_H };
};

const sizeA = cellSize("A");
const sizeB = cellSize("B");
const sizeC = cellSize("C");
const sizeD = cellSize("D");
const sizeE = cellSize("E");
const sizeF = cellSize("F");

const captionStyle = {
  height: CAPTION_H,
  fontSize: 15,
  fontWeight: 600,
  color: t.inkSoft,
  fontFamily: "Roboto, Helvetica, Arial, sans-serif",
  display: "flex",
  alignItems: "flex-end",
};

// --- Title (fontsize scales with title length, see plot-generator.md) -------
const TITLE = "Website Analytics Dashboard · subplot-mosaic · javascript · muix · anyplot.ai";
const TITLE_FONTSIZE = Math.round(20 * (TITLE.length > 67 ? 67 / TITLE.length : 1));

const gaugeSx = {
  [`& .${gaugeClasses.valueArc}`]: { fill: t.palette[0] },
  [`& .${gaugeClasses.referenceArc}`]: { fill: withAlpha(t.ink, 0.12) },
  [`& .${gaugeClasses.valueText} text`]: { fill: t.ink, fontSize: 26, fontWeight: 600 },
};

const kpiPanel = (kpi, size) => (
  <div style={{ display: "flex", flexDirection: "column", alignItems: "center" }}>
    <div style={{ ...captionStyle, alignItems: "center" }}>{kpi.label}</div>
    <Gauge
      width={size.width}
      height={size.height}
      value={kpi.value}
      valueMin={kpi.min}
      valueMax={kpi.max}
      startAngle={-100}
      endAngle={100}
      innerRadius="76%"
      outerRadius="100%"
      cornerRadius="50%"
      text={({ value }) => `${value}${kpi.unit}`}
      skipAnimation
      sx={gaugeSx}
    />
  </div>
);

// --- Chart (default-exported component — the harness mounts it) -------------
export default function Chart() {
  return (
    <div style={{ width, height, display: "flex", flexDirection: "column" }}>
      <div
        style={{
          height: TITLE_H,
          display: "flex",
          alignItems: "center",
          justifyContent: "center",
          fontSize: TITLE_FONTSIZE,
          fontWeight: 600,
          color: t.ink,
          fontFamily: "Roboto, Helvetica, Arial, sans-serif",
        }}
      >
        {TITLE}
      </div>
      <div
        style={{
          width,
          height: plotAreaH,
          display: "grid",
          gridTemplateAreas,
          gridTemplateColumns: `repeat(${cols}, ${colWidth}px)`,
          gridTemplateRows: rowHeights.map((h) => `${h}px`).join(" "),
          gap: GAP,
        }}
      >
        <div style={{ gridArea: "A", display: "flex", flexDirection: "column" }}>
          <div style={captionStyle}>Pageviews — Last 30 Days</div>
          <LineChart
            width={sizeA.width}
            height={sizeA.height}
            skipAnimation
            legend={{ hidden: true }}
            margin={{ left: 76, right: 20, top: 12, bottom: 46 }}
            xAxis={[
              {
                data: days,
                label: "Day of Month",
                tickLabelStyle: { fontSize: 12 },
              },
            ]}
            yAxis={[{ tickLabelStyle: { fontSize: 12 } }]}
            series={[{ data: pageviews, color: t.palette[0], showMark: false, curve: "monotoneX" }]}
          />
        </div>
        <div style={{ gridArea: "B", display: "flex", flexDirection: "column" }}>
          <div style={captionStyle}>Sessions by Device</div>
          <BarChart
            width={sizeB.width}
            height={sizeB.height}
            skipAnimation
            legend={{ hidden: true }}
            margin={{ left: 70, right: 16, top: 12, bottom: 40 }}
            xAxis={[
              {
                scaleType: "band",
                data: devices,
                tickLabelStyle: { fontSize: 13 },
                // Focal-point emphasis: the leading device (Mobile) stays brand
                // green, the others mute to inkSoft — calls out the takeaway
                // without adding annotation infrastructure.
                colorMap: {
                  type: "ordinal",
                  values: devices,
                  colors: devices.map((_, i) => (i === leadDeviceIndex ? t.palette[0] : t.inkSoft)),
                },
              },
            ]}
            yAxis={[{ tickLabelStyle: { fontSize: 12 } }]}
            series={[{ data: sessionsByDevice, color: t.palette[0] }]}
          />
        </div>
        <div style={{ gridArea: "C", display: "flex", flexDirection: "column" }}>
          <div style={captionStyle}>Bounce Rate vs. Session Duration, by Channel</div>
          <ScatterChart
            width={sizeC.width}
            height={sizeC.height}
            skipAnimation
            margin={{ left: 78, right: 16, top: 12, bottom: 46 }}
            grid={{ horizontal: true }}
            xAxis={[{ label: "Bounce Rate (%)", tickLabelStyle: { fontSize: 12 } }]}
            yAxis={[{ label: "Duration (s)", tickLabelStyle: { fontSize: 12 } }]}
            series={channelSeries.map((s) => ({ ...s, markerSize: 5 }))}
            colors={t.palette.slice(0, channelSeries.length).map((c) => withAlpha(c, 0.78))}
            slotProps={{ legend: { labelStyle: { fontSize: 12 } } }}
          />
        </div>
        <div style={{ gridArea: "D" }}>{kpiPanel(kpis[0], sizeD)}</div>
        <div style={{ gridArea: "E" }}>{kpiPanel(kpis[1], sizeE)}</div>
        <div style={{ gridArea: "F" }}>{kpiPanel(kpis[2], sizeF)}</div>
      </div>
    </div>
  );
}
Runnable source as JSON, for any HTTP client: https://api.anyplot.ai/specs/subplot-mosaic/muix/code. Any spec id and library id listed in llms-full.txt fit the same URL shape; every URL below is complete and callable.
{
  "spec_id": "subplot-mosaic",
  "language": "javascript",
  "library": "muix",
  "page": "https://anyplot.ai/subplot-mosaic/javascript/muix",
  "hub": "https://anyplot.ai/subplot-mosaic",
  "code_json": "https://api.anyplot.ai/specs/subplot-mosaic/muix/code",
  "spec_json": "https://api.anyplot.ai/specs/subplot-mosaic",
  "render_light_png": "https://storage.googleapis.com/anyplot-images/plots/subplot-mosaic/javascript/muix/plot-light.png",
  "render_dark_png": "https://storage.googleapis.com/anyplot-images/plots/subplot-mosaic/javascript/muix/plot-dark.png",
  "interactive_light_html": "https://storage.googleapis.com/anyplot-images/plots/subplot-mosaic/javascript/muix/plot-light.html",
  "interactive_dark_html": "https://storage.googleapis.com/anyplot-images/plots/subplot-mosaic/javascript/muix/plot-dark.html",
  "quality_score": 93.0,
  "license": "MIT",
  "guide": "https://anyplot.ai/llms.txt"
}
Part of Mosaic Subplot Layout with Varying Sizes on anyplot.ai.