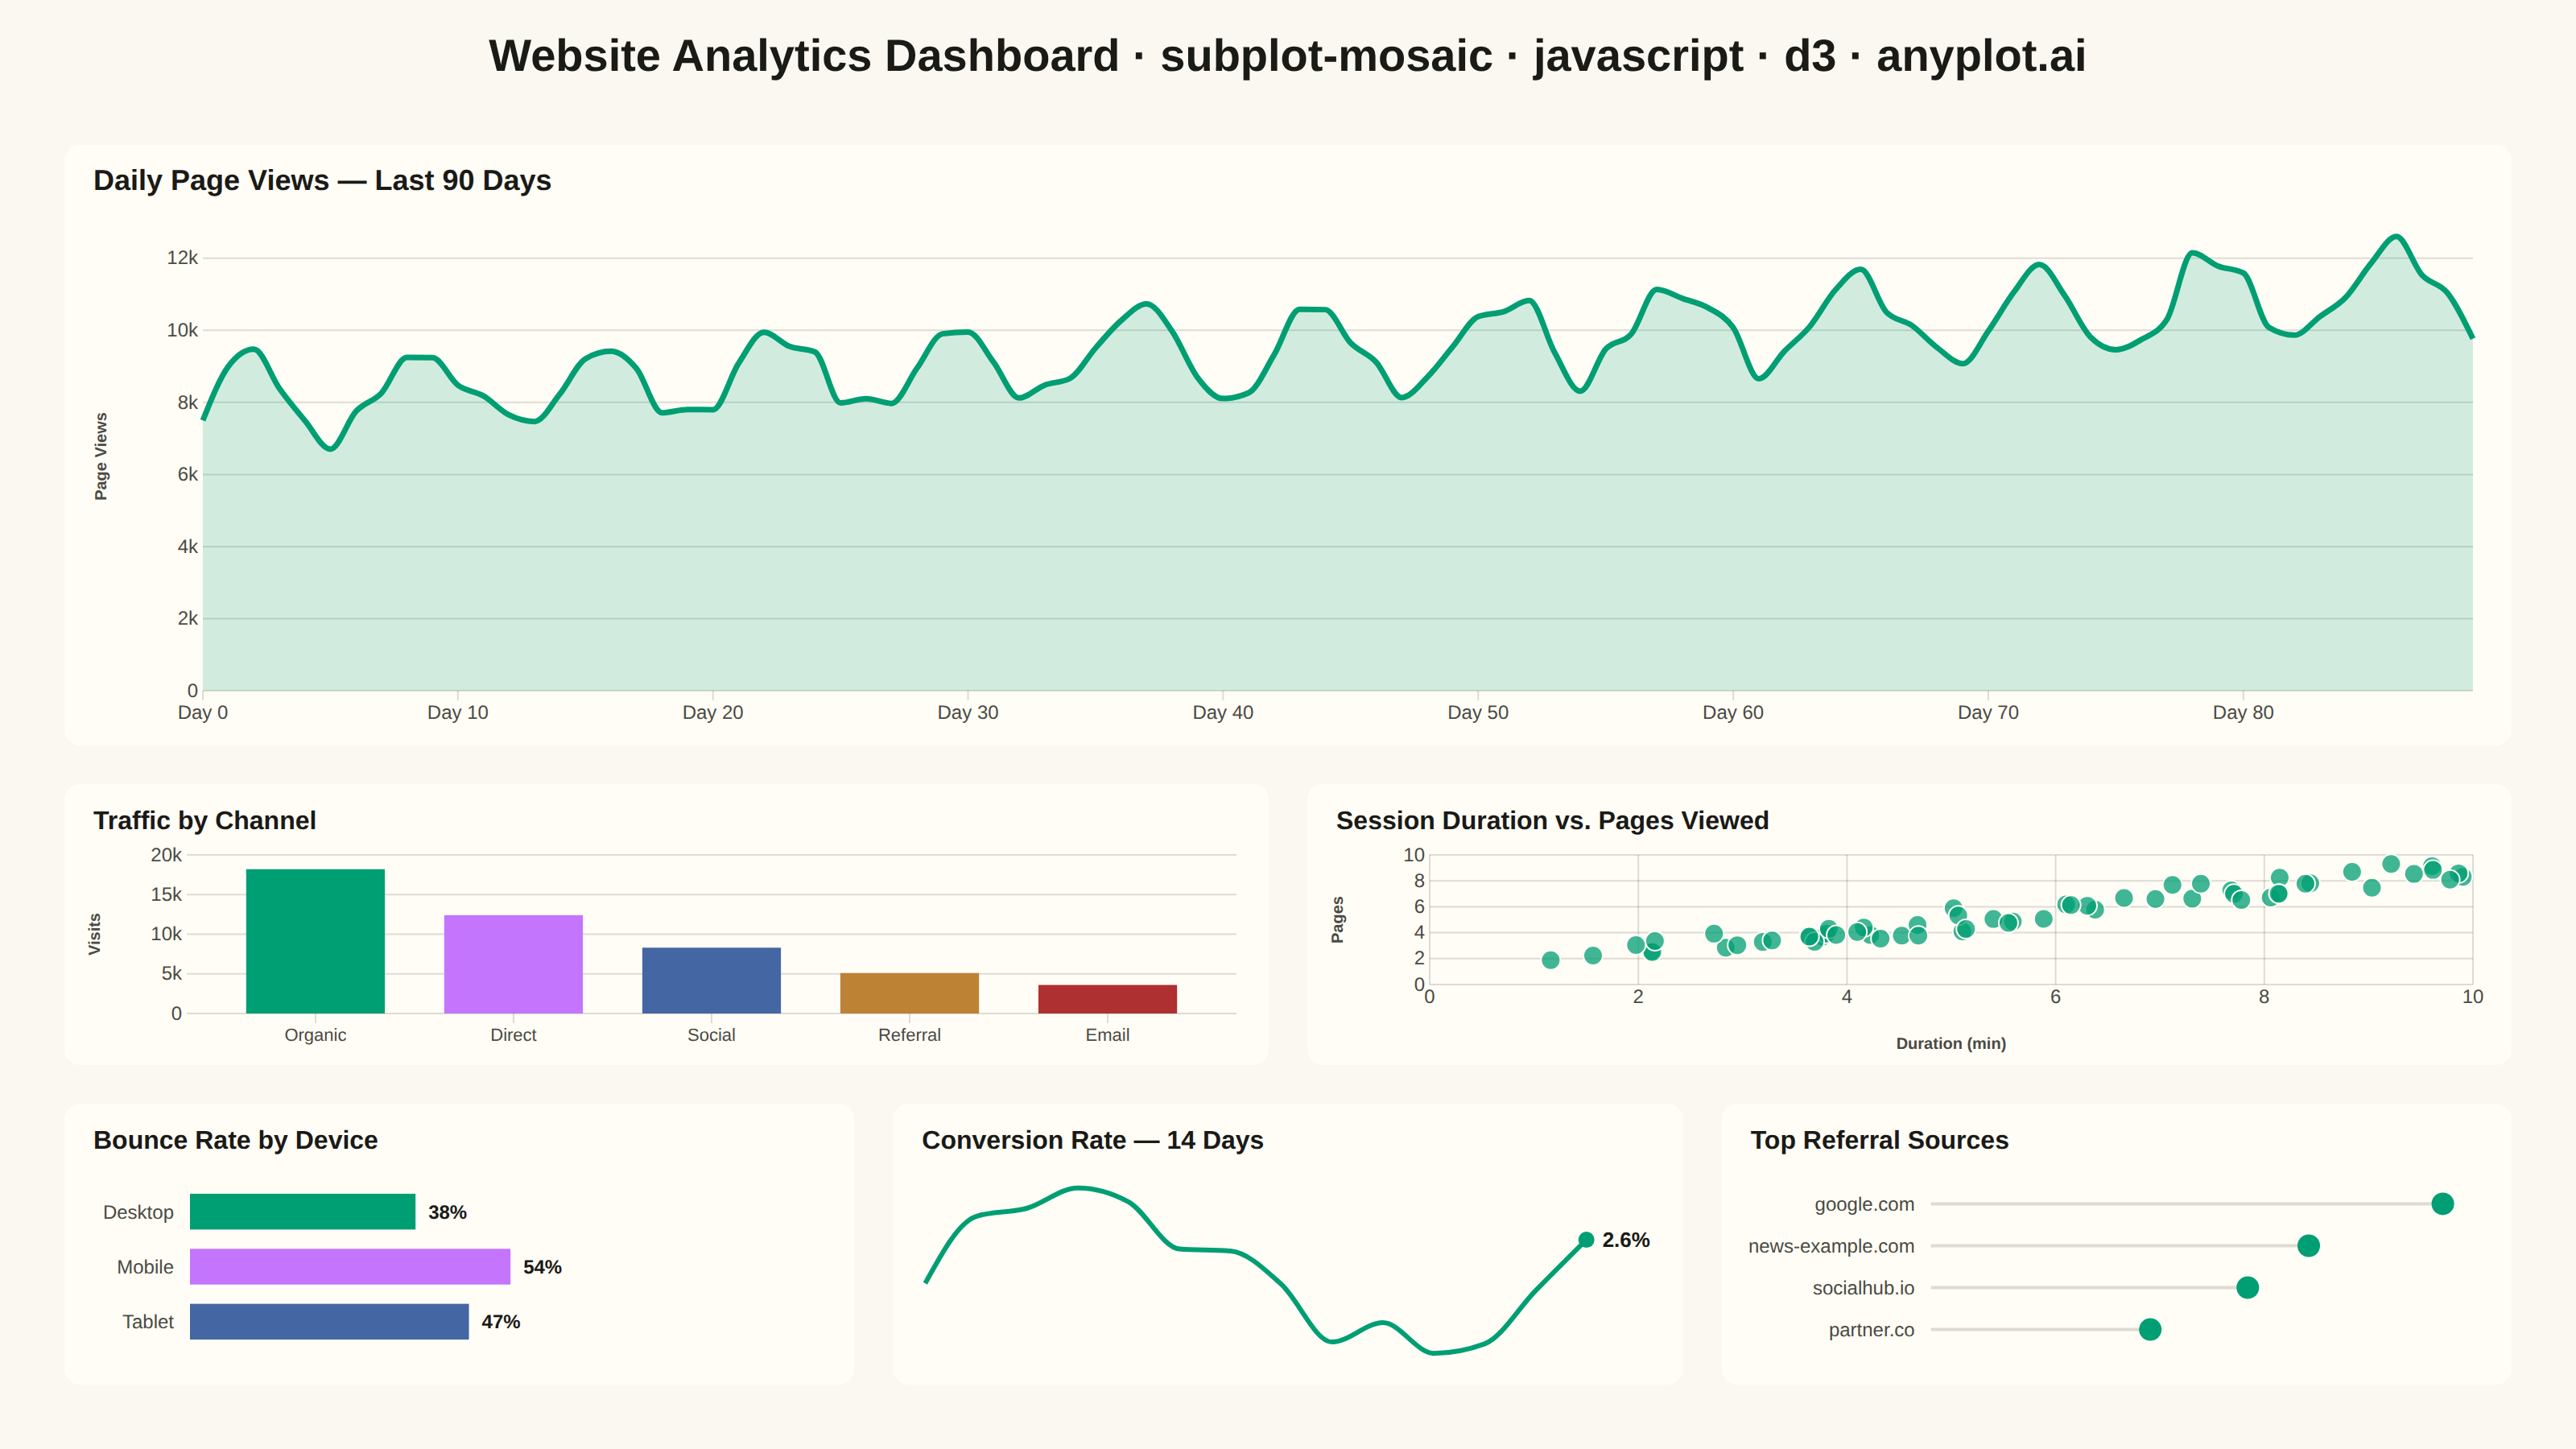
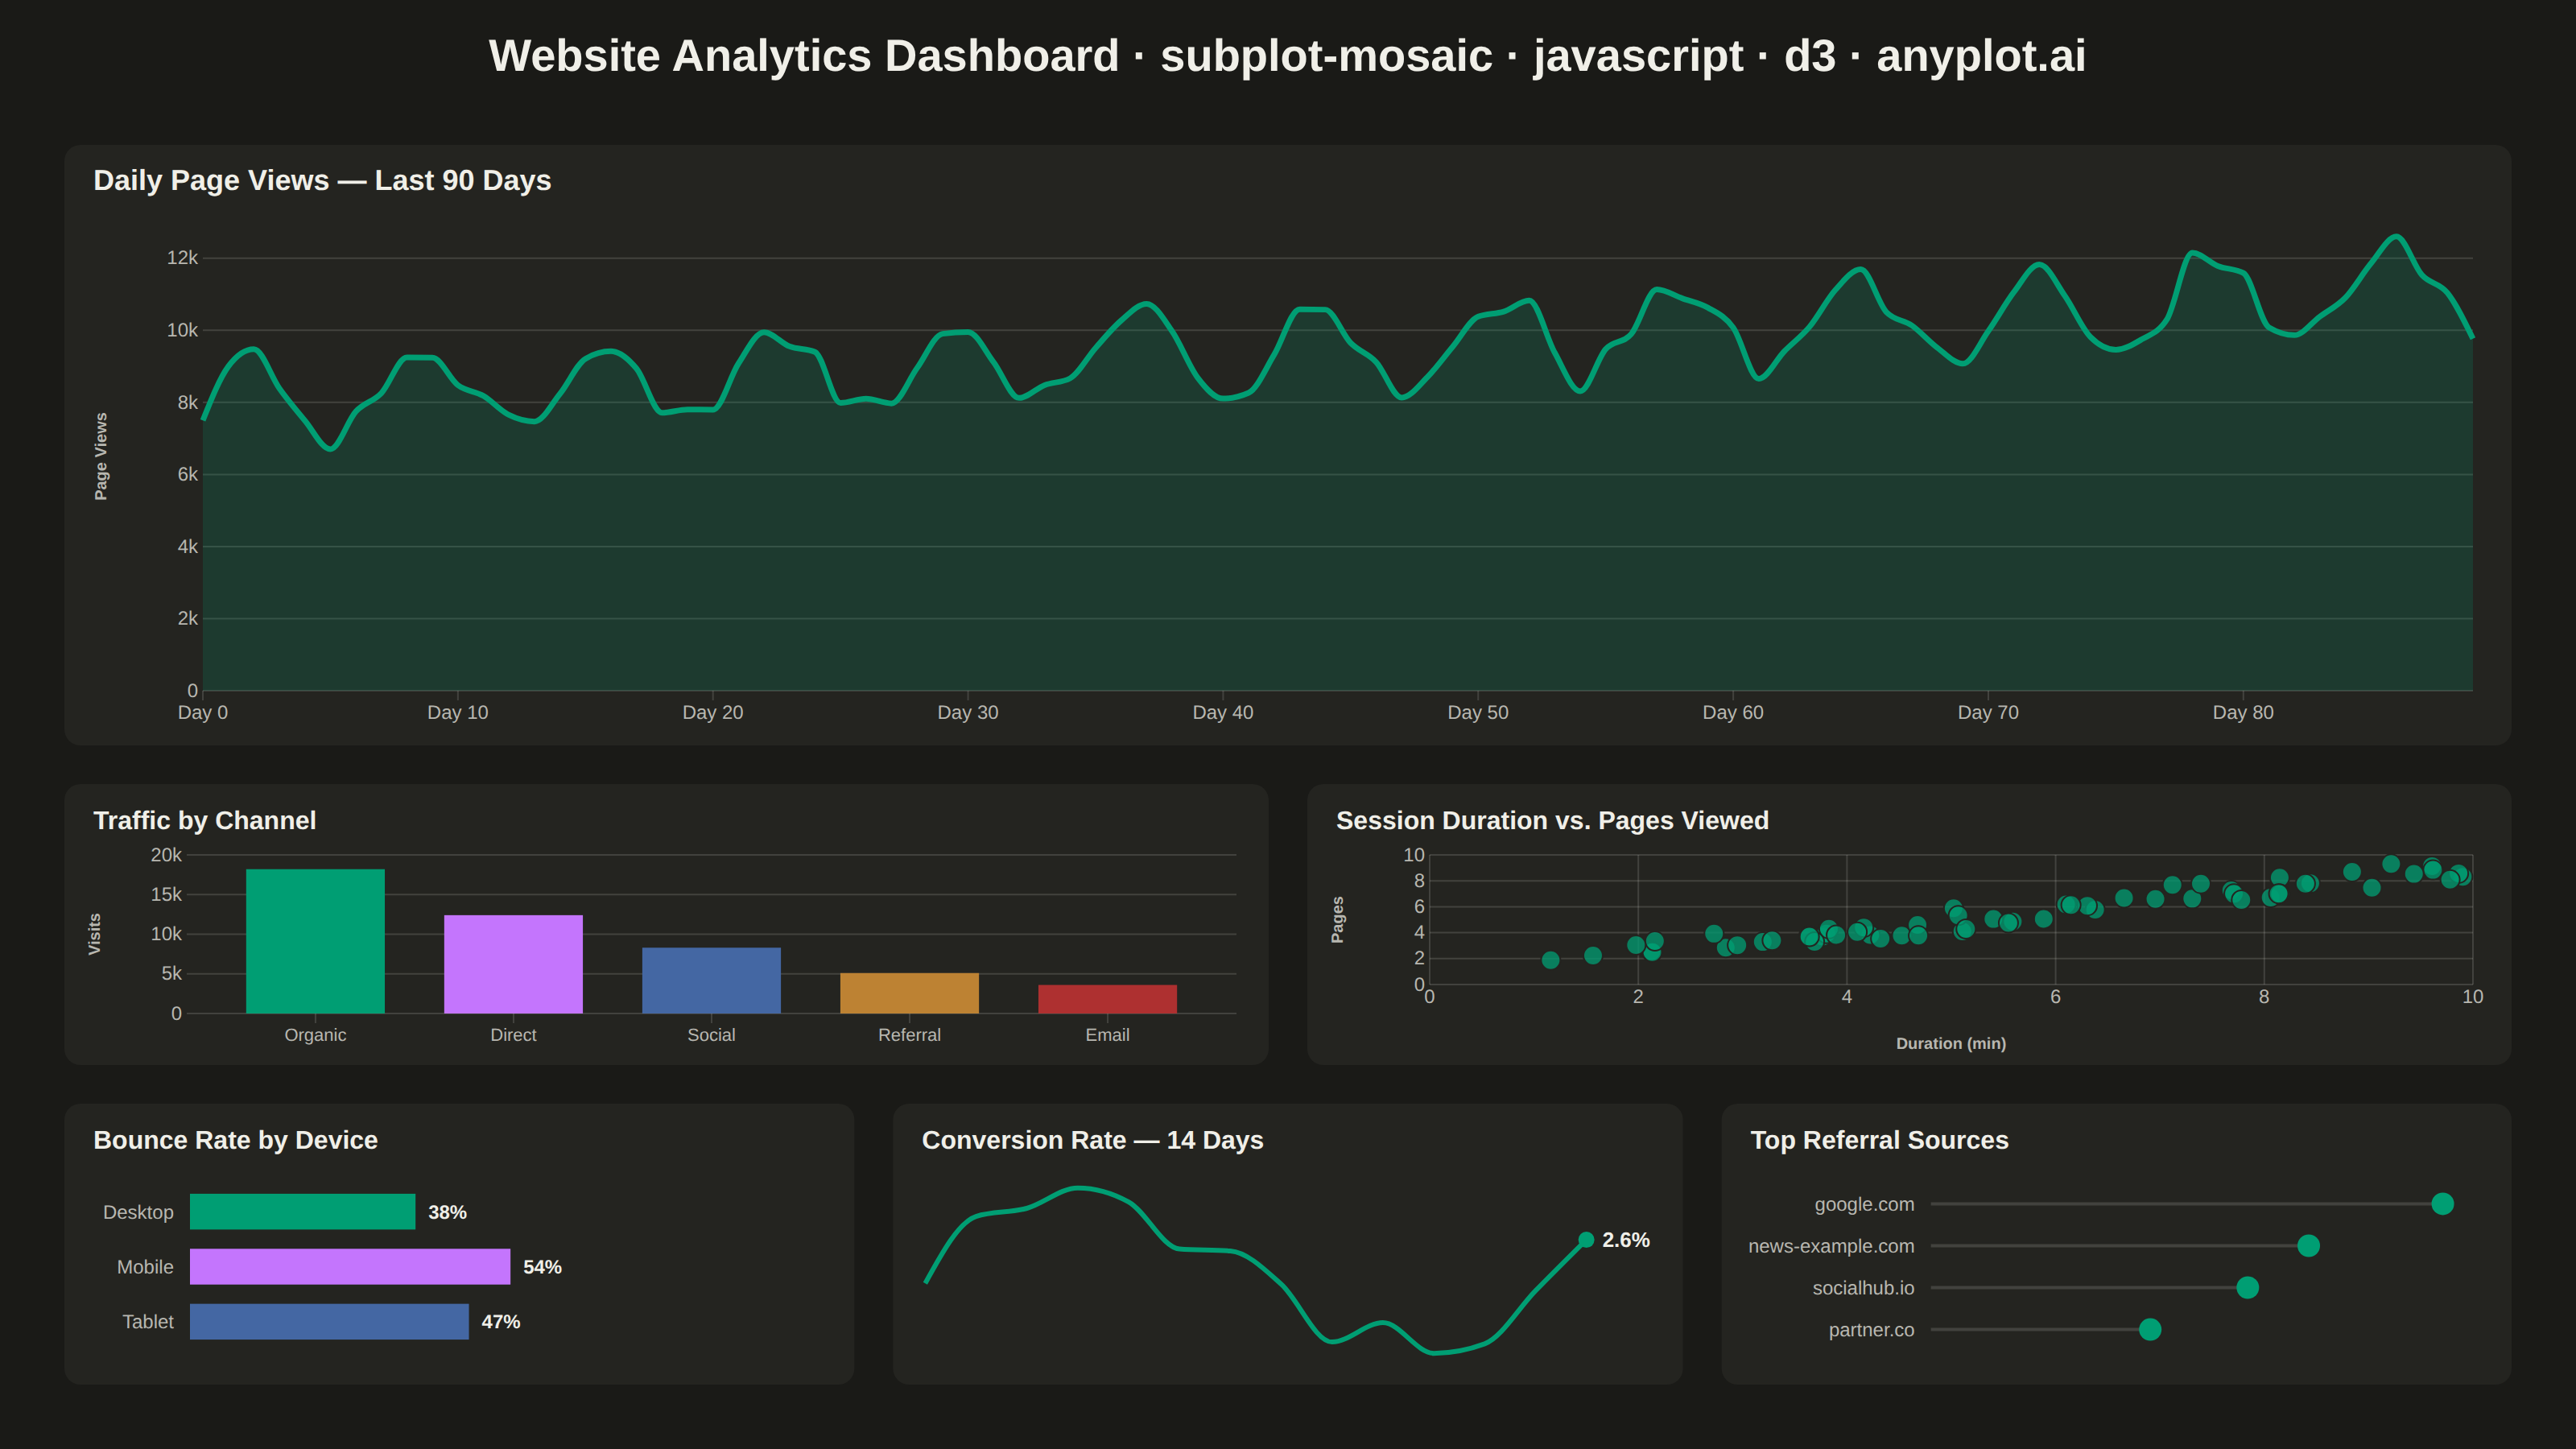
The same plot in 14 other libraries — JavaScript: Chart.js, Apache ECharts, Highcharts, MUI X Charts; Python: Altair, Bokeh, lets-plot, Matplotlib, Plotly, plotnine, Pygal, Seaborn; R: ggplot2; Julia: Makie.jl. Compare all 15 side by side: Mosaic Subplot Layout with Varying Sizes in Python, R, Julia and JavaScript.
A complex subplot layout where different subplots can have varying sizes and arrangements using intuitive ASCII-art style string definitions. Unlike GridSpec approaches that require explicit row/column spanning, mosaic layouts allow defining layouts through visual string patterns (e.g., "AB;CC" creates A and B on top, C spanning below), making complex configurations more readable and maintainable.
// anyplot.ai
// subplot-mosaic: Mosaic Subplot Layout with Varying Sizes
// Library: d3 7.9.0 | JavaScript 22.23.2
// Quality: 92/100 | Created: 2026-09-09

const t = window.ANYPLOT_TOKENS;
const { width, height } = window.ANYPLOT_SIZE;

// --- Deterministic PRNG (browser has no seeded Math.random) -----------------
function lcg(seed) {
  let s = seed % 2147483647;
  if (s <= 0) s += 2147483646;
  return () => (s = (s * 16807) % 2147483647) / 2147483647;
}
const rand = lcg(42);

// --- Mosaic layout: ASCII pattern -> per-letter bounding box -----------------
// "AAAAAA" x2 rows = wide overview on top; "BBBCCC" = two medium detail
// charts; "DDEEFF" = three small metric panels. Repeated letters span cells.
const pattern = ["AAAAAA", "AAAAAA", "BBBCCC", "DDEEFF"];
const nRows = pattern.length;
const nCols = pattern[0].length;

const cells = {};
pattern.forEach((rowStr, r) => {
  [...rowStr].forEach((key, c) => {
    if (key === ".") return;
    if (!cells[key]) cells[key] = { r0: r, r1: r, c0: c, c1: c };
    const cell = cells[key];
    cell.r0 = Math.min(cell.r0, r);
    cell.r1 = Math.max(cell.r1, r);
    cell.c0 = Math.min(cell.c0, c);
    cell.c1 = Math.max(cell.c1, c);
  });
});

const margin = { top: 90, right: 40, bottom: 40, left: 40 };
const gutter = 24;
const gridW = width - margin.left - margin.right;
const gridH = height - margin.top - margin.bottom;
const colW = (gridW - gutter * (nCols - 1)) / nCols;
const rowH = (gridH - gutter * (nRows - 1)) / nRows;

function cellRect(key) {
  const c = cells[key];
  return {
    x: margin.left + c.c0 * (colW + gutter),
    y: margin.top + c.r0 * (rowH + gutter),
    w: (c.c1 - c.c0 + 1) * colW + (c.c1 - c.c0) * gutter,
    h: (c.r1 - c.r0 + 1) * rowH + (c.r1 - c.r0) * gutter,
  };
}

// --- Data (in-memory, deterministic) ----------------------------------------
// A: daily page views over a quarter — wide overview
const pageViews = d3.range(90).map((day) => {
  const trendline = 8000 + day * 35;
  const weeklyCycle = 1200 * Math.sin((day / 7) * 2 * Math.PI);
  const noise = (rand() - 0.5) * 1000;
  return { day, views: Math.max(0, trendline + weeklyCycle + noise) };
});

// B: traffic by acquisition channel — medium detail
const channels = [
  { channel: "Organic", visits: 18200 },
  { channel: "Direct", visits: 12400 },
  { channel: "Social", visits: 8300 },
  { channel: "Referral", visits: 5100 },
  { channel: "Email", visits: 3600 },
];

// C: session duration vs. pages viewed — medium detail
const sessions = d3.range(60).map(() => {
  const duration = 1 + rand() * 9;
  const pages = Math.max(1, 1 + duration * 0.8 + (rand() - 0.5) * 2);
  return { duration, pages };
});

// D: bounce rate by device — small metric panel
const devices = [
  { device: "Desktop", bounce: 38 },
  { device: "Mobile", bounce: 54 },
  { device: "Tablet", bounce: 47 },
];

// E: conversion rate, 14-day trend — small metric panel
const conversion = d3.range(14).map((i) => 2.4 + Math.sin(i / 2) * 0.4 + (rand() - 0.5) * 0.3);

// F: top referral sources — small metric panel
const referrers = [
  { source: "google.com", count: 420 },
  { source: "news-example.com", count: 310 },
  { source: "socialhub.io", count: 260 },
  { source: "partner.co", count: 180 },
];

// --- SVG mount ----------------------------------------------------------------
const svg = d3.select("#container").append("svg").attr("width", width).attr("height", height);

function stylePanelAxis(sel) {
  sel.selectAll(".tick text").attr("fill", t.inkSoft).style("font-size", "12px");
  sel.selectAll(".tick line").attr("stroke", t.grid);
  sel.select(".domain").remove();
}

// Small axis-unit label, rotated for the y axis, so panels where the panel
// title alone doesn't convey units (e.g. duration, visits) stay unambiguous.
function axisTitle(cg, text, axis, iw, ih, offset) {
  if (axis === "y") {
    cg.append("text")
      .attr("transform", "rotate(-90)")
      .attr("x", -(ih / 2))
      .attr("y", -offset)
      .attr("text-anchor", "middle")
      .attr("fill", t.inkSoft)
      .style("font-size", "10px")
      .style("font-weight", "600")
      .text(text);
  } else {
    cg.append("text")
      .attr("x", iw / 2)
      .attr("y", ih + offset)
      .attr("text-anchor", "middle")
      .attr("fill", t.inkSoft)
      .style("font-size", "10px")
      .style("font-weight", "600")
      .text(text);
  }
}

function panel(key, title, titleSize = "16px") {
  const { x, y, w, h } = cellRect(key);
  const g = svg.append("g").attr("transform", `translate(${x},${y})`);
  g.append("rect").attr("width", w).attr("height", h).attr("rx", 10).attr("fill", t.elevatedBg);
  g.append("text")
    .attr("x", 18)
    .attr("y", 28)
    .attr("fill", t.ink)
    .style("font-size", titleSize)
    .style("font-weight", "600")
    .text(title);
  return { g, w, h };
}

// --- Panel A: wide overview area+line chart ----------------------------------
{
  const { g, w, h } = panel("A", "Daily Page Views — Last 90 Days", "18px");
  const m = { top: 48, right: 24, bottom: 34, left: 86 };
  const iw = w - m.left - m.right;
  const ih = h - m.top - m.bottom;
  const cg = g.append("g").attr("transform", `translate(${m.left},${m.top})`);

  const x = d3.scaleLinear().domain([0, 89]).range([0, iw]);
  const y = d3
    .scaleLinear()
    .domain([0, d3.max(pageViews, (d) => d.views)])
    .nice()
    .range([ih, 0]);

  cg.append("g")
    .call(d3.axisLeft(y).ticks(5).tickSize(-iw).tickFormat(d3.format("~s")))
    .call((sel) => sel.selectAll("line").attr("stroke", t.grid))
    .call(stylePanelAxis);
  axisTitle(cg, "Page Views", "y", iw, ih, 60);

  const area = d3
    .area()
    .x((d) => x(d.day))
    .y0(ih)
    .y1((d) => y(d.views))
    .curve(d3.curveMonotoneX);
  const line = d3
    .line()
    .x((d) => x(d.day))
    .y((d) => y(d.views))
    .curve(d3.curveMonotoneX);

  cg.append("path").datum(pageViews).attr("d", area).attr("fill", t.palette[0]).attr("opacity", 0.18);
  cg.append("path")
    .datum(pageViews)
    .attr("d", line)
    .attr("fill", "none")
    .attr("stroke", t.palette[0])
    .attr("stroke-width", 3.5);

  const xAxis = cg
    .append("g")
    .attr("transform", `translate(0,${ih})`)
    .call(
      d3
        .axisBottom(x)
        .ticks(9)
        .tickFormat((d) => `Day ${d}`)
    );
  stylePanelAxis(xAxis);
}

// --- Panel B: traffic by channel (vertical bar) ------------------------------
{
  const { g, w, h } = panel("B", "Traffic by Channel");
  const m = { top: 44, right: 20, bottom: 32, left: 76 };
  const iw = w - m.left - m.right;
  const ih = h - m.top - m.bottom;
  const cg = g.append("g").attr("transform", `translate(${m.left},${m.top})`);

  const x = d3
    .scaleBand()
    .domain(channels.map((d) => d.channel))
    .range([0, iw])
    .padding(0.3);
  const y = d3
    .scaleLinear()
    .domain([0, d3.max(channels, (d) => d.visits)])
    .nice()
    .range([ih, 0]);
  const color = d3.scaleOrdinal().domain(channels.map((d) => d.channel)).range(t.palette);

  cg.append("g")
    .call(d3.axisLeft(y).ticks(4).tickSize(-iw).tickFormat(d3.format("~s")))
    .call((sel) => sel.selectAll("line").attr("stroke", t.grid))
    .call(stylePanelAxis);
  axisTitle(cg, "Visits", "y", iw, ih, 54);

  cg.selectAll("rect.bar")
    .data(channels)
    .join("rect")
    .attr("class", "bar")
    .attr("x", (d) => x(d.channel))
    .attr("y", (d) => y(d.visits))
    .attr("width", x.bandwidth())
    .attr("height", (d) => ih - y(d.visits))
    .attr("fill", (d) => color(d.channel));

  const xAxis = cg.append("g").attr("transform", `translate(0,${ih})`).call(d3.axisBottom(x));
  stylePanelAxis(xAxis);
  xAxis.selectAll("text").style("font-size", "11px");
}

// --- Panel C: session duration vs. pages viewed (scatter) --------------------
{
  const { g, w, h } = panel("C", "Session Duration vs. Pages Viewed");
  const m = { top: 44, right: 24, bottom: 50, left: 76 };
  const iw = w - m.left - m.right;
  const ih = h - m.top - m.bottom;
  const cg = g.append("g").attr("transform", `translate(${m.left},${m.top})`);

  const x = d3
    .scaleLinear()
    .domain([0, d3.max(sessions, (d) => d.duration)])
    .nice()
    .range([0, iw]);
  const y = d3
    .scaleLinear()
    .domain([0, d3.max(sessions, (d) => d.pages)])
    .nice()
    .range([ih, 0]);

  cg.append("g")
    .call(d3.axisLeft(y).ticks(4).tickSize(-iw))
    .call((sel) => sel.selectAll("line").attr("stroke", t.grid))
    .call(stylePanelAxis);
  cg.append("g")
    .call(d3.axisBottom(x).ticks(4).tickSize(-ih))
    .attr("transform", `translate(0,${ih})`)
    .call((sel) => sel.selectAll("line").attr("stroke", t.grid))
    .call(stylePanelAxis);
  axisTitle(cg, "Pages", "y", iw, ih, 54);
  axisTitle(cg, "Duration (min)", "x", iw, ih, 40);

  cg.selectAll("circle")
    .data(sessions)
    .join("circle")
    .attr("cx", (d) => x(d.duration))
    .attr("cy", (d) => y(d.pages))
    .attr("r", 6)
    .attr("fill", t.palette[0])
    .attr("fill-opacity", 0.75)
    .attr("stroke", t.elevatedBg)
    .attr("stroke-width", 1);
}

// --- Panel D: bounce rate by device (small horizontal bar) -------------------
{
  const { g, w, h } = panel("D", "Bounce Rate by Device");
  const m = { top: 44, right: 44, bottom: 16, left: 78 };
  const iw = w - m.left - m.right;
  const ih = h - m.top - m.bottom;
  const cg = g.append("g").attr("transform", `translate(${m.left},${m.top})`);

  const y = d3
    .scaleBand()
    .domain(devices.map((d) => d.device))
    .range([0, ih])
    .padding(0.35);
  const x = d3.scaleLinear().domain([0, 100]).range([0, iw]);
  const color = d3.scaleOrdinal().domain(devices.map((d) => d.device)).range(t.palette);

  cg.selectAll("rect.bar")
    .data(devices)
    .join("rect")
    .attr("class", "bar")
    .attr("x", 0)
    .attr("y", (d) => y(d.device))
    .attr("width", (d) => x(d.bounce))
    .attr("height", y.bandwidth())
    .attr("fill", (d) => color(d.device));

  cg.selectAll("text.label")
    .data(devices)
    .join("text")
    .attr("class", "label")
    .attr("x", -10)
    .attr("y", (d) => y(d.device) + y.bandwidth() / 2)
    .attr("dy", "0.35em")
    .attr("text-anchor", "end")
    .attr("fill", t.inkSoft)
    .style("font-size", "12px")
    .text((d) => d.device);

  cg.selectAll("text.value")
    .data(devices)
    .join("text")
    .attr("class", "value")
    .attr("x", (d) => x(d.bounce) + 8)
    .attr("y", (d) => y(d.device) + y.bandwidth() / 2)
    .attr("dy", "0.35em")
    .attr("fill", t.ink)
    .style("font-size", "12px")
    .style("font-weight", "600")
    .text((d) => `${d.bounce}%`);
}

// --- Panel E: conversion rate 14-day sparkline --------------------------------
{
  const { g, w, h } = panel("E", "Conversion Rate — 14 Days");
  const m = { top: 46, right: 60, bottom: 16, left: 20 };
  const iw = w - m.left - m.right;
  const ih = h - m.top - m.bottom;
  const cg = g.append("g").attr("transform", `translate(${m.left},${m.top})`);

  const x = d3.scaleLinear().domain([0, conversion.length - 1]).range([0, iw]);
  const y = d3
    .scaleLinear()
    .domain(d3.extent(conversion))
    .nice()
    .range([ih, 0]);

  const line = d3
    .line()
    .x((_, i) => x(i))
    .y((d) => y(d))
    .curve(d3.curveMonotoneX);

  cg.append("path")
    .datum(conversion)
    .attr("d", line)
    .attr("fill", "none")
    .attr("stroke", t.palette[0])
    .attr("stroke-width", 3);

  const last = conversion[conversion.length - 1];
  cg.append("circle").attr("cx", x(conversion.length - 1)).attr("cy", y(last)).attr("r", 5).attr("fill", t.palette[0]);
  cg.append("text")
    .attr("x", x(conversion.length - 1) + 10)
    .attr("y", y(last))
    .attr("dy", "0.35em")
    .attr("fill", t.ink)
    .style("font-size", "13px")
    .style("font-weight", "600")
    .text(`${last.toFixed(1)}%`);
}

// --- Panel F: top referral sources (dot plot) ---------------------------------
{
  const { g, w, h } = panel("F", "Top Referral Sources");
  const m = { top: 44, right: 20, bottom: 16, left: 130 };
  const iw = w - m.left - m.right;
  const ih = h - m.top - m.bottom;
  const cg = g.append("g").attr("transform", `translate(${m.left},${m.top})`);

  const y = d3
    .scaleBand()
    .domain(referrers.map((d) => d.source))
    .range([0, ih])
    .padding(0.4);
  const x = d3
    .scaleLinear()
    .domain([0, d3.max(referrers, (d) => d.count)])
    .nice()
    .range([0, iw]);

  cg.selectAll("line.stem")
    .data(referrers)
    .join("line")
    .attr("class", "stem")
    .attr("x1", 0)
    .attr("x2", (d) => x(d.count))
    .attr("y1", (d) => y(d.source) + y.bandwidth() / 2)
    .attr("y2", (d) => y(d.source) + y.bandwidth() / 2)
    .attr("stroke", t.grid)
    .attr("stroke-width", 2);

  cg.selectAll("circle.dot")
    .data(referrers)
    .join("circle")
    .attr("class", "dot")
    .attr("cx", (d) => x(d.count))
    .attr("cy", (d) => y(d.source) + y.bandwidth() / 2)
    .attr("r", 7)
    .attr("fill", t.palette[0]);

  cg.selectAll("text.label")
    .data(referrers)
    .join("text")
    .attr("class", "label")
    .attr("x", -10)
    .attr("y", (d) => y(d.source) + y.bandwidth() / 2)
    .attr("dy", "0.35em")
    .attr("text-anchor", "end")
    .attr("fill", t.inkSoft)
    .style("font-size", "12px")
    .text((d) => d.source);
}

// --- Title --------------------------------------------------------------------
// Measure the actual rendered width (real browser layout engine) instead of a
// char-count heuristic, so the title reliably fills ~60% of the canvas width
// without guessing at font metrics.
const title = "Website Analytics Dashboard · subplot-mosaic · javascript · d3 · anyplot.ai";
const baseFontSize = 28;
const titleEl = svg
  .append("text")
  .attr("x", width / 2)
  .attr("y", 44)
  .attr("text-anchor", "middle")
  .attr("fill", t.ink)
  .style("font-size", `${baseFontSize}px`)
  .style("font-weight", "600")
  .text(title);
const measuredWidth = titleEl.node().getBBox().width;
const targetWidth = width * 0.62;
const scale = Math.max(0.55, Math.min(1.25, targetWidth / measuredWidth));
titleEl.style("font-size", `${Math.round(baseFontSize * scale)}px`);
Runnable source as JSON, for any HTTP client: https://api.anyplot.ai/specs/subplot-mosaic/d3/code. Any spec id and library id listed in llms-full.txt fit the same URL shape; every URL below is complete and callable.
{
  "spec_id": "subplot-mosaic",
  "language": "javascript",
  "library": "d3",
  "page": "https://anyplot.ai/subplot-mosaic/javascript/d3",
  "hub": "https://anyplot.ai/subplot-mosaic",
  "code_json": "https://api.anyplot.ai/specs/subplot-mosaic/d3/code",
  "spec_json": "https://api.anyplot.ai/specs/subplot-mosaic",
  "render_light_png": "https://storage.googleapis.com/anyplot-images/plots/subplot-mosaic/javascript/d3/plot-light.png",
  "render_dark_png": "https://storage.googleapis.com/anyplot-images/plots/subplot-mosaic/javascript/d3/plot-dark.png",
  "interactive_light_html": "https://storage.googleapis.com/anyplot-images/plots/subplot-mosaic/javascript/d3/plot-light.html",
  "interactive_dark_html": "https://storage.googleapis.com/anyplot-images/plots/subplot-mosaic/javascript/d3/plot-dark.html",
  "quality_score": 92.0,
  "license": "MIT",
  "guide": "https://anyplot.ai/llms.txt"
}
Part of Mosaic Subplot Layout with Varying Sizes on anyplot.ai.