The same plot in 14 other libraries — JavaScript: Chart.js, D3.js, Apache ECharts, MUI X Charts; Python: Altair, Bokeh, lets-plot, Matplotlib, Plotly, plotnine, Pygal, Seaborn; R: ggplot2; Julia: Makie.jl. Compare all 15 side by side: Mosaic Subplot Layout with Varying Sizes in Python, R, Julia and JavaScript.
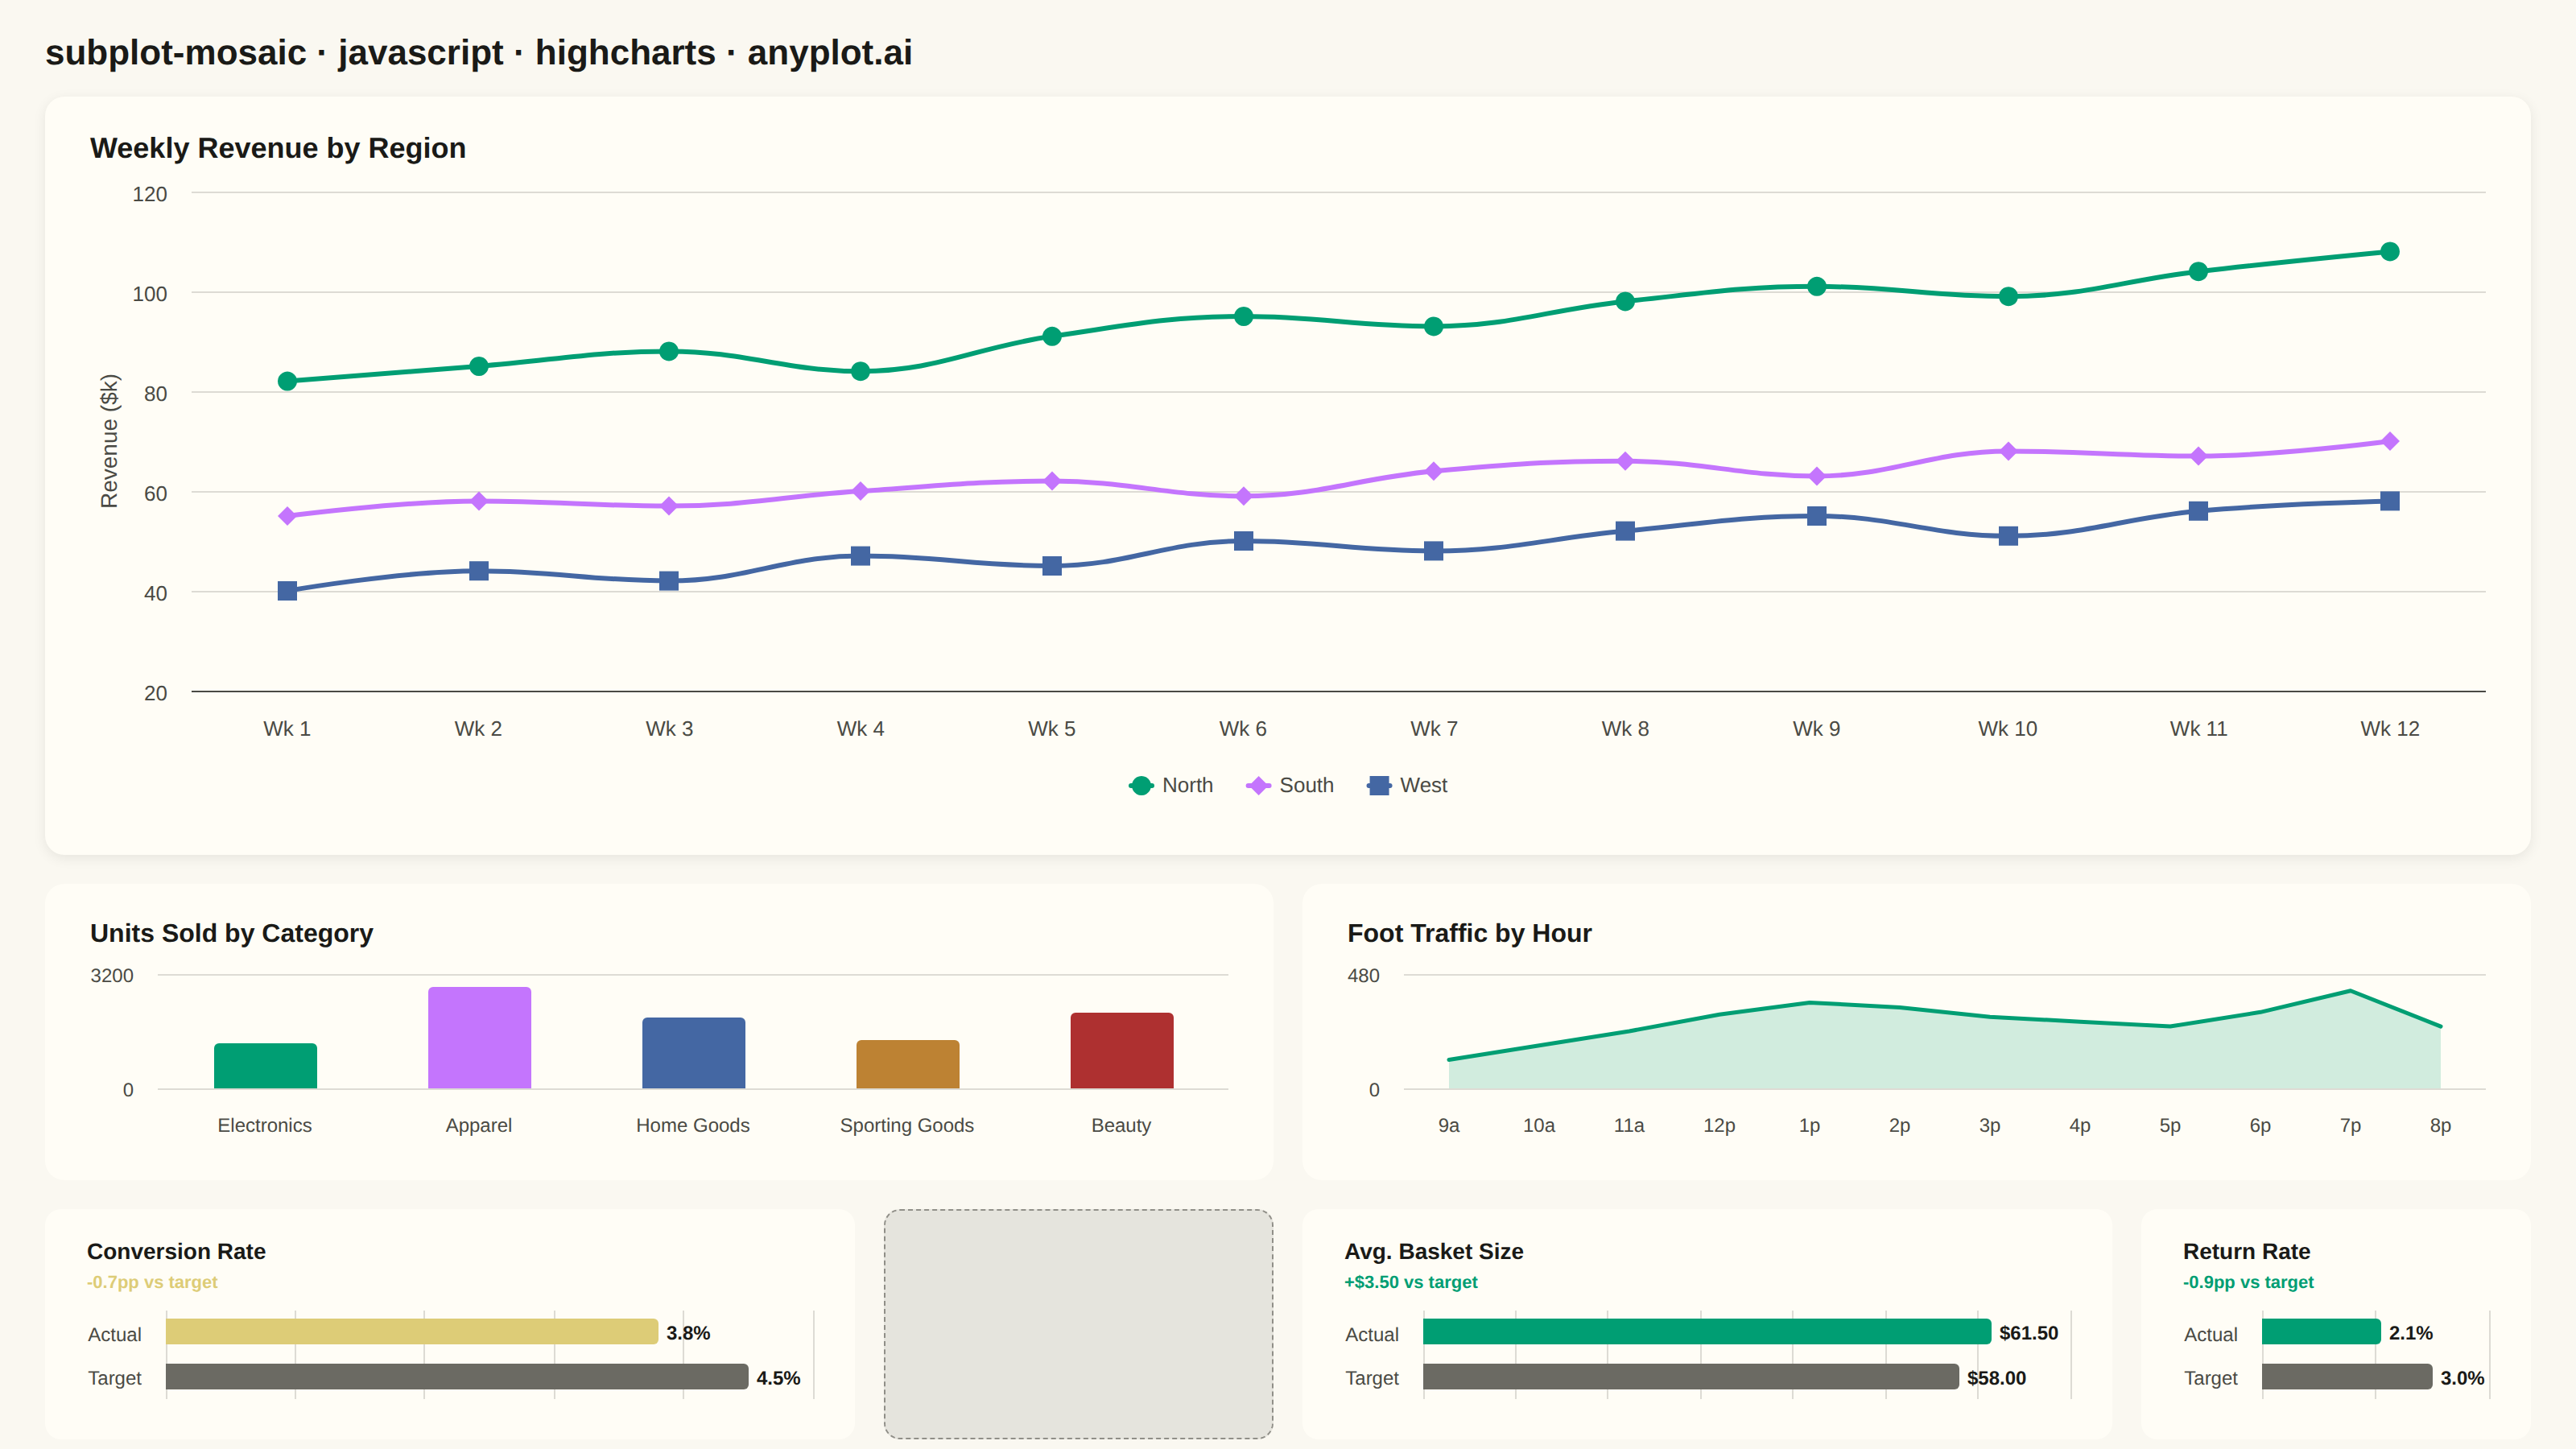
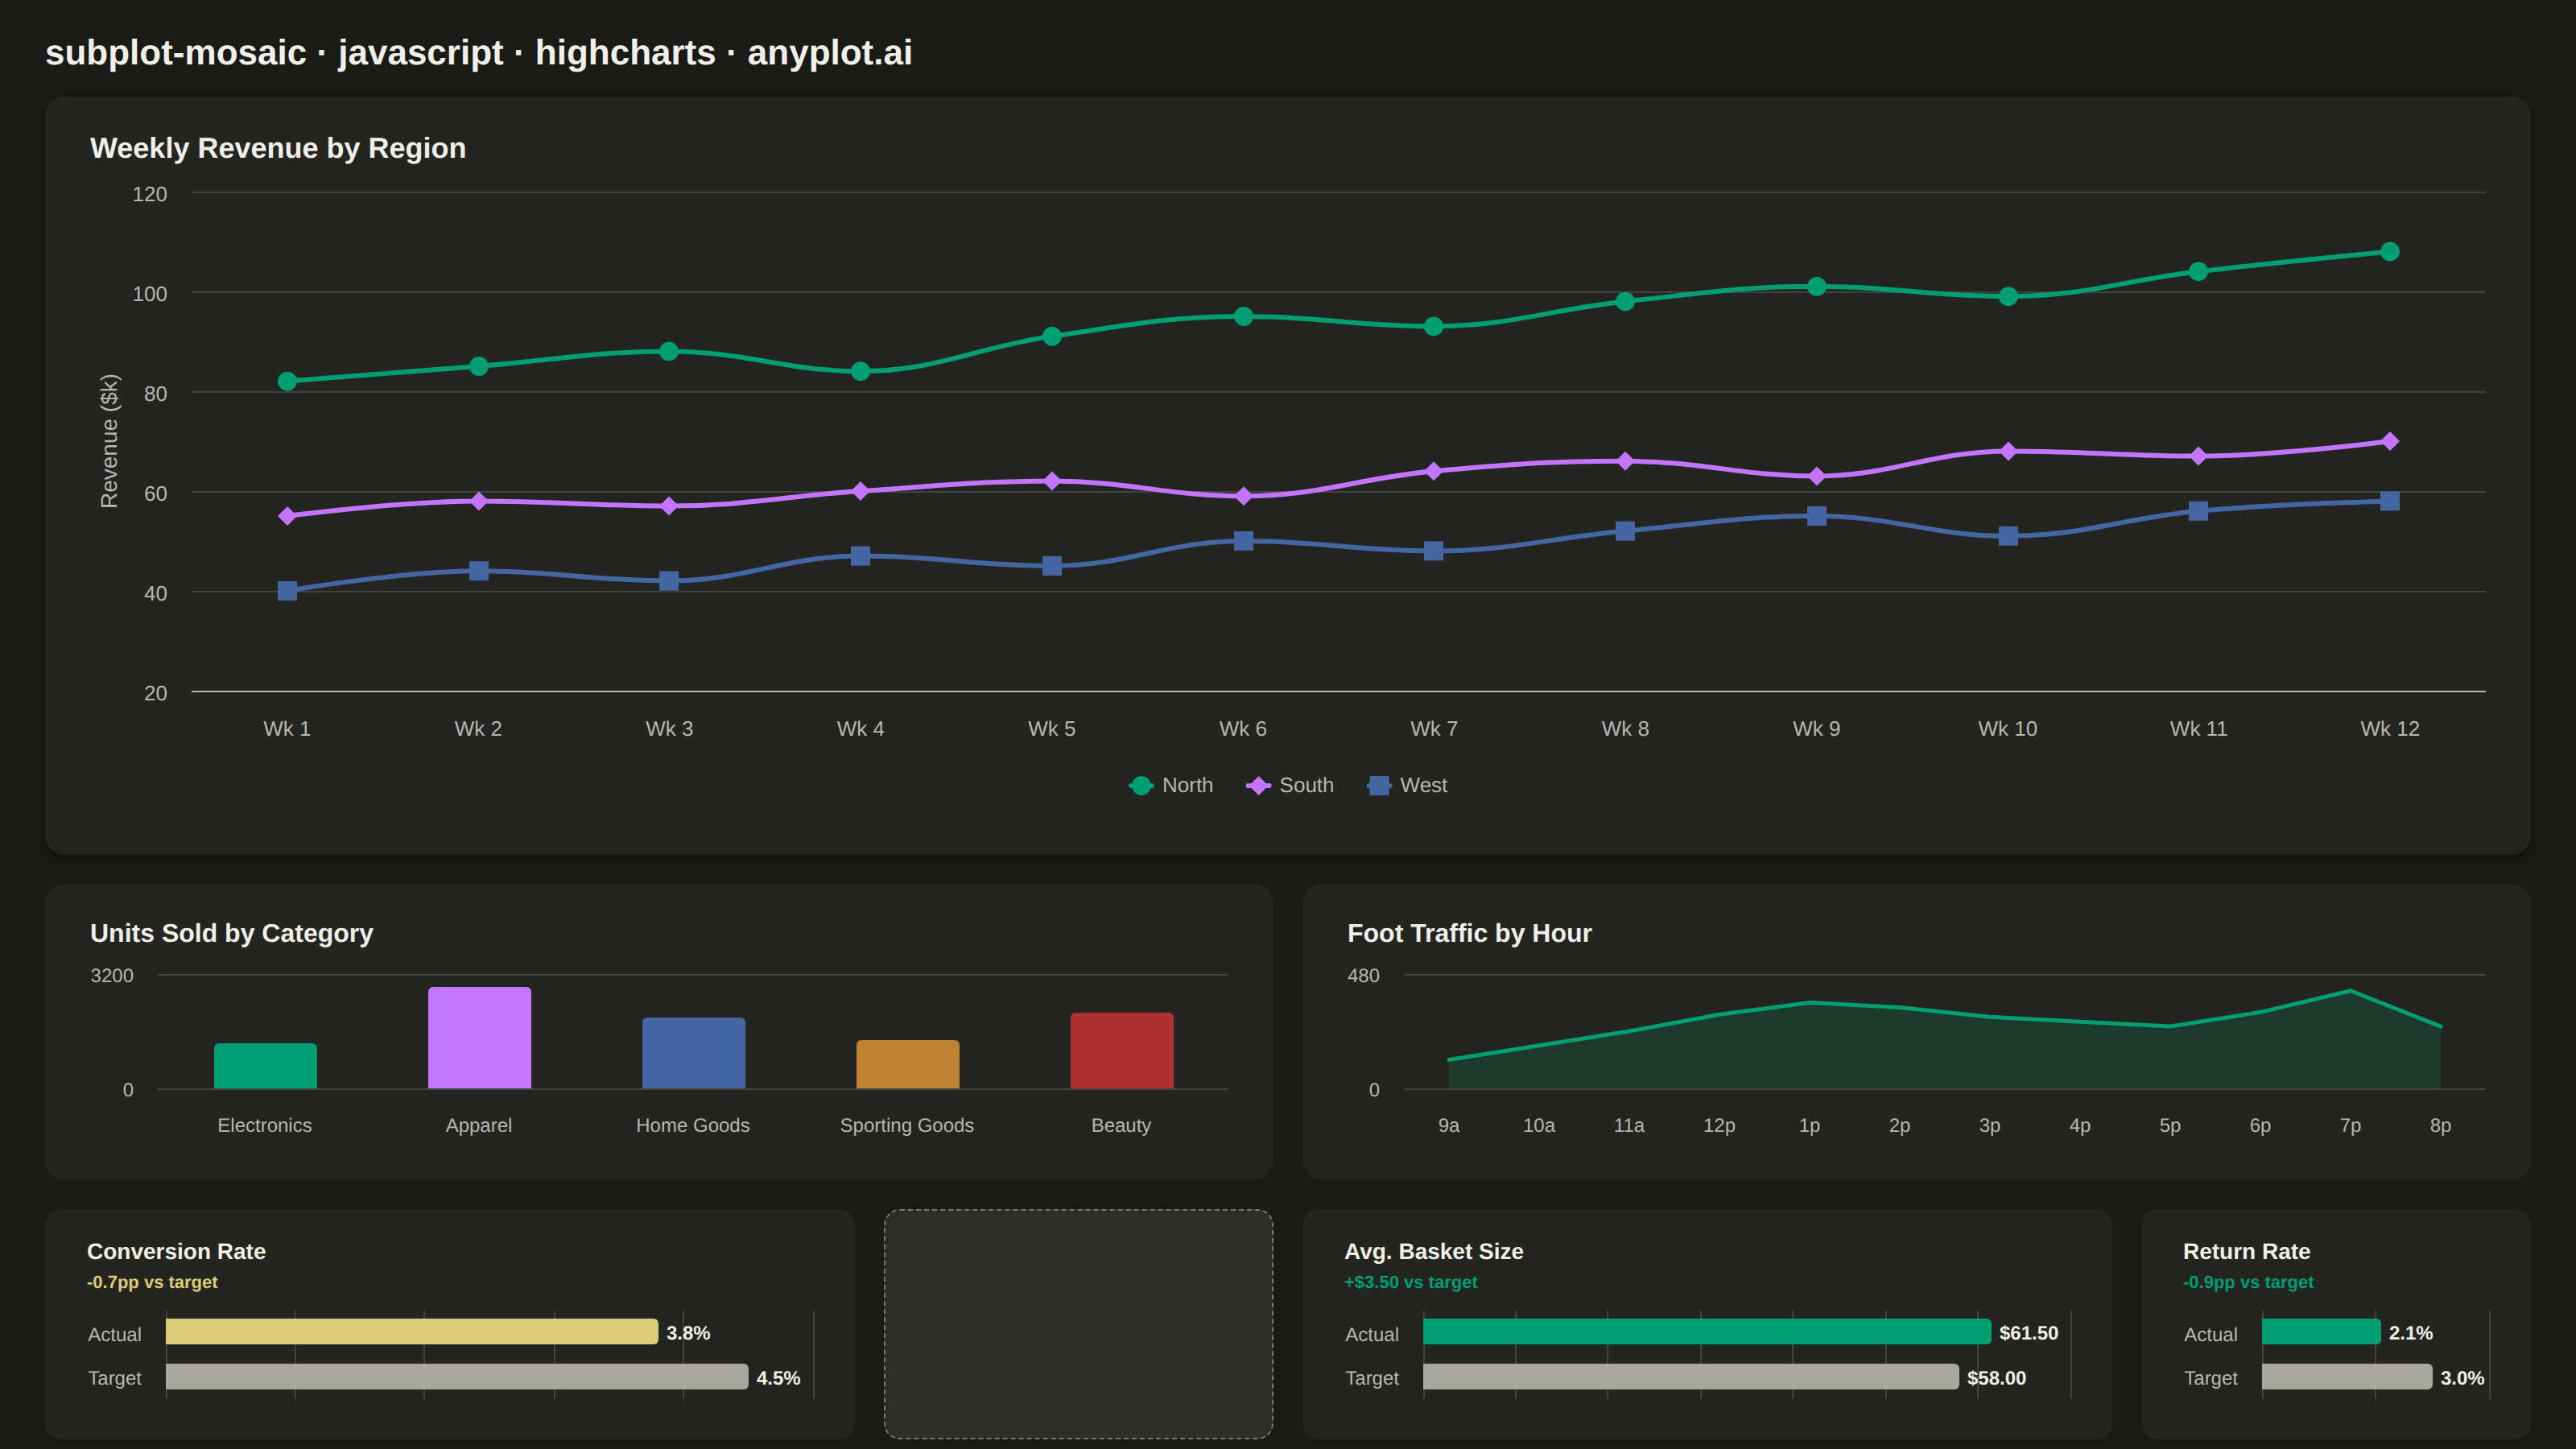
A complex subplot layout where different subplots can have varying sizes and arrangements using intuitive ASCII-art style string definitions. Unlike GridSpec approaches that require explicit row/column spanning, mosaic layouts allow defining layouts through visual string patterns (e.g., "AB;CC" creates A and B on top, C spanning below), making complex configurations more readable and maintainable.
// anyplot.ai
// subplot-mosaic: Mosaic Subplot Layout with Varying Sizes
// Library: highcharts 12.6.0 | JavaScript 22.23.2
// Quality: 90/100 | Created: 2026-09-09

//# anyplot-orientation: landscape
const t = window.ANYPLOT_TOKENS;
// "muted" semantic anchor (other/rest) — not in ANYPLOT_TOKENS, so derive it
// the same way the harness derives inkSoft/grid (theme-adaptive, off ink).
const MUTED = t.theme === "dark" ? "#A8A79F" : "#6B6A63";

// --- Data (in-memory, deterministic, retail-operations scenario) -----------
const weeks = Array.from({ length: 12 }, (_, i) => `Wk ${i + 1}`);
const revenueNorth = [82, 85, 88, 84, 91, 95, 93, 98, 101, 99, 104, 108];
const revenueSouth = [55, 58, 57, 60, 62, 59, 64, 66, 63, 68, 67, 70];
const revenueWest = [40, 44, 42, 47, 45, 50, 48, 52, 55, 51, 56, 58];

const categories = ["Electronics", "Apparel", "Home Goods", "Sporting Goods", "Beauty"];
const unitsSold = [1240, 2860, 1975, 1330, 2100];

const hours = ["9a", "10a", "11a", "12p", "1p", "2p", "3p", "4p", "5p", "6p", "7p", "8p"];
const footTraffic = [120, 180, 240, 310, 360, 340, 300, 280, 260, 320, 410, 260];

const metrics = [
  { title: "Conversion Rate", actual: 3.8, target: 4.5, suffix: "%", good: false },
  { title: "Avg. Basket Size", actual: 61.5, target: 58.0, suffix: "$", good: true },
  { title: "Return Rate", actual: 2.1, target: 3.0, suffix: "%", good: true },
];

// --- Layout (mosaic grid built as DOM; each cell mounts its own Highcharts
//     instance, exactly like matplotlib's ASCII subplot_mosaic strings but
//     expressed as CSS grid-template-areas — "." marks a deliberate gap) -----
const root = document.getElementById("container");

const header = document.createElement("div");
header.style.cssText = `padding:20px 28px 6px; font-size:22px; font-weight:600; color:${t.ink}; font-family:inherit;`;
header.textContent = "subplot-mosaic · javascript · highcharts · anyplot.ai";
root.appendChild(header);

const mosaic = document.createElement("div");
mosaic.style.cssText = [
  "display:grid",
  "grid-template-columns:repeat(6, 1fr)",
  "grid-template-rows:1.35fr 1.35fr 1.1fr 0.85fr",
  `grid-template-areas:` +
    `"overview overview overview overview overview overview" ` +
    `"overview overview overview overview overview overview" ` +
    `"detail1 detail1 detail1 detail2 detail2 detail2" ` +
    `"metric0 metric0 . metric1 metric1 metric2"`,
  "gap:18px",
  "margin:8px 28px 26px",
  "height:calc(100% - 66px)",
].join(";");
root.appendChild(mosaic);

// Tiered card chrome — a soft lift on the dominant overview panel, a flatter
// and more compact treatment on the small KPI tiles — so the mosaic reads as
// a deliberate hierarchy rather than six identically-styled boxes.
function makeCell(area, id, tier) {
  const card = document.createElement("div");
  const pad = tier === "tertiary" ? "10px 16px" : "14px 18px";
  const radius = tier === "tertiary" ? "10px" : "12px";
  const shadow =
    tier === "primary"
      ? t.theme === "dark"
        ? "0 2px 8px rgba(0,0,0,0.4)"
        : "0 2px 8px rgba(0,0,0,0.08)"
      : "none";
  card.style.cssText = `grid-area:${area}; background:${t.elevatedBg}; border-radius:${radius}; padding:${pad}; min-width:0; min-height:0; box-shadow:${shadow};`;
  const mount = document.createElement("div");
  mount.id = id;
  mount.style.cssText = "width:100%; height:100%;";
  card.appendChild(mount);
  mosaic.appendChild(card);
  return mount;
}

const overviewMount = makeCell("overview", "cell-overview", "primary");
const detail1Mount = makeCell("detail1", "cell-detail1", "secondary");
const detail2Mount = makeCell("detail2", "cell-detail2", "secondary");
const metricMounts = metrics.map((m, i) => makeCell(`metric${i}`, `cell-metric${i}`, "tertiary"));

// The mosaic string's "." is a genuinely empty grid cell (no grid-area name,
// so it can only be targeted by explicit line placement) — give it a faint
// tint + dashed border so it reads as deliberate structure, not a missing
// panel. Column 3 / row 4 matches the "." position in the template-areas
// string above.
const gapCell = document.createElement("div");
gapCell.style.cssText = `grid-column:3 / 4; grid-row:4 / 5; border-radius:10px; border:1px dashed ${t.inkSoft}; background:${t.grid}; opacity:0.6;`;
mosaic.appendChild(gapCell);

// Chart instances created below, so their sizes can be reflowed once the grid
// has actually resolved row heights (see the reflow block at the bottom of
// this file — a fresh mount's percentage height reads back as 0 the instant
// Highcharts.chart() runs, so every panel would otherwise fall back to
// Highcharts' default 400px and clip most of the data out of view).
const panelCharts = [];

// --- Overview: wide dominant panel, weekly revenue trend by region ---------
panelCharts.push(Highcharts.chart(overviewMount.id, {
  chart: { type: "spline", backgroundColor: "transparent", animation: false, style: { fontFamily: "inherit" } },
  credits: { enabled: false },
  colors: t.palette,
  title: { text: "Weekly Revenue by Region", align: "left", style: { color: t.ink, fontSize: "18px", fontWeight: "600" } },
  xAxis: {
    categories: weeks,
    lineColor: t.inkSoft,
    tickColor: t.inkSoft,
    labels: { style: { color: t.inkSoft, fontSize: "13px" } },
  },
  yAxis: {
    title: { text: "Revenue ($k)", style: { color: t.inkSoft, fontSize: "14px" } },
    gridLineColor: t.grid,
    labels: { style: { color: t.inkSoft, fontSize: "13px" } },
  },
  legend: { itemStyle: { color: t.inkSoft, fontSize: "13px" }, itemHoverStyle: { color: t.ink } },
  plotOptions: { series: { animation: false, lineWidth: 3, marker: { radius: 6 } } },
  series: [
    { name: "North", data: revenueNorth },
    { name: "South", data: revenueSouth },
    { name: "West", data: revenueWest },
  ],
}));

// --- Detail 1: medium panel, units sold by category -------------------------
panelCharts.push(Highcharts.chart(detail1Mount.id, {
  chart: { type: "column", backgroundColor: "transparent", animation: false, style: { fontFamily: "inherit" } },
  credits: { enabled: false },
  colors: t.palette,
  title: { text: "Units Sold by Category", align: "left", style: { color: t.ink, fontSize: "16px", fontWeight: "600" } },
  xAxis: {
    categories,
    lineWidth: 0,
    tickLength: 0,
    labels: { style: { color: t.inkSoft, fontSize: "12px" } },
  },
  yAxis: {
    title: { text: null },
    lineWidth: 0,
    gridLineColor: t.grid,
    labels: { style: { color: t.inkSoft, fontSize: "12px" } },
  },
  legend: { enabled: false },
  plotOptions: { series: { animation: false }, column: { borderWidth: 0 } },
  series: [{ name: "Units", data: unitsSold, colorByPoint: true }],
}));

// --- Detail 2: medium panel, hourly foot traffic ----------------------------
panelCharts.push(Highcharts.chart(detail2Mount.id, {
  chart: { type: "area", backgroundColor: "transparent", animation: false, style: { fontFamily: "inherit" } },
  credits: { enabled: false },
  colors: t.palette,
  title: { text: "Foot Traffic by Hour", align: "left", style: { color: t.ink, fontSize: "16px", fontWeight: "600" } },
  xAxis: {
    categories: hours,
    lineWidth: 0,
    tickLength: 0,
    labels: { style: { color: t.inkSoft, fontSize: "12px" } },
  },
  yAxis: {
    title: { text: null },
    lineWidth: 0,
    gridLineColor: t.grid,
    labels: { style: { color: t.inkSoft, fontSize: "12px" } },
  },
  legend: { enabled: false },
  plotOptions: {
    series: { animation: false },
    area: { fillOpacity: 0.18, lineWidth: 2.5, marker: { enabled: false } },
  },
  series: [{ name: "Visitors", data: footTraffic, color: t.palette[0] }],
}));

// --- Metrics row: three small KPI panels, actual vs. target ----------------
metrics.forEach((m, i) => {
  const statusColor = m.good ? t.palette[0] : t.amber;
  const format = (v) => (m.suffix === "$" ? `$${v.toFixed(2)}` : `${v.toFixed(1)}%`);
  // Explicit delta annotation so the story reads even without relying on the
  // amber/green hue alone (percentage-point metrics report "pp", dollar
  // metrics report the raw currency difference).
  const delta = m.actual - m.target;
  const deltaText =
    m.suffix === "$"
      ? `${delta >= 0 ? "+" : "-"}$${Math.abs(delta).toFixed(2)} vs target`
      : `${delta >= 0 ? "+" : "-"}${Math.abs(delta).toFixed(1)}pp vs target`;
  panelCharts.push(Highcharts.chart(metricMounts[i].id, {
    chart: { type: "bar", backgroundColor: "transparent", animation: false, style: { fontFamily: "inherit" } },
    credits: { enabled: false },
    title: { text: m.title, align: "left", style: { color: t.ink, fontSize: "14px", fontWeight: "600" } },
    subtitle: {
      text: deltaText,
      align: "left",
      style: { color: statusColor, fontSize: "11px", fontWeight: "600" },
    },
    xAxis: {
      categories: ["Actual", "Target"],
      lineWidth: 0,
      tickLength: 0,
      labels: { style: { color: t.inkSoft, fontSize: "12px" } },
    },
    yAxis: { title: { text: null }, lineWidth: 0, gridLineColor: t.grid, labels: { enabled: false } },
    legend: { enabled: false },
    plotOptions: {
      series: {
        animation: false,
        dataLabels: {
          enabled: true,
          style: { color: t.ink, fontSize: "12px", fontWeight: "600", textOutline: "none" },
          formatter() {
            return format(this.y);
          },
        },
      },
      bar: { borderWidth: 0, pointPadding: 0.15, groupPadding: 0.1 },
    },
    series: [
      {
        data: [
          { y: m.actual, color: statusColor },
          { y: m.target, color: MUTED },
        ],
      },
    ],
  }));
});

// A brand-new mount's percentage height resolves to 0 the instant
// Highcharts.chart() reads it (CSS Grid rows haven't settled a layout pass
// yet), so every panel above was created at Highcharts' 400px fallback.
// chart.reflow() alone doesn't fix this — it still trusts the container's
// computed CSS height, which stays wrong for a percentage-height mount in
// some Chromium timing cases — so set each chart's real pixel size directly
// from its mount's post-layout bounding box once two animation frames have
// let the grid settle, then signal the harness explicitly.
const panelMounts = [overviewMount, detail1Mount, detail2Mount, ...metricMounts];
requestAnimationFrame(() => {
  requestAnimationFrame(() => {
    panelCharts.forEach((chart, i) => {
      const rect = panelMounts[i].getBoundingClientRect();
      chart.setSize(rect.width, rect.height, false);
    });
    window.__anyplotReady = true;
  });
});
Runnable source as JSON, for any HTTP client: https://api.anyplot.ai/specs/subplot-mosaic/highcharts/code. Any spec id and library id listed in llms-full.txt fit the same URL shape; every URL below is complete and callable.
{
  "spec_id": "subplot-mosaic",
  "language": "javascript",
  "library": "highcharts",
  "page": "https://anyplot.ai/subplot-mosaic/javascript/highcharts",
  "hub": "https://anyplot.ai/subplot-mosaic",
  "code_json": "https://api.anyplot.ai/specs/subplot-mosaic/highcharts/code",
  "spec_json": "https://api.anyplot.ai/specs/subplot-mosaic",
  "render_light_png": "https://storage.googleapis.com/anyplot-images/plots/subplot-mosaic/javascript/highcharts/plot-light.png",
  "render_dark_png": "https://storage.googleapis.com/anyplot-images/plots/subplot-mosaic/javascript/highcharts/plot-dark.png",
  "interactive_light_html": "https://storage.googleapis.com/anyplot-images/plots/subplot-mosaic/javascript/highcharts/plot-light.html",
  "interactive_dark_html": "https://storage.googleapis.com/anyplot-images/plots/subplot-mosaic/javascript/highcharts/plot-dark.html",
  "quality_score": 90.0,
  "license": "MIT",
  "guide": "https://anyplot.ai/llms.txt"
}
Part of Mosaic Subplot Layout with Varying Sizes on anyplot.ai.