The same plot in 14 other libraries — JavaScript: D3.js, Apache ECharts, Highcharts, MUI X Charts; Python: Altair, Bokeh, lets-plot, Matplotlib, Plotly, plotnine, Pygal, Seaborn; R: ggplot2; Julia: Makie.jl. Compare all 15 side by side: Basic Sunburst Chart in Python, R, Julia and JavaScript.
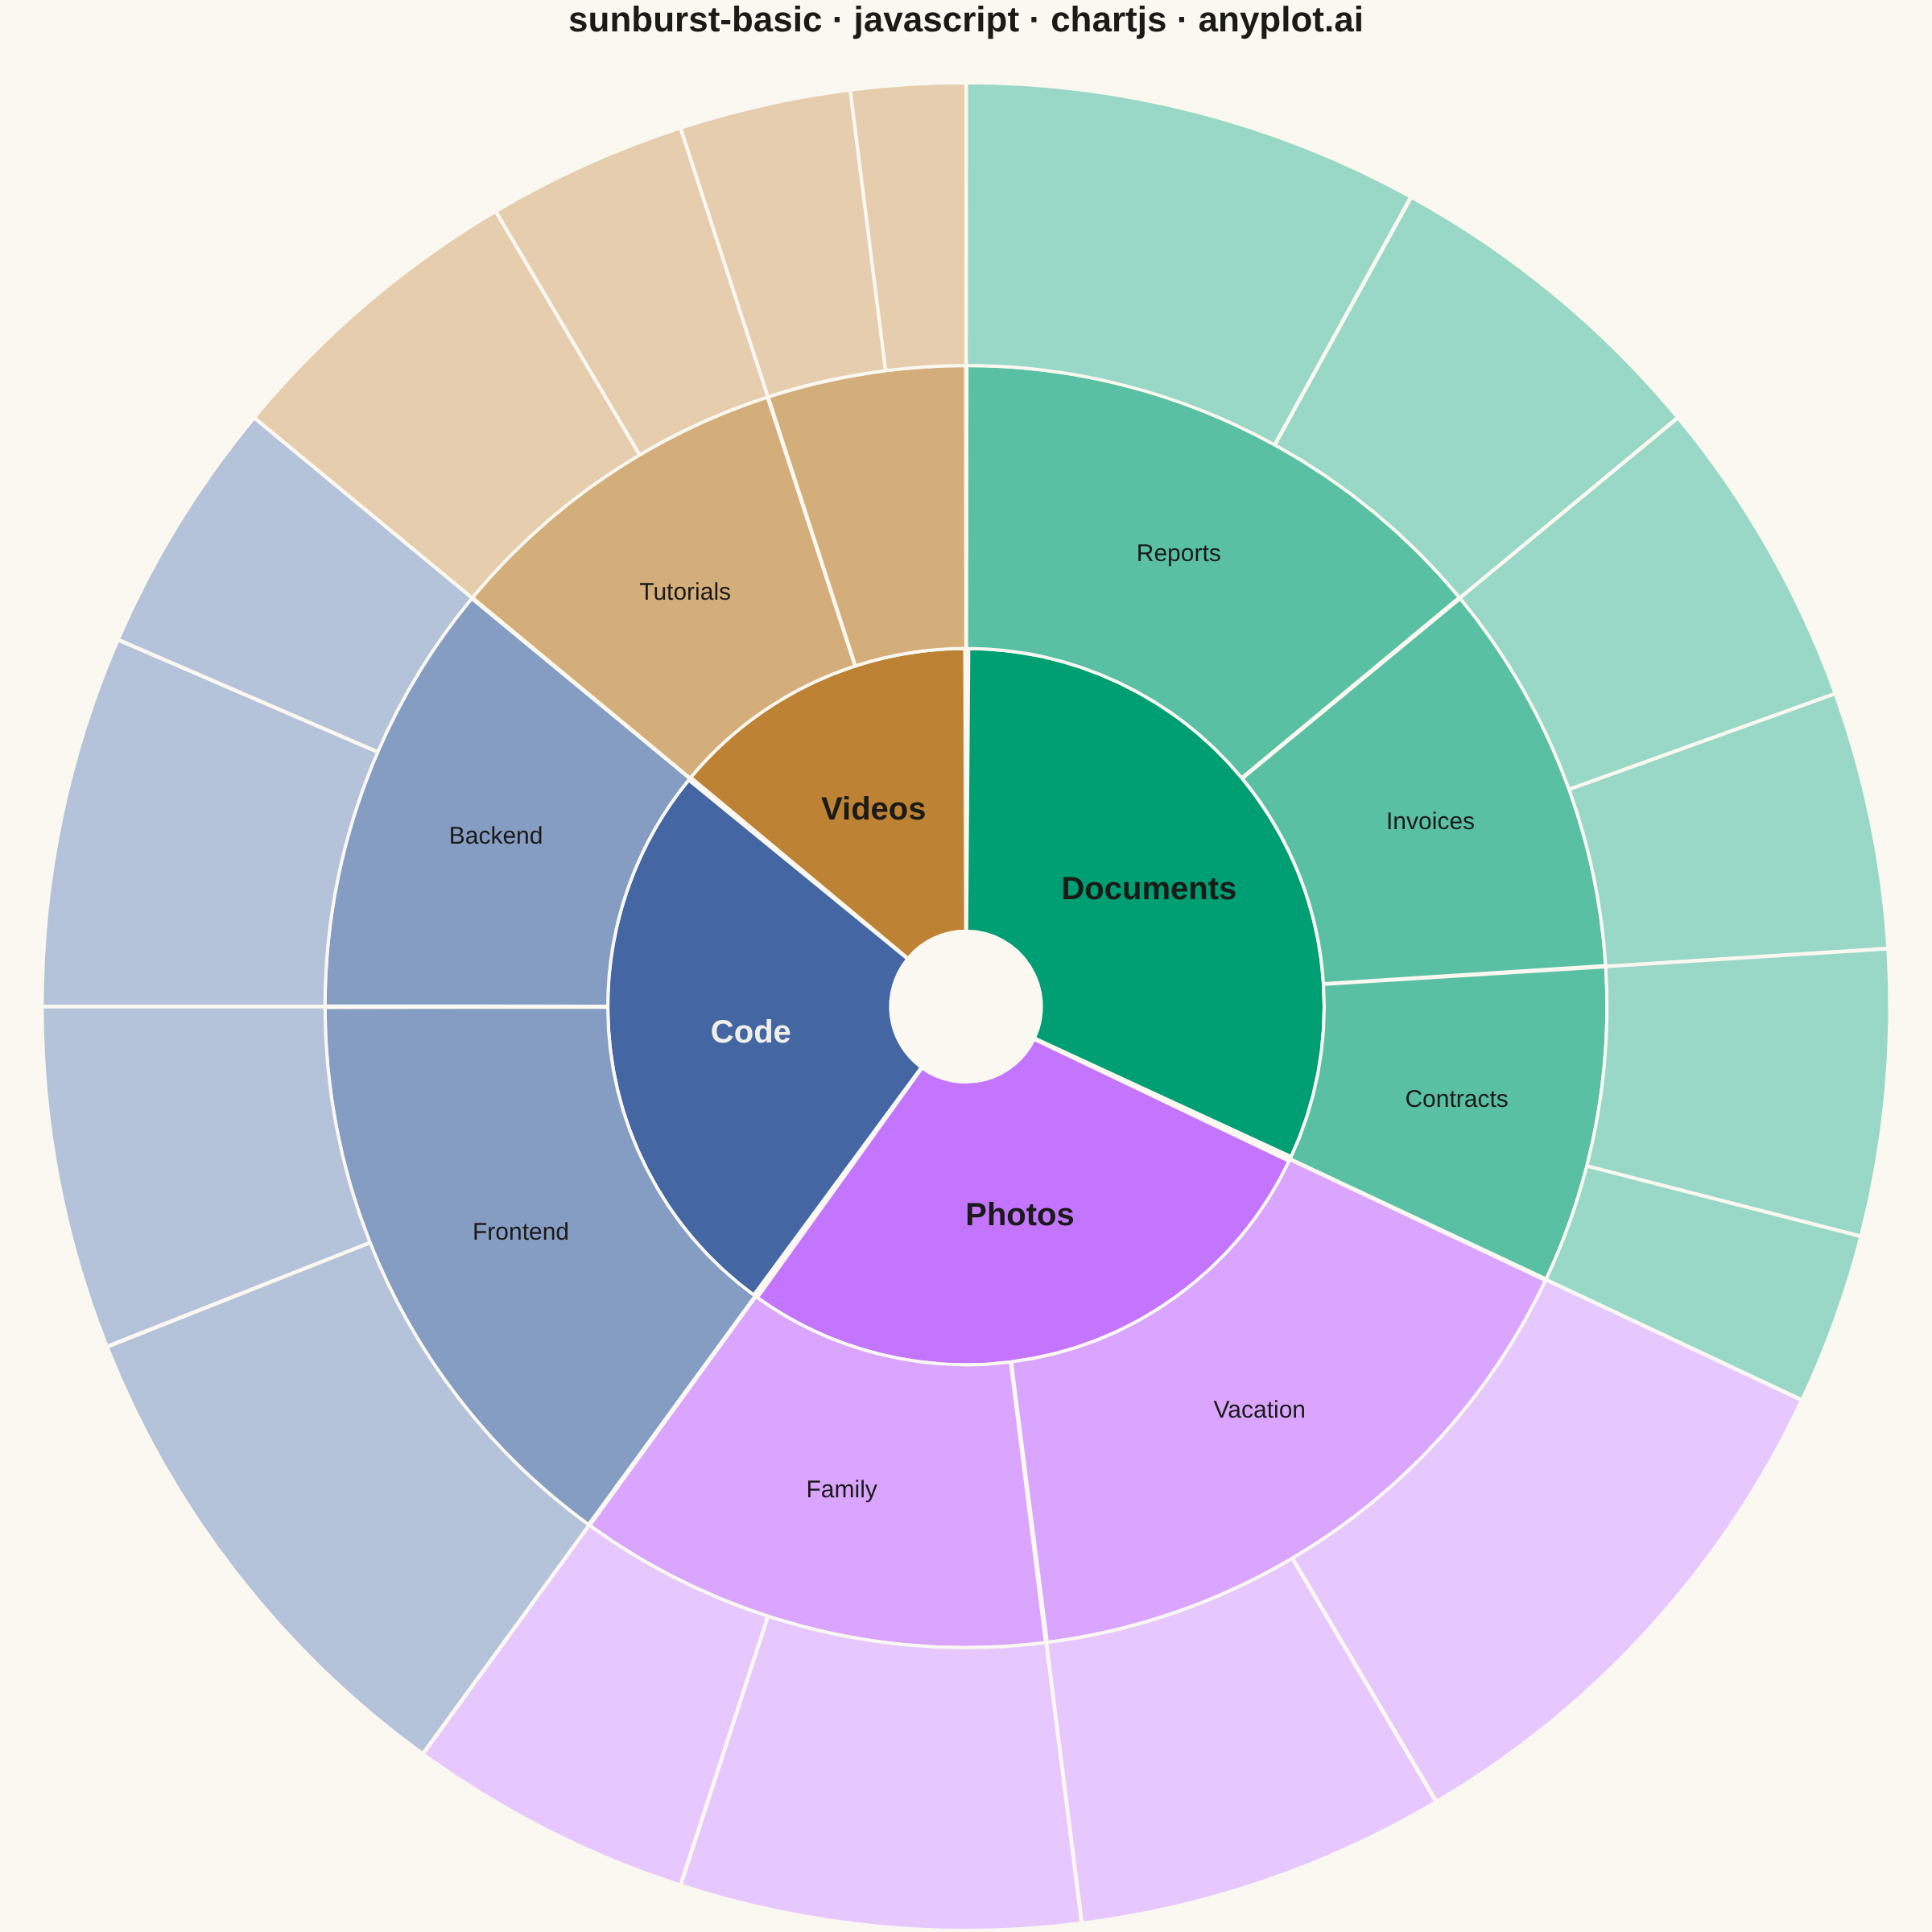
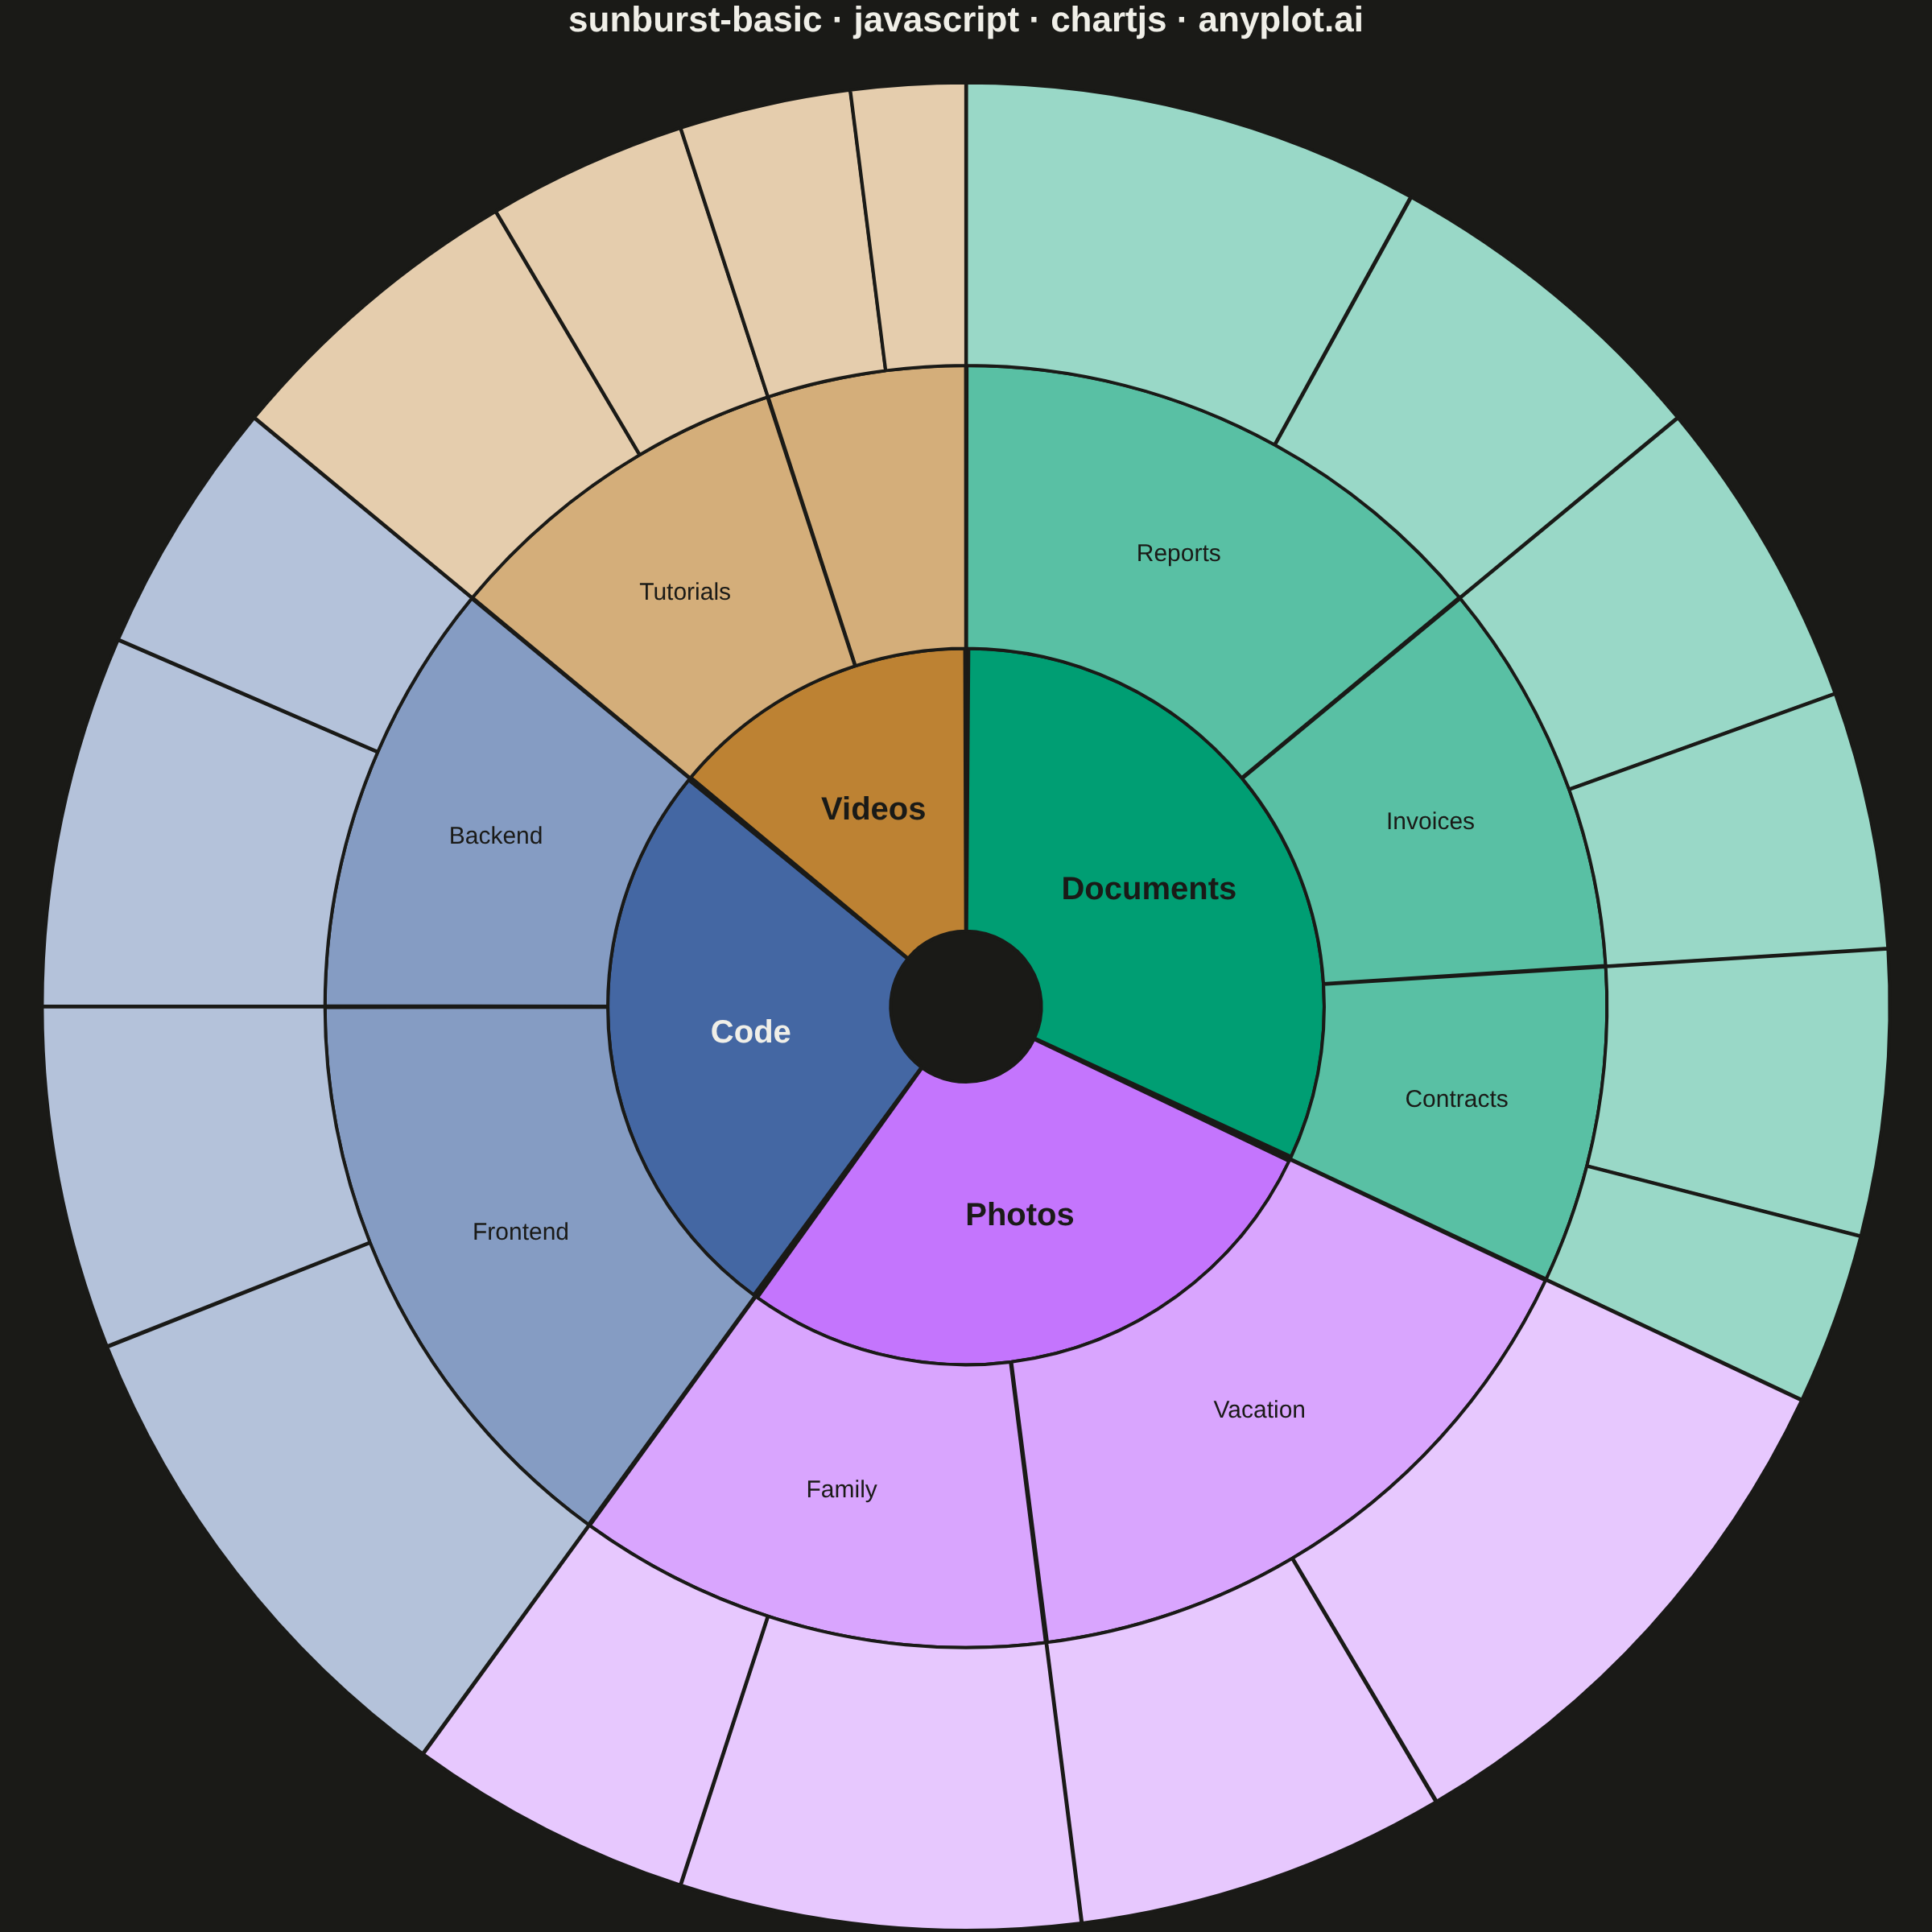
A sunburst chart displays hierarchical data as concentric rings, where each ring represents a level in the hierarchy. Inner rings show parent categories while outer rings show their children, with segment angles proportional to values. This radial visualization excels at revealing hierarchical structures and part-to-whole relationships across multiple levels simultaneously.
// anyplot.ai
// sunburst-basic: Basic Sunburst Chart
// Library: chartjs 4.4.7 | JavaScript 22.23.1
// Quality: 91/100 | Created: 2026-07-26

//# anyplot-orientation: square

const t = window.ANYPLOT_TOKENS;

// --- Data: local drive usage, 3-level folder hierarchy (MB) -----------------
// Each parent's value equals the sum of its children, so every ring shares the
// same total and matching order — this is what keeps a parent arc's angular
// span exactly encompassing its children's combined span across rings.
const level1 = [
  { label: "Documents", value: 320 },
  { label: "Photos", value: 280 },
  { label: "Code", value: 260 },
  { label: "Videos", value: 140 },
];

const level2 = [
  { parent: 0, label: "Reports", value: 140 },
  { parent: 0, label: "Invoices", value: 100 },
  { parent: 0, label: "Contracts", value: 80 },
  { parent: 1, label: "Vacation", value: 160 },
  { parent: 1, label: "Family", value: 120 },
  { parent: 2, label: "Frontend", value: 150 },
  { parent: 2, label: "Backend", value: 110 },
  { parent: 3, label: "Tutorials", value: 90 },
  { parent: 3, label: "Clips", value: 50 },
];

const level3 = [
  { parent: 0, label: "Q1 Report", value: 80 },
  { parent: 0, label: "Q2 Report", value: 60 },
  { parent: 1, label: "Client A", value: 55 },
  { parent: 1, label: "Client B", value: 45 },
  { parent: 2, label: "Vendor X", value: 50 },
  { parent: 2, label: "Vendor Y", value: 30 },
  { parent: 3, label: "Summer 2024", value: 95 },
  { parent: 3, label: "Winter 2024", value: 65 },
  { parent: 4, label: "Birthdays", value: 70 },
  { parent: 4, label: "Holidays", value: 50 },
  { parent: 5, label: "React App", value: 90 },
  { parent: 5, label: "UI Kit", value: 60 },
  { parent: 6, label: "API Server", value: 65 },
  { parent: 6, label: "Database", value: 45 },
  { parent: 7, label: "Beginner", value: 55 },
  { parent: 7, label: "Advanced", value: 35 },
  { parent: 8, label: "Highlights", value: 30 },
  { parent: 8, label: "Bloopers", value: 20 },
];

// --- Branch coloring: same hue per branch, lighter tint per outward ring ----
// Tints mix toward white (not the page background) so data colors stay
// identical between light and dark themes — only chrome flips.
const branchColors = [t.palette[0], t.palette[1], t.palette[2], t.palette[3]];

function tint(hex, amount) {
  const n = parseInt(hex.slice(1), 16);
  const mix = (c) => Math.round(c + (255 - c) * amount);
  const r = mix((n >> 16) & 255);
  const g = mix((n >> 8) & 255);
  const b = mix(n & 255);
  return `#${[r, g, b].map((c) => c.toString(16).padStart(2, "0")).join("")}`;
}

function relativeLuminance(r, g, b) {
  const lin = (c) => {
    const s = c / 255;
    return s <= 0.03928 ? s / 12.92 : Math.pow((s + 0.055) / 1.055, 2.4);
  };
  return 0.2126 * lin(r) + 0.7152 * lin(g) + 0.0722 * lin(b);
}

function contrastRatio(l1, l2) {
  const lighter = Math.max(l1, l2);
  const darker = Math.min(l1, l2);
  return (lighter + 0.05) / (darker + 0.05);
}

function labelColorFor(hex) {
  const n = parseInt(hex.slice(1), 16);
  const luminance = relativeLuminance((n >> 16) & 255, (n >> 8) & 255, n & 255);
  const darkContrast = contrastRatio(luminance, relativeLuminance(0x1a, 0x1a, 0x17));
  const lightContrast = contrastRatio(luminance, relativeLuminance(0xf0, 0xef, 0xe8));
  return darkContrast >= lightContrast ? "#1A1A17" : "#F0EFE8";
}

const level1Colors = level1.map((d, i) => branchColors[i]);
const level2Colors = level2.map((d) => tint(branchColors[d.parent], 0.35));
const level3Colors = level3.map((d) => tint(branchColors[level2[d.parent].parent], 0.6));

// --- Breadcrumb paths for tooltips (leaf-level detail is hover-only) --------
const level1Paths = level1.map((d) => d.label);
const level2Paths = level2.map((d) => `${level1[d.parent].label} ▸ ${d.label}`);
const level3Paths = level3.map((d) => {
  const mid = level2[d.parent];
  return `${level1[mid.parent].label} ▸ ${mid.label} ▸ ${d.label}`;
});

// --- Custom plugin: draw labels directly on segments wide enough to hold ----
// them (the sunburst spec calls for labeling major segments only, leaving
// smaller ones to the interactive tooltip).
const MIN_LABEL_ANGLE = (20 * Math.PI) / 180;

const radialLabels = {
  id: "radialLabels",
  afterDatasetsDraw(chart) {
    const { ctx } = chart;
    ctx.save();
    ctx.textAlign = "center";
    ctx.textBaseline = "middle";
    chart.data.datasets.forEach((dataset, dsIndex) => {
      if (!dataset.sliceLabels) return;
      const meta = chart.getDatasetMeta(dsIndex);
      meta.data.forEach((arc, i) => {
        const { startAngle, endAngle } = arc.getProps(["startAngle", "endAngle"], true);
        if (endAngle - startAngle < MIN_LABEL_ANGLE) return;
        const { x, y } = arc.getCenterPoint(true);
        ctx.font = dataset.labelFont;
        ctx.fillStyle = dataset.sliceLabelColors[i];
        ctx.fillText(dataset.sliceLabels[i], x, y);
      });
    });
    ctx.restore();
  },
};
Chart.register(radialLabels);

// --- Mount -------------------------------------------------------------------
const canvas = document.createElement("canvas");
document.getElementById("container").appendChild(canvas);

// --- Chart: three concentric doughnut rings = one sunburst ------------------
// Dataset order matters: Chart.js draws dataset 0 as the outermost ring, so
// the leaf level (level3) comes first and the root level (level1) comes last.
new Chart(canvas, {
  type: "doughnut",
  data: {
    datasets: [
      {
        data: level3.map((d) => d.value),
        backgroundColor: level3Colors,
        borderColor: t.pageBg,
        borderWidth: 2,
        spacing: 2,
        weight: 1,
        paths: level3Paths,
      },
      {
        data: level2.map((d) => d.value),
        backgroundColor: level2Colors,
        borderColor: t.pageBg,
        borderWidth: 2,
        spacing: 2,
        weight: 1,
        paths: level2Paths,
        sliceLabels: level2.map((d) => d.label),
        sliceLabelColors: level2Colors.map(labelColorFor),
        labelFont: "500 15px sans-serif",
      },
      {
        data: level1.map((d) => d.value),
        backgroundColor: level1Colors,
        borderColor: t.pageBg,
        borderWidth: 2,
        spacing: 2,
        weight: 1,
        paths: level1Paths,
        sliceLabels: level1.map((d) => d.label),
        sliceLabelColors: level1Colors.map(labelColorFor),
        labelFont: "600 20px sans-serif",
      },
    ],
  },
  options: {
    responsive: true,
    maintainAspectRatio: false,
    animation: false,
    cutout: "8%",
    plugins: {
      title: {
        display: true,
        text: "sunburst-basic · javascript · chartjs · anyplot.ai",
        color: t.ink,
        font: { size: 22 },
        padding: { bottom: 24 },
      },
      legend: { display: false },
      tooltip: {
        callbacks: {
          title: (items) => items[0].dataset.paths[items[0].dataIndex],
          label: (item) => `${item.parsed} MB`,
        },
      },
    },
  },
});
Runnable source as JSON, for any HTTP client: https://api.anyplot.ai/specs/sunburst-basic/chartjs/code. Any spec id and library id listed in llms-full.txt fit the same URL shape; every URL below is complete and callable.
{
  "spec_id": "sunburst-basic",
  "language": "javascript",
  "library": "chartjs",
  "page": "https://anyplot.ai/sunburst-basic/javascript/chartjs",
  "hub": "https://anyplot.ai/sunburst-basic",
  "code_json": "https://api.anyplot.ai/specs/sunburst-basic/chartjs/code",
  "spec_json": "https://api.anyplot.ai/specs/sunburst-basic",
  "render_light_png": "https://storage.googleapis.com/anyplot-images/plots/sunburst-basic/javascript/chartjs/plot-light.png",
  "render_dark_png": "https://storage.googleapis.com/anyplot-images/plots/sunburst-basic/javascript/chartjs/plot-dark.png",
  "interactive_light_html": "https://storage.googleapis.com/anyplot-images/plots/sunburst-basic/javascript/chartjs/plot-light.html",
  "interactive_dark_html": "https://storage.googleapis.com/anyplot-images/plots/sunburst-basic/javascript/chartjs/plot-dark.html",
  "quality_score": 91.0,
  "license": "MIT",
  "guide": "https://anyplot.ai/llms.txt"
}
Part of Basic Sunburst Chart on anyplot.ai.