The same plot in 14 other libraries — Python: Altair, Bokeh, lets-plot, Matplotlib, Plotly, plotnine, Pygal, Seaborn; Julia: Makie.jl; JavaScript: Chart.js, D3.js, Apache ECharts, Highcharts, MUI X Charts. Compare all 15 side by side: Basic Sunburst Chart in Python, R, Julia and JavaScript.
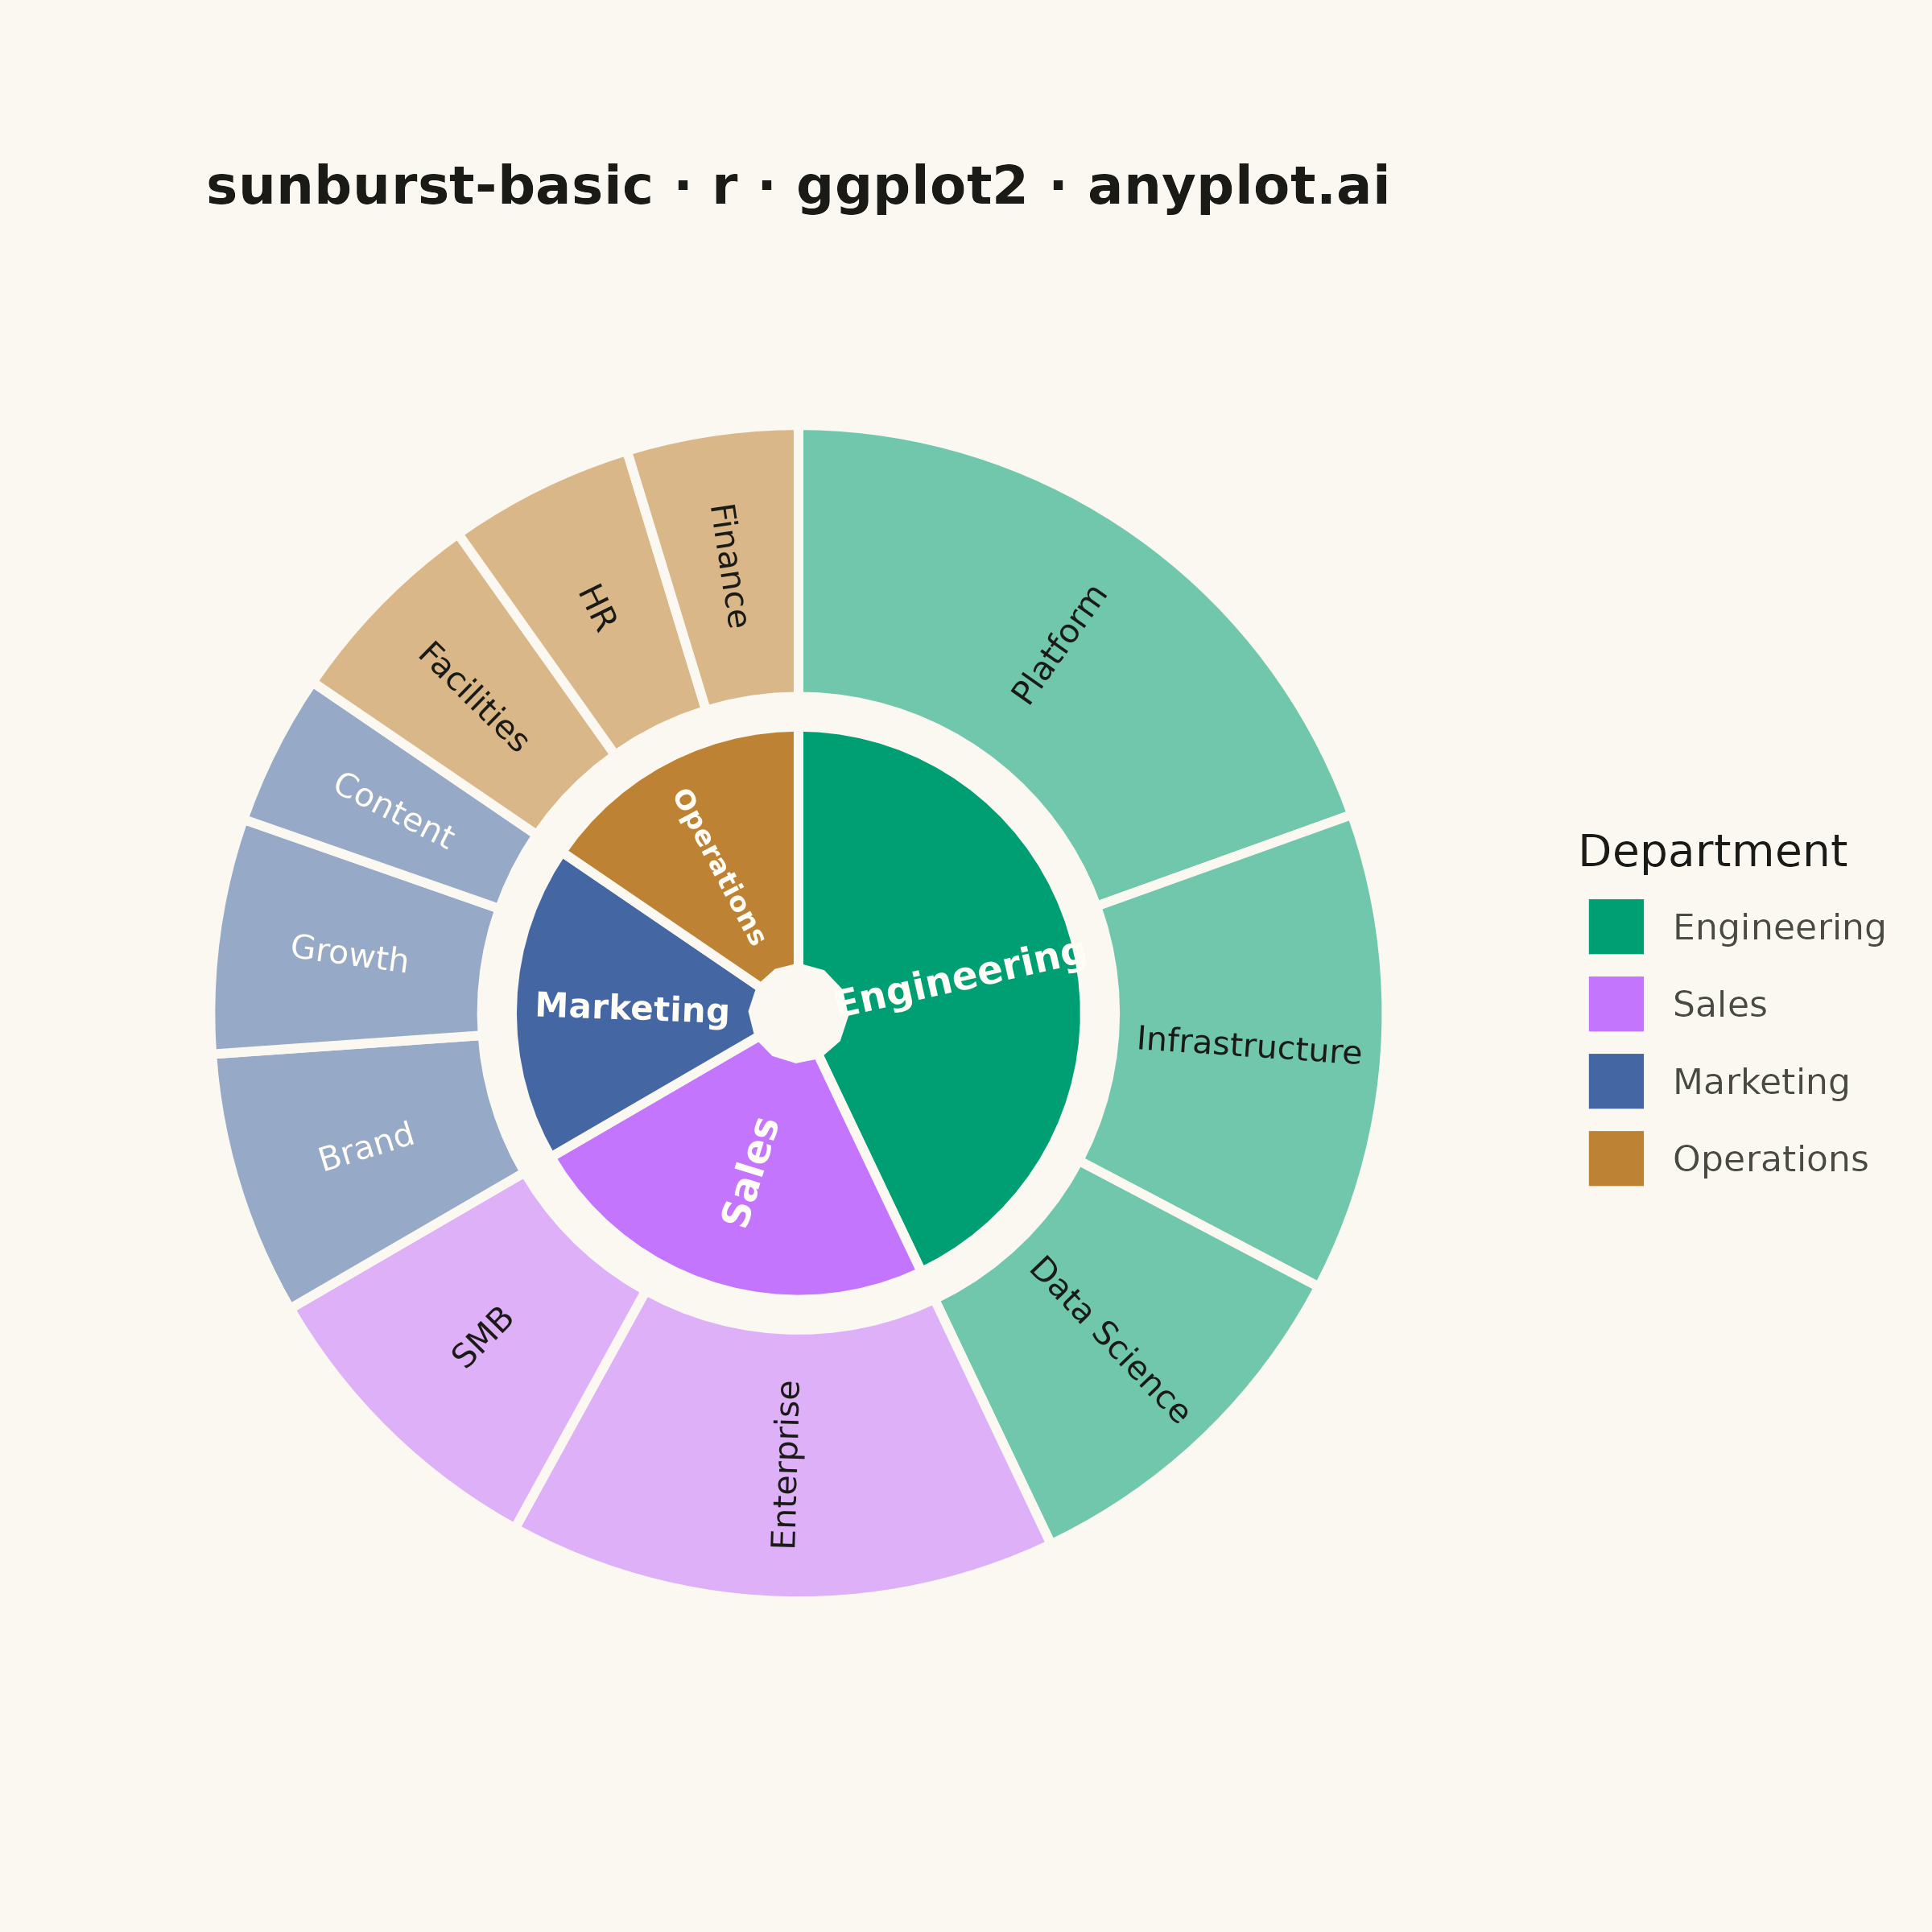
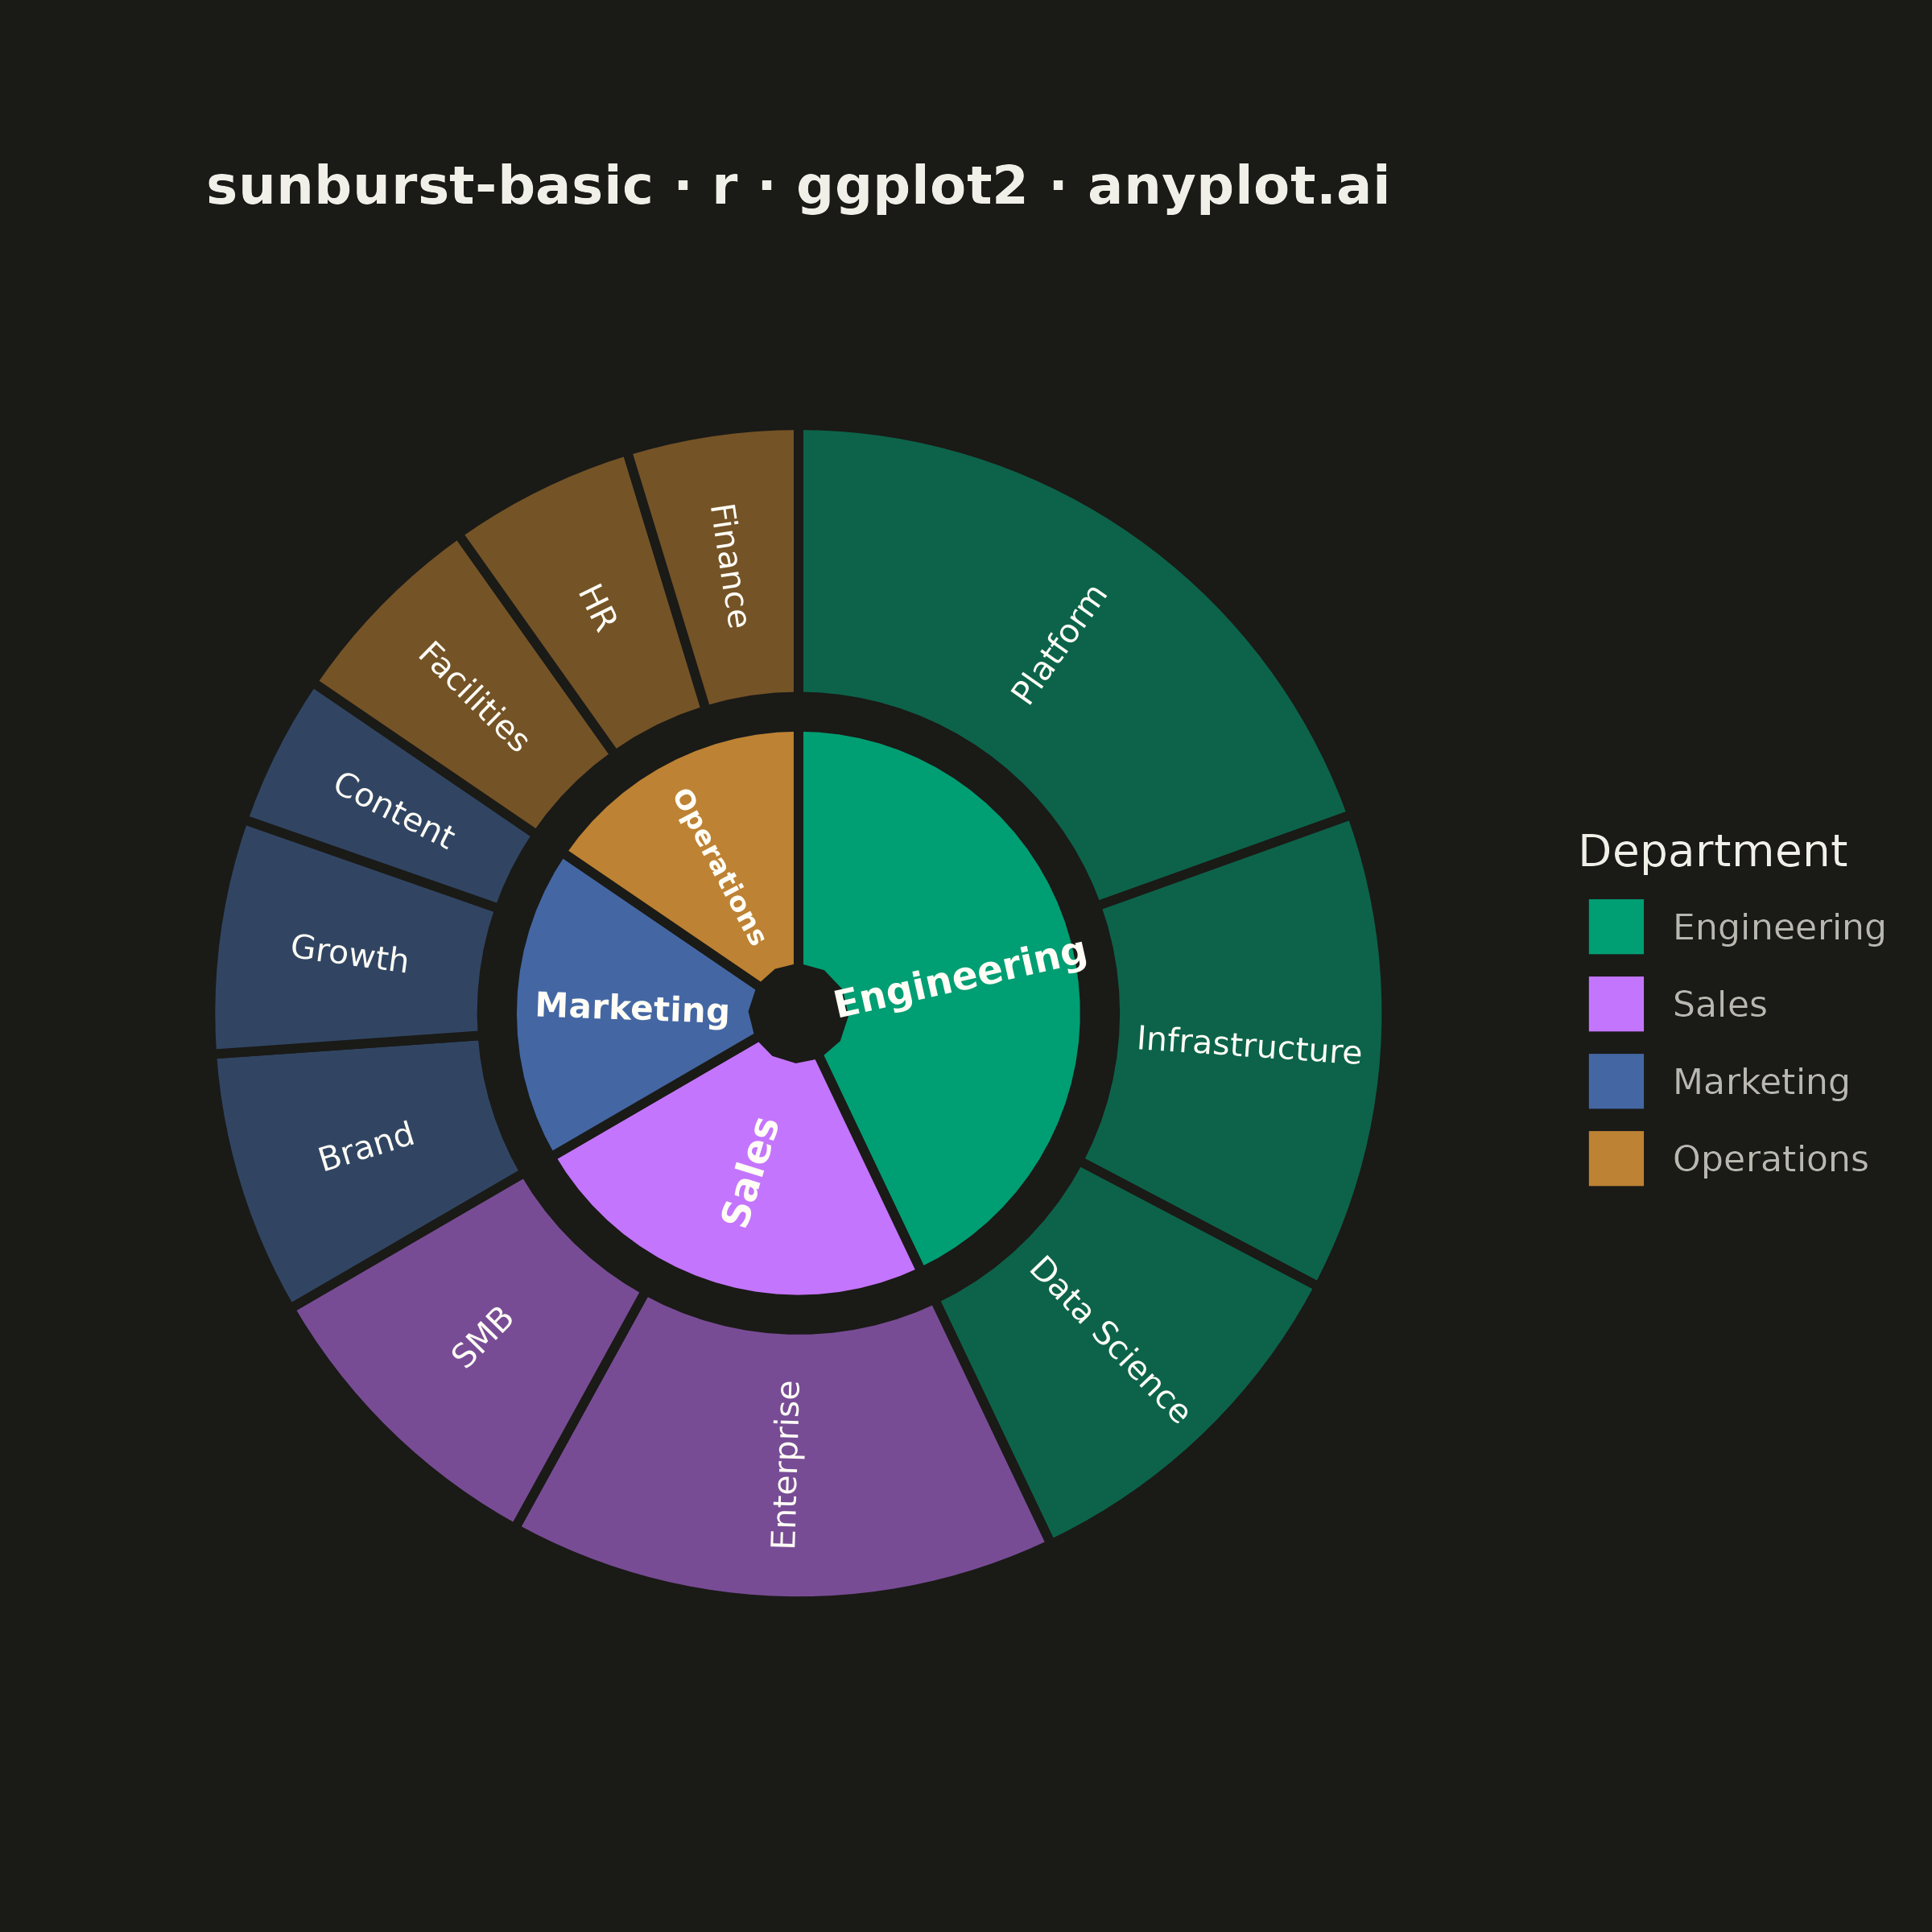
A sunburst chart displays hierarchical data as concentric rings, where each ring represents a level in the hierarchy. Inner rings show parent categories while outer rings show their children, with segment angles proportional to values. This radial visualization excels at revealing hierarchical structures and part-to-whole relationships across multiple levels simultaneously.
#' anyplot.ai
#' sunburst-basic: Basic Sunburst Chart
#' Library: ggplot2 3.5.1 | R 4.4.1
#' Quality: 91/100 | Created: 2026-07-26

library(ggplot2)
library(dplyr)
library(ragg)

set.seed(42)

# --- Theme tokens -------------------------------------------------------
THEME    <- Sys.getenv("ANYPLOT_THEME", "light")
PAGE_BG  <- if (THEME == "light") "#FAF8F1" else "#1A1A17"
INK      <- if (THEME == "light") "#1A1A17" else "#F0EFE8"
INK_SOFT <- if (THEME == "light") "#4A4A44" else "#B8B7B0"
IMPRINT_PALETTE <- c("#009E73", "#C475FD", "#4467A3", "#BD8233",
                     "#AE3030", "#2ABCCD", "#954477", "#99B314")

# WCAG relative luminance, used to pick readable ink for wedge labels
relative_luminance <- function(hex) {
  channel <- grDevices::col2rgb(hex) / 255
  linear <- ifelse(channel <= 0.03928, channel / 12.92, ((channel + 0.055) / 1.055)^2.4)
  sum(c(0.2126, 0.7152, 0.0722) * linear)
}

# Alpha-composite `hex` over `bg_hex` so luminance (and therefore ink choice)
# reflects what actually renders on screen, not the undiluted wedge hue —
# the outer ring is drawn at alpha = 0.55, which shifts it toward PAGE_BG.
blend_hex <- function(hex, bg_hex, alpha) {
  fg <- as.vector(grDevices::col2rgb(hex))
  bg <- as.vector(grDevices::col2rgb(bg_hex))
  blended <- alpha * fg + (1 - alpha) * bg
  grDevices::rgb(blended[1], blended[2], blended[3], maxColorValue = 255)
}

# Angle (degrees) for a label sitting at mid-fraction `mid` of the circle,
# flipped so text never renders upside down
wedge_label_angle <- function(mid_frac) {
  raw <- ((90 - 360 * mid_frac + 180) %% 360) - 180
  case_when(
    raw < -90 ~ raw + 180,
    raw > 90  ~ raw - 180,
    TRUE      ~ raw
  )
}

# --- Data: annual budget by department and team -------------------------
leaves <- tibble::tribble(
  ~department,   ~team,             ~budget,
  "Engineering", "Platform",           1450,
  "Engineering", "Infrastructure",      980,
  "Engineering", "Data Science",        760,
  "Sales",       "Enterprise",         1120,
  "Sales",       "SMB",                 640,
  "Marketing",   "Brand",               540,
  "Marketing",   "Growth",              480,
  "Marketing",   "Content",             310,
  "Operations",  "Facilities",          420,
  "Operations",  "HR",                  380,
  "Operations",  "Finance",             350
)

dept_order <- leaves %>%
  group_by(department) %>%
  summarise(total = sum(budget), .groups = "drop") %>%
  arrange(desc(total)) %>%
  mutate(
    frac_end   = cumsum(total) / sum(total),
    frac_start = lag(frac_end, default = 0),
    fill_hex   = IMPRINT_PALETTE[seq_len(n())],
    label_ink  = ifelse(sapply(fill_hex, relative_luminance) > 0.4, "#1A1A17", "#FFFDF6"),
    department = factor(department, levels = department)
  )

leaves <- leaves %>%
  mutate(department = factor(department, levels = levels(dept_order$department))) %>%
  arrange(department, desc(budget)) %>%
  left_join(dept_order, by = "department") %>%
  group_by(department) %>%
  mutate(
    team_end   = frac_start + (cumsum(budget) / sum(budget)) * (frac_end - frac_start),
    team_start = lag(team_end, default = first(frac_start))
  ) %>%
  ungroup()

# Ring 1 (inner) — department totals. Label size scales down for narrow
# wedges so long department names never overflow their own slice.
dept_df <- dept_order %>%
  mutate(
    xmin  = 0.15, xmax = 0.95,
    mid   = (frac_start + frac_end) / 2,
    angle = wedge_label_angle(mid),
    span  = frac_end - frac_start,
    label_size = pmin(3.0, pmax(1.8, (span * 45) / sqrt(nchar(as.character(department)))))
  )

# Ring 2 (outer) — teams within each department. Wedges render at
# alpha = 0.55 over PAGE_BG, so label_ink must be recomputed from that
# composited color rather than reused from the solid inner-ring hue —
# otherwise the ink stays white even where the light-theme blend washes
# the wedge toward pastel.
team_df <- leaves %>%
  mutate(
    xmin       = 1.05, xmax = 1.95,
    mid        = (team_start + team_end) / 2,
    angle      = wedge_label_angle(mid),
    span       = team_end - team_start,
    show_label = span > 0.035,
    blended    = mapply(blend_hex, fill_hex, MoreArgs = list(bg_hex = PAGE_BG, alpha = 0.55)),
    label_ink  = ifelse(sapply(blended, relative_luminance) > 0.4, "#1A1A17", "#FFFDF6")
  )

plot_title <- "sunburst-basic · r · ggplot2 · anyplot.ai"
title_size <- round(12 * min(1, 67 / nchar(plot_title)))

# --- Plot -----------------------------------------------------------------
p <- ggplot() +
  geom_rect(
    data = dept_df,
    aes(xmin = xmin, xmax = xmax, ymin = frac_start, ymax = frac_end, fill = department),
    color = PAGE_BG, linewidth = 1.0
  ) +
  geom_rect(
    data = team_df,
    aes(xmin = xmin, xmax = xmax, ymin = team_start, ymax = team_end, fill = department),
    color = PAGE_BG, linewidth = 1.0, alpha = 0.55
  ) +
  geom_text(
    data = dept_df,
    aes(x = (xmin + xmax) / 2, y = mid, label = department, angle = angle,
        color = label_ink, size = label_size),
    fontface = "bold"
  ) +
  scale_size_identity() +
  geom_text(
    data = filter(team_df, show_label),
    aes(x = (xmin + xmax) / 2, y = mid, label = team, angle = angle, color = label_ink),
    size = 2.6
  ) +
  scale_fill_manual(
    values = setNames(dept_order$fill_hex, as.character(dept_order$department)),
    name   = "Department"
  ) +
  scale_color_identity() +
  coord_polar(theta = "y") +
  scale_x_continuous(limits = c(0, 2), expand = c(0, 0)) +
  scale_y_continuous(limits = c(0, 1), expand = c(0, 0)) +
  labs(title = plot_title) +
  theme_void(base_size = 8) +
  theme(
    plot.background   = element_rect(fill = PAGE_BG, color = PAGE_BG),
    panel.background  = element_rect(fill = PAGE_BG, color = NA),
    plot.title        = element_text(color = INK, size = title_size, face = "bold",
                                      hjust = 0.5, margin = margin(b = 10)),
    legend.title      = element_text(color = INK, size = 10),
    legend.text       = element_text(color = INK_SOFT, size = 8),
    legend.background = element_rect(fill = PAGE_BG, color = NA),
    legend.key        = element_rect(fill = PAGE_BG, color = NA),
    plot.margin       = margin(10, 10, 10, 10)
  )

# --- Save -------------------------------------------------------------------
ggsave(
  filename = sprintf("plot-%s.png", THEME),
  plot     = p,
  device   = ragg::agg_png,
  width    = 6,
  height   = 6,
  units    = "in",
  dpi      = 400
)
Runnable source as JSON, for any HTTP client: https://api.anyplot.ai/specs/sunburst-basic/ggplot2/code. Any spec id and library id listed in llms-full.txt fit the same URL shape; every URL below is complete and callable.
{
  "spec_id": "sunburst-basic",
  "language": "r",
  "library": "ggplot2",
  "page": "https://anyplot.ai/sunburst-basic/r/ggplot2",
  "hub": "https://anyplot.ai/sunburst-basic",
  "code_json": "https://api.anyplot.ai/specs/sunburst-basic/ggplot2/code",
  "spec_json": "https://api.anyplot.ai/specs/sunburst-basic",
  "render_light_png": "https://storage.googleapis.com/anyplot-images/plots/sunburst-basic/r/ggplot2/plot-light.png",
  "render_dark_png": "https://storage.googleapis.com/anyplot-images/plots/sunburst-basic/r/ggplot2/plot-dark.png",
  "quality_score": 91.0,
  "license": "MIT",
  "guide": "https://anyplot.ai/llms.txt"
}
Part of Basic Sunburst Chart on anyplot.ai.