The same plot in 14 other libraries — JavaScript: Chart.js, D3.js, Highcharts, MUI X Charts; Python: Altair, Bokeh, lets-plot, Matplotlib, Plotly, plotnine, Pygal, Seaborn; R: ggplot2; Julia: Makie.jl. Compare all 15 side by side: Basic Sunburst Chart in Python, R, Julia and JavaScript.
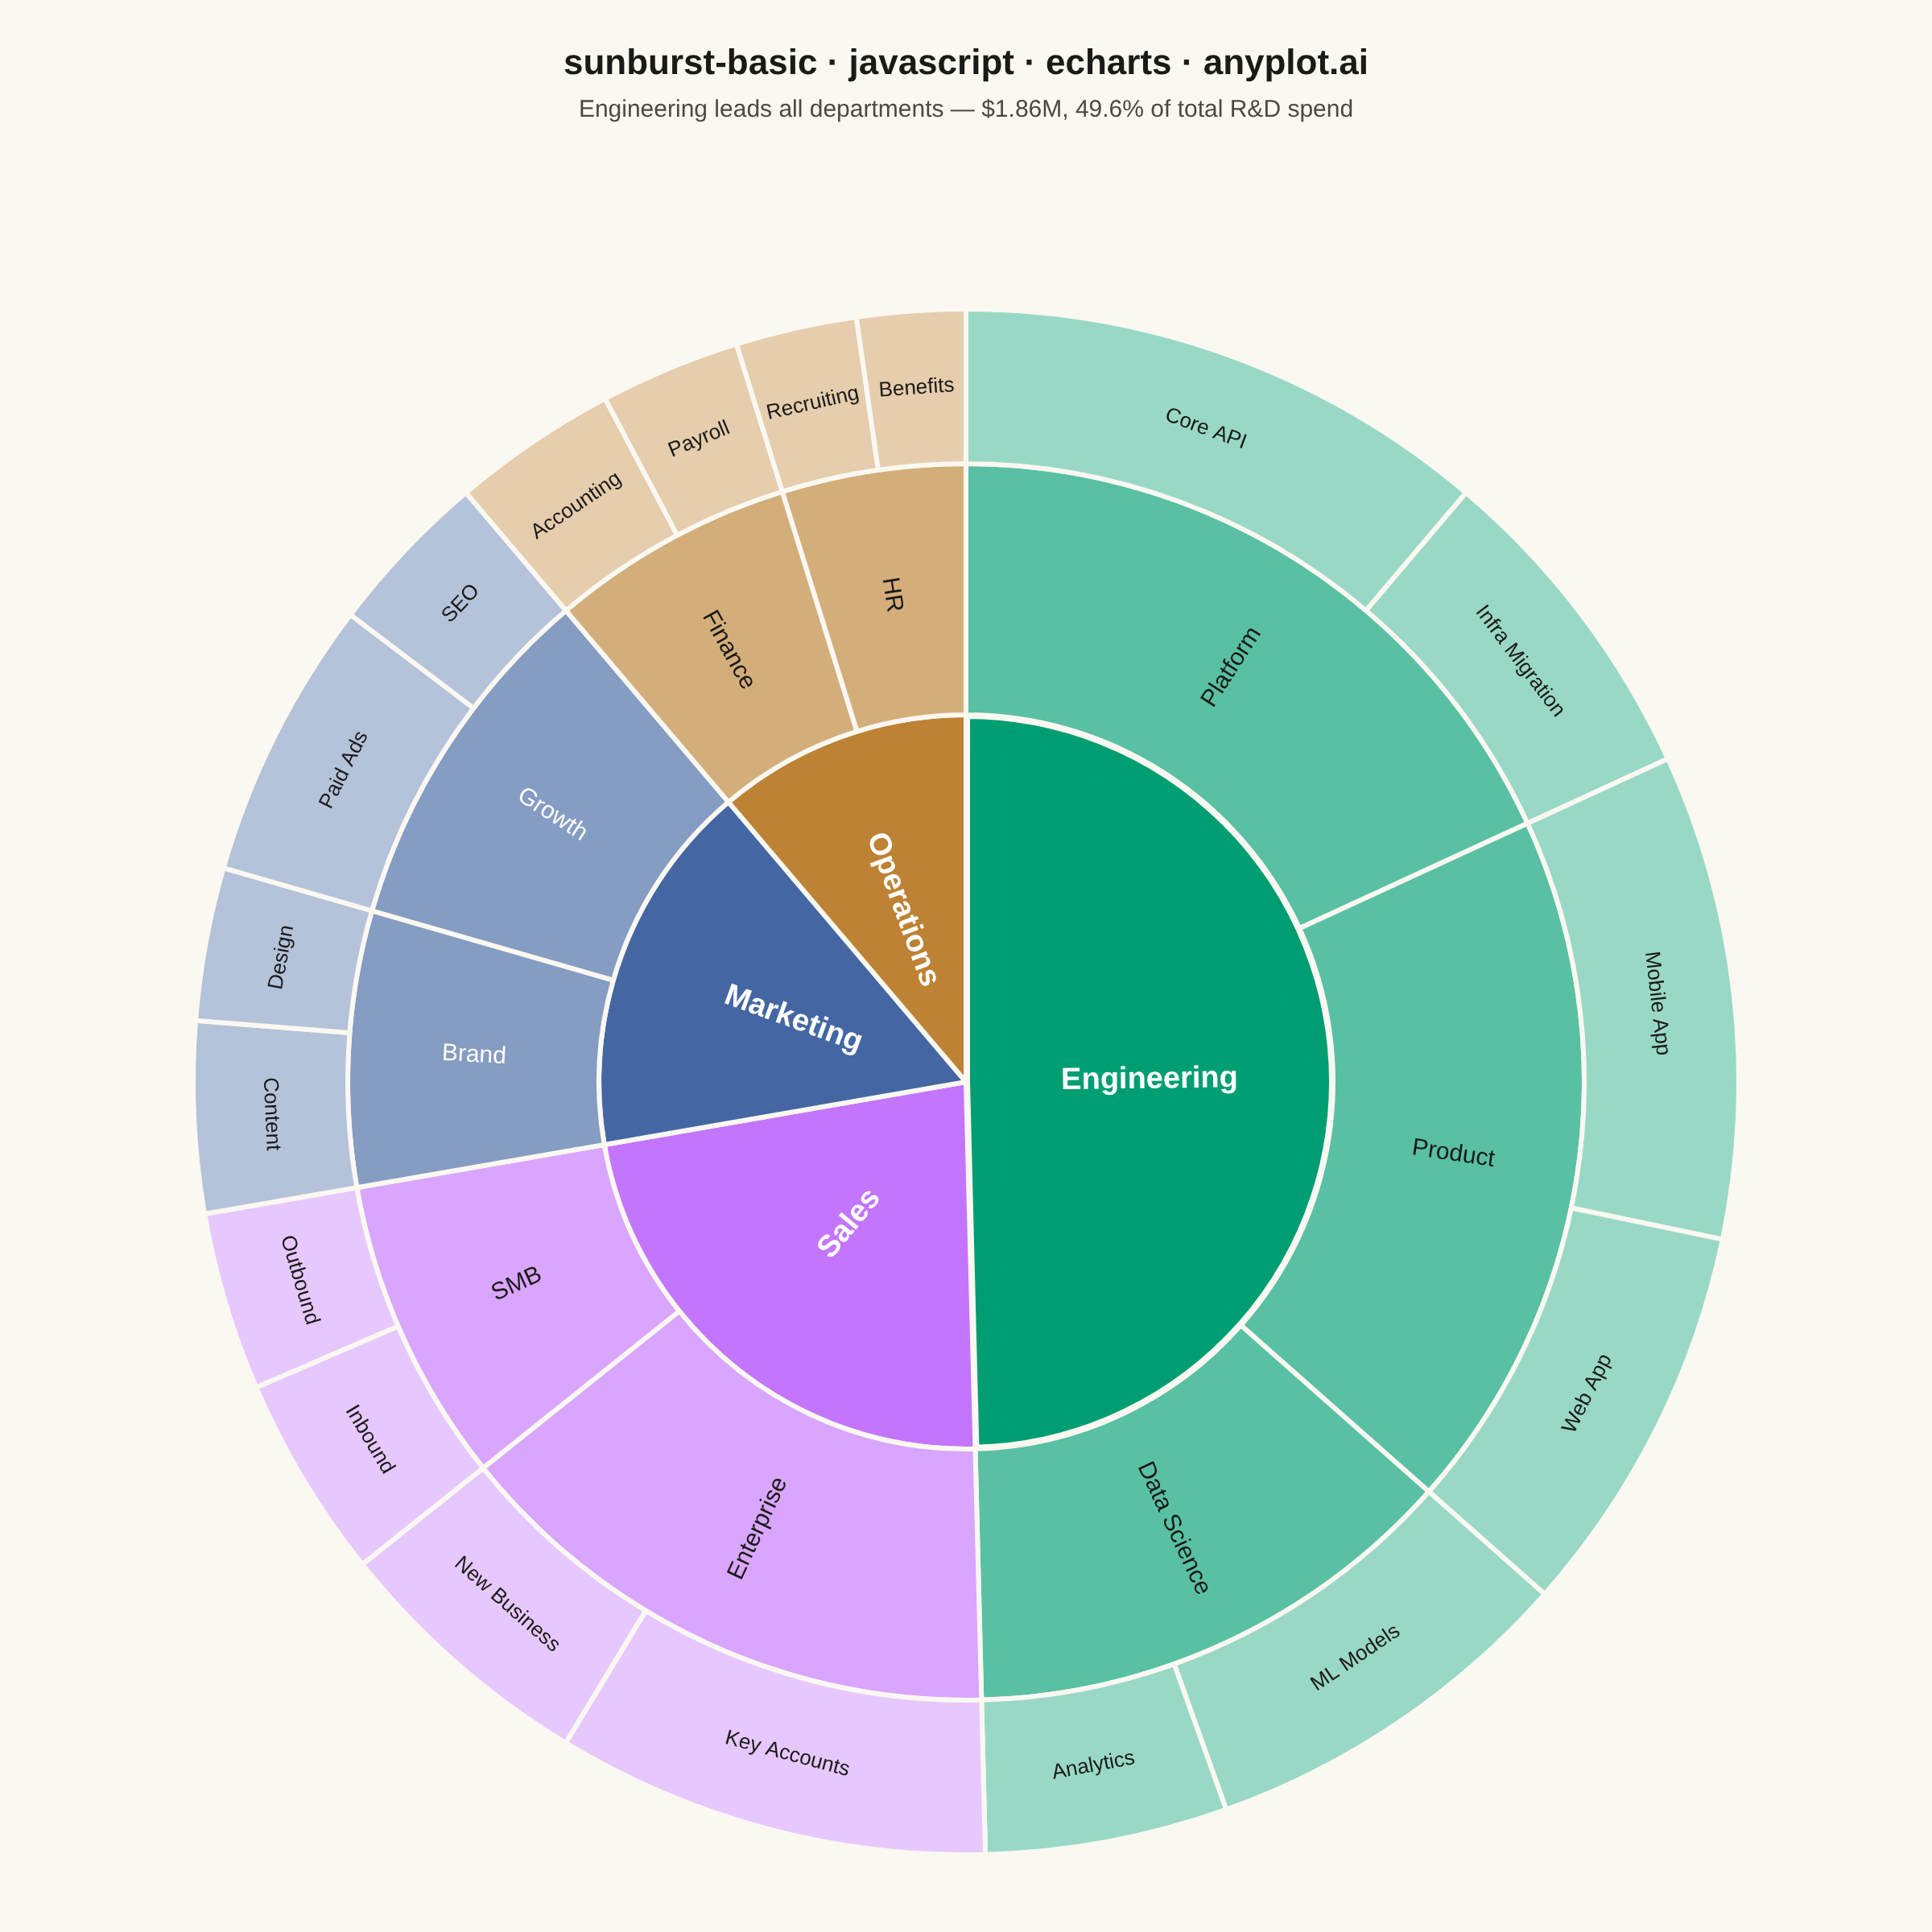
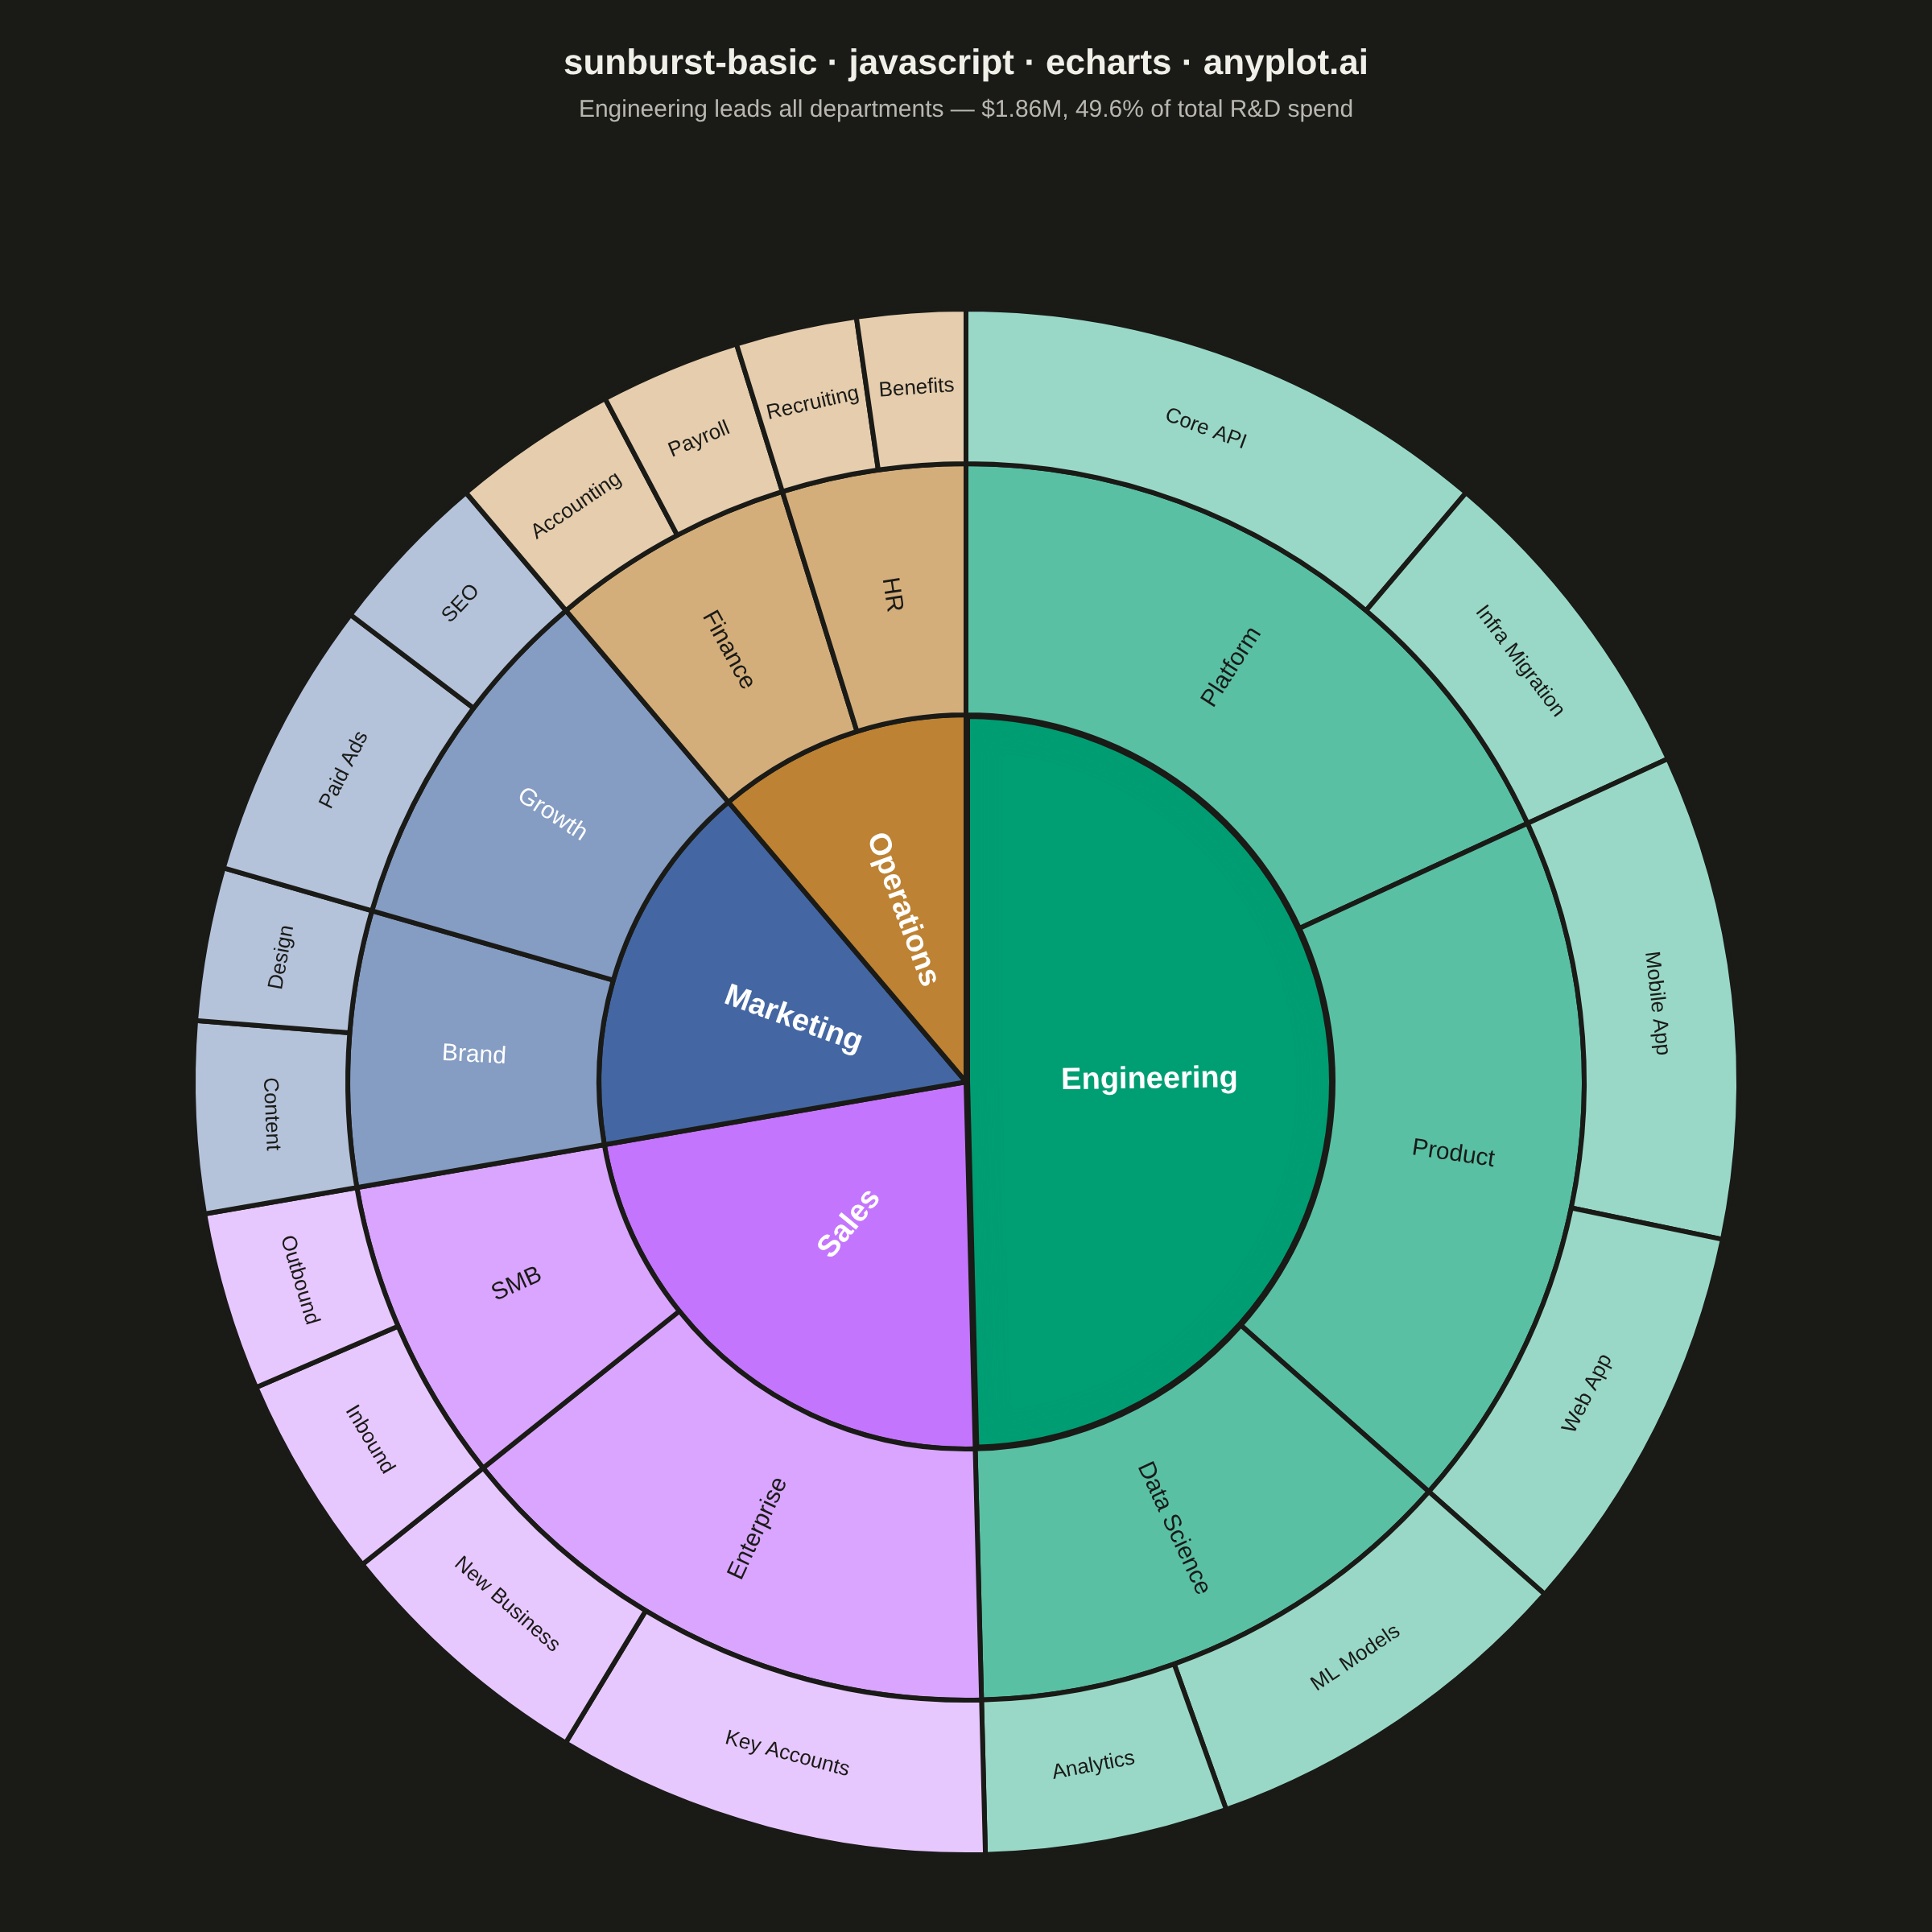
A sunburst chart displays hierarchical data as concentric rings, where each ring represents a level in the hierarchy. Inner rings show parent categories while outer rings show their children, with segment angles proportional to values. This radial visualization excels at revealing hierarchical structures and part-to-whole relationships across multiple levels simultaneously.
// anyplot.ai
// sunburst-basic: Basic Sunburst Chart
// Library: echarts 6.1.0 | JavaScript 22.23.1
// Quality: 91/100 | Created: 2026-07-26

//# anyplot-orientation: square
const t = window.ANYPLOT_TOKENS;

// --- Data: R&D budget allocation, department -> team -> project ($k) -------
// Each branch carries its own radial tint hierarchy (root / team / project)
// plus a WCAG-luminance-picked label color per tint, precomputed offline from
// the Imprint palette so the ring color + text pairing stays a flat literal.
const branches = [
  {
    name: "Engineering",
    fill: t.palette[0], text: "#FFFFFF",
    teamFill: "#59C0A4", teamText: "#1A1A17",
    projectFill: "#99D8C7", projectText: "#1A1A17",
    teams: [
      { name: "Platform", projects: [["Core API", 420], ["Infra Migration", 260]] },
      { name: "Product", projects: [["Mobile App", 380], ["Web App", 310]] },
      { name: "Data Science", projects: [["ML Models", 300], ["Analytics", 190]] },
    ],
  },
  {
    name: "Sales",
    fill: t.palette[1], text: "#FFFFFF",
    teamFill: "#D9A5FE", teamText: "#1A1A17",
    projectFill: "#E7C8FE", projectText: "#1A1A17",
    teams: [
      { name: "Enterprise", projects: [["Key Accounts", 340], ["New Business", 210]] },
      { name: "SMB", projects: [["Inbound", 160], ["Outbound", 140]] },
    ],
  },
  {
    name: "Marketing",
    fill: t.palette[2], text: "#FFFFFF",
    teamFill: "#859CC3", teamText: "#FFFFFF",
    projectFill: "#B4C2DA", projectText: "#1A1A17",
    teams: [
      { name: "Brand", projects: [["Content", 150], ["Design", 120]] },
      { name: "Growth", projects: [["Paid Ads", 220], ["SEO", 130]] },
    ],
  },
  {
    name: "Operations",
    fill: t.palette[3], text: "#FFFFFF",
    teamFill: "#D4AE7A", teamText: "#1A1A17",
    projectFill: "#E5CDAD", projectText: "#1A1A17",
    teams: [
      { name: "Finance", projects: [["Accounting", 130], ["Payroll", 110]] },
      { name: "HR", projects: [["Recruiting", 95], ["Benefits", 85]] },
    ],
  },
];

// Engineering is the single largest department ($1.86M, 49.6% of the $3.75M
// total) — call it out with a subtitle and a glowing root wedge so the chart
// surfaces that insight instead of leaving it implicit in the radial sizing.
const data = branches.map((branch) => {
  const isLargest = branch.name === "Engineering";
  return {
    name: branch.name,
    itemStyle: {
      color: branch.fill,
      borderWidth: isLargest ? 5 : 3,
      shadowBlur: isLargest ? 18 : 0,
      shadowColor: isLargest ? "rgba(0, 158, 115, 0.45)" : "transparent",
    },
    label: { color: branch.text },
    children: branch.teams.map((team) => ({
      name: team.name,
      itemStyle: { color: branch.teamFill },
      label: { color: branch.teamText },
      children: team.projects.map(([name, budget]) => ({
        name,
        value: budget,
        itemStyle: { color: branch.projectFill },
        label: { color: branch.projectText },
      })),
    })),
  };
});

// --- Init ---------------------------------------------------------------
const chart = echarts.init(document.getElementById("container"));

// --- Option ---------------------------------------------------------------
chart.setOption({
  animation: false,
  backgroundColor: "transparent",
  title: {
    text: "sunburst-basic · javascript · echarts · anyplot.ai",
    subtext: "Engineering leads all departments — $1.86M, 49.6% of total R&D spend",
    left: "center",
    top: 24,
    textStyle: { color: t.ink, fontSize: 22 },
    subtextStyle: { color: t.inkSoft, fontSize: 15 },
  },
  tooltip: { formatter: (p) => `${p.name}: $${p.value}k` },
  series: [
    {
      type: "sunburst",
      center: ["50%", "56%"],
      sort: null,
      emphasis: { focus: "ancestor" },
      itemStyle: { borderColor: t.pageBg, borderWidth: 3 },
      label: { rotate: "radial", overflow: "truncate" },
      levels: [
        {},
        { r0: 0, r: "38%", label: { fontSize: 19, fontWeight: "bold" } },
        { r0: "38%", r: "64%", label: { fontSize: 15 } },
        { r0: "64%", r: "80%", label: { fontSize: 13, rotate: "tangential" } },
      ],
      data,
    },
  ],
});
Runnable source as JSON, for any HTTP client: https://api.anyplot.ai/specs/sunburst-basic/echarts/code. Any spec id and library id listed in llms-full.txt fit the same URL shape; every URL below is complete and callable.
{
  "spec_id": "sunburst-basic",
  "language": "javascript",
  "library": "echarts",
  "page": "https://anyplot.ai/sunburst-basic/javascript/echarts",
  "hub": "https://anyplot.ai/sunburst-basic",
  "code_json": "https://api.anyplot.ai/specs/sunburst-basic/echarts/code",
  "spec_json": "https://api.anyplot.ai/specs/sunburst-basic",
  "render_light_png": "https://storage.googleapis.com/anyplot-images/plots/sunburst-basic/javascript/echarts/plot-light.png",
  "render_dark_png": "https://storage.googleapis.com/anyplot-images/plots/sunburst-basic/javascript/echarts/plot-dark.png",
  "interactive_light_html": "https://storage.googleapis.com/anyplot-images/plots/sunburst-basic/javascript/echarts/plot-light.html",
  "interactive_dark_html": "https://storage.googleapis.com/anyplot-images/plots/sunburst-basic/javascript/echarts/plot-dark.html",
  "quality_score": 91.0,
  "license": "MIT",
  "guide": "https://anyplot.ai/llms.txt"
}
Part of Basic Sunburst Chart on anyplot.ai.