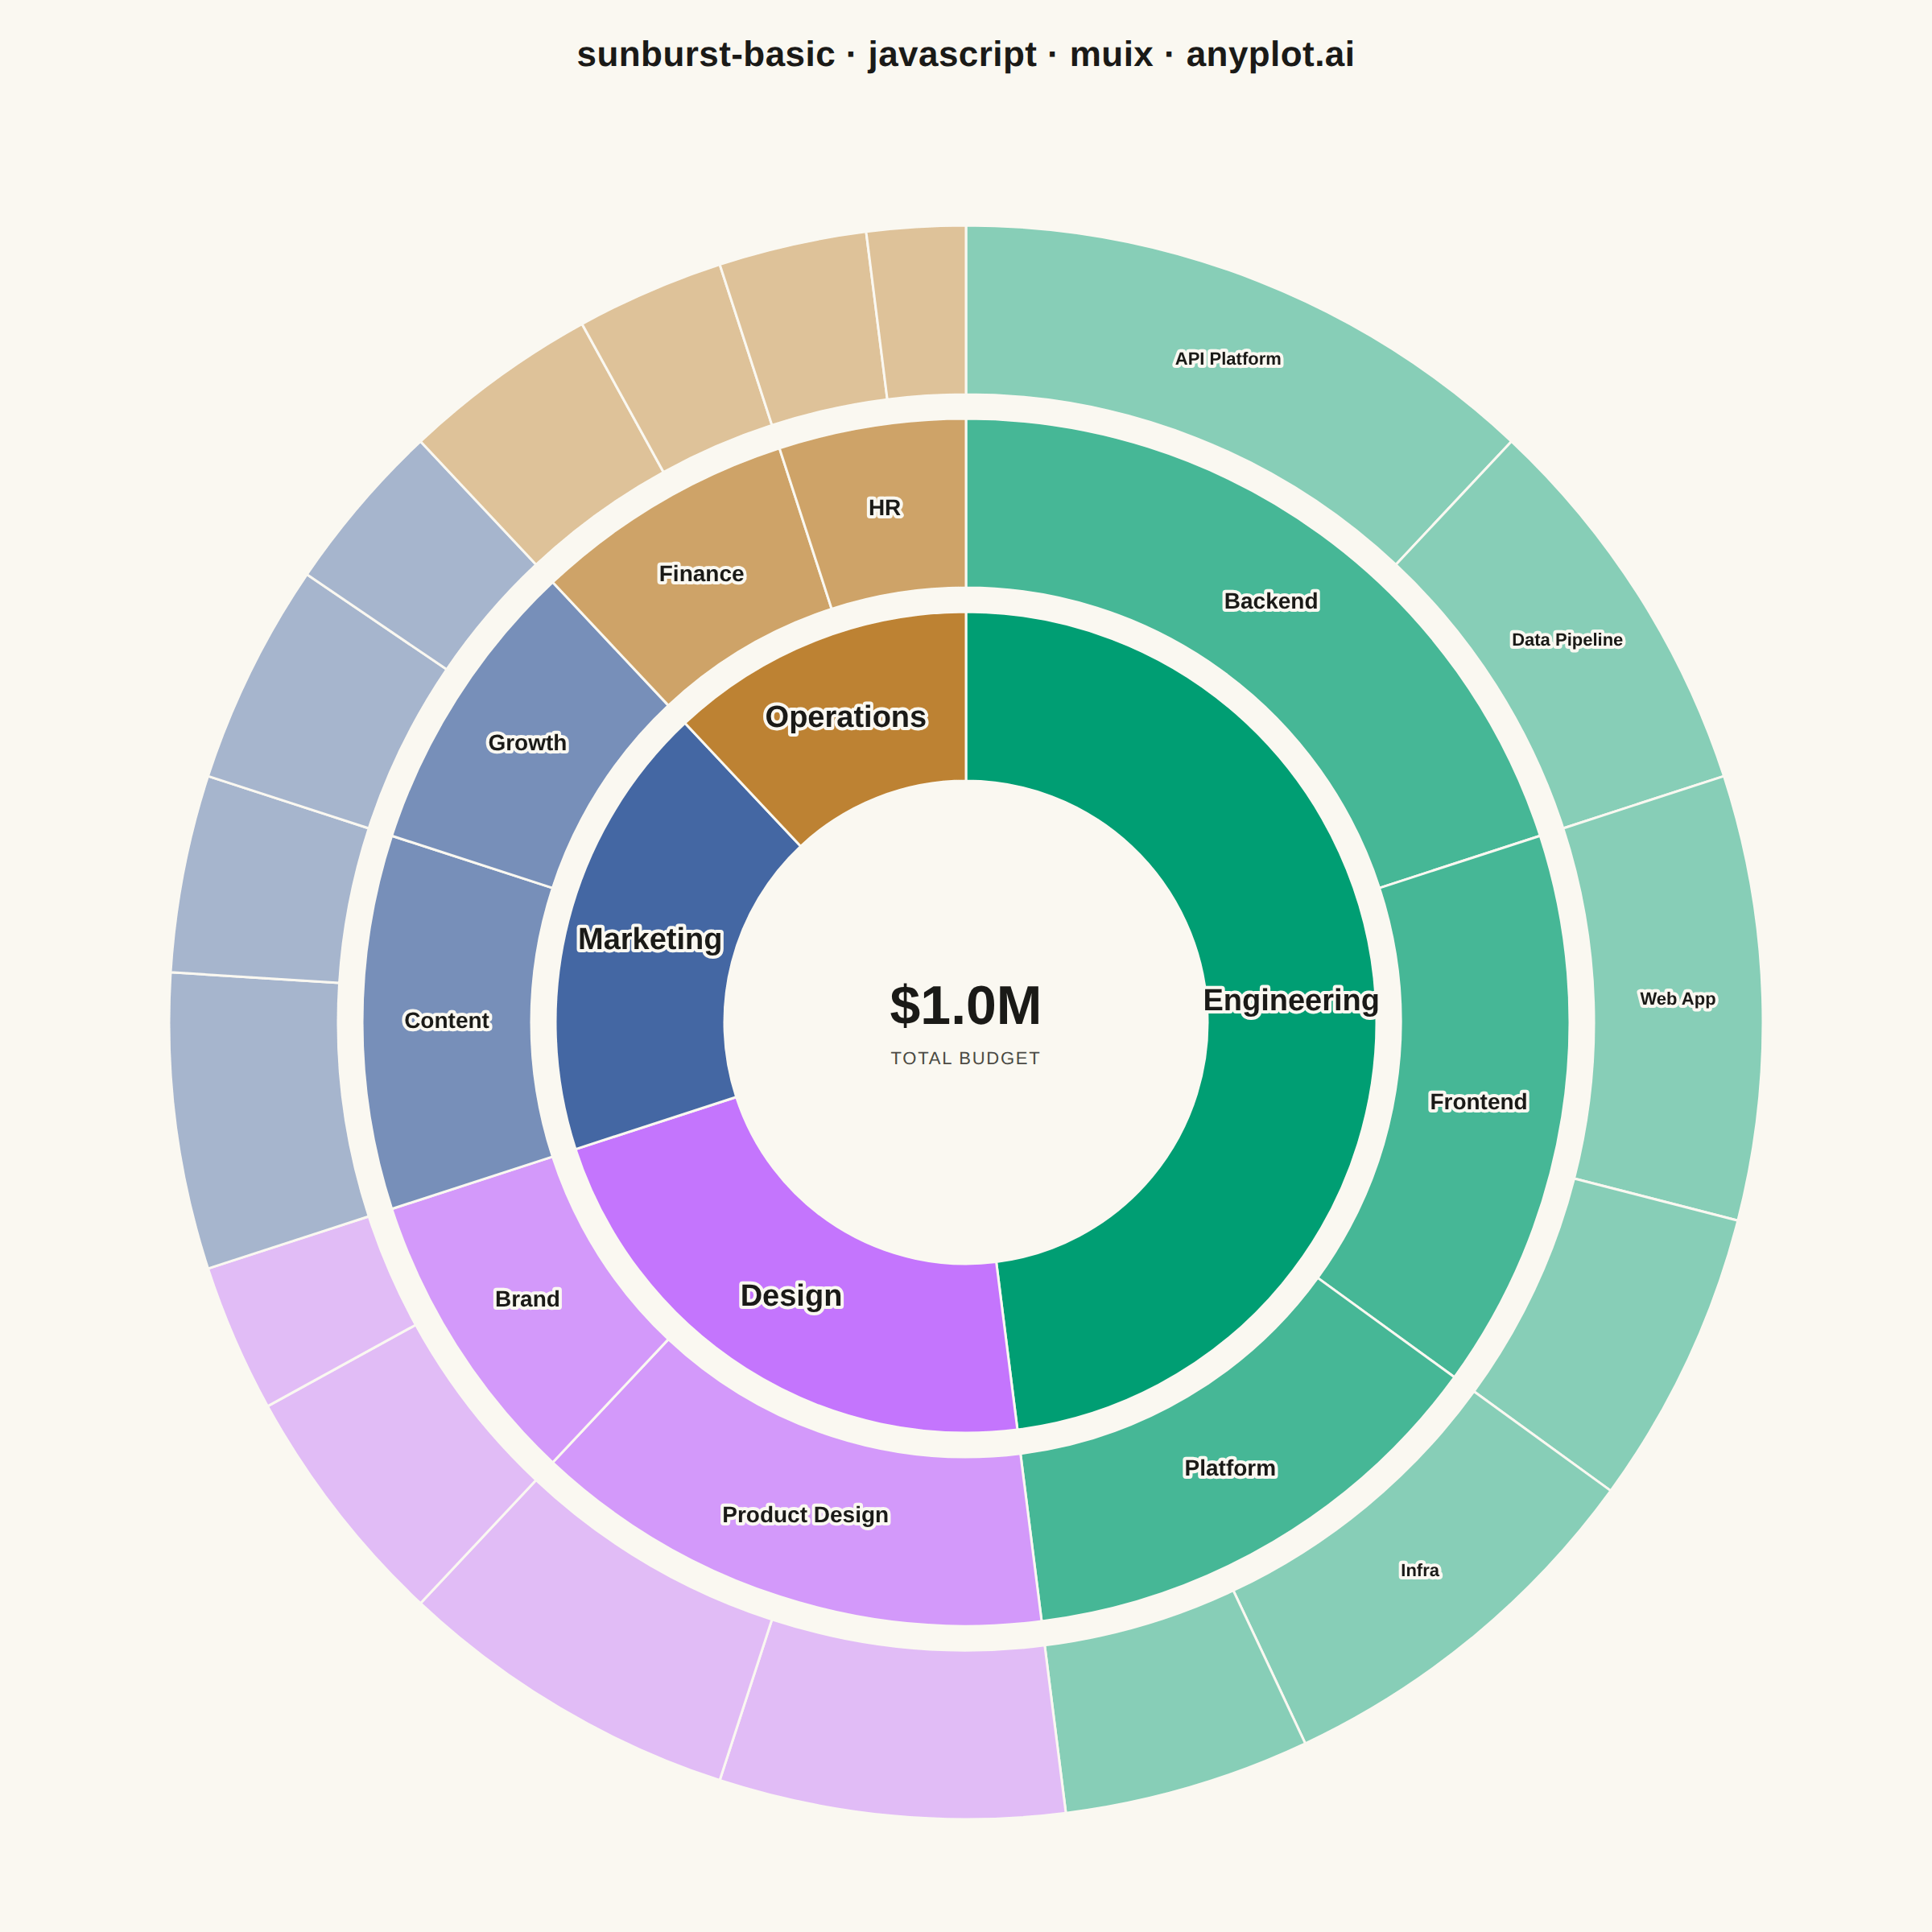
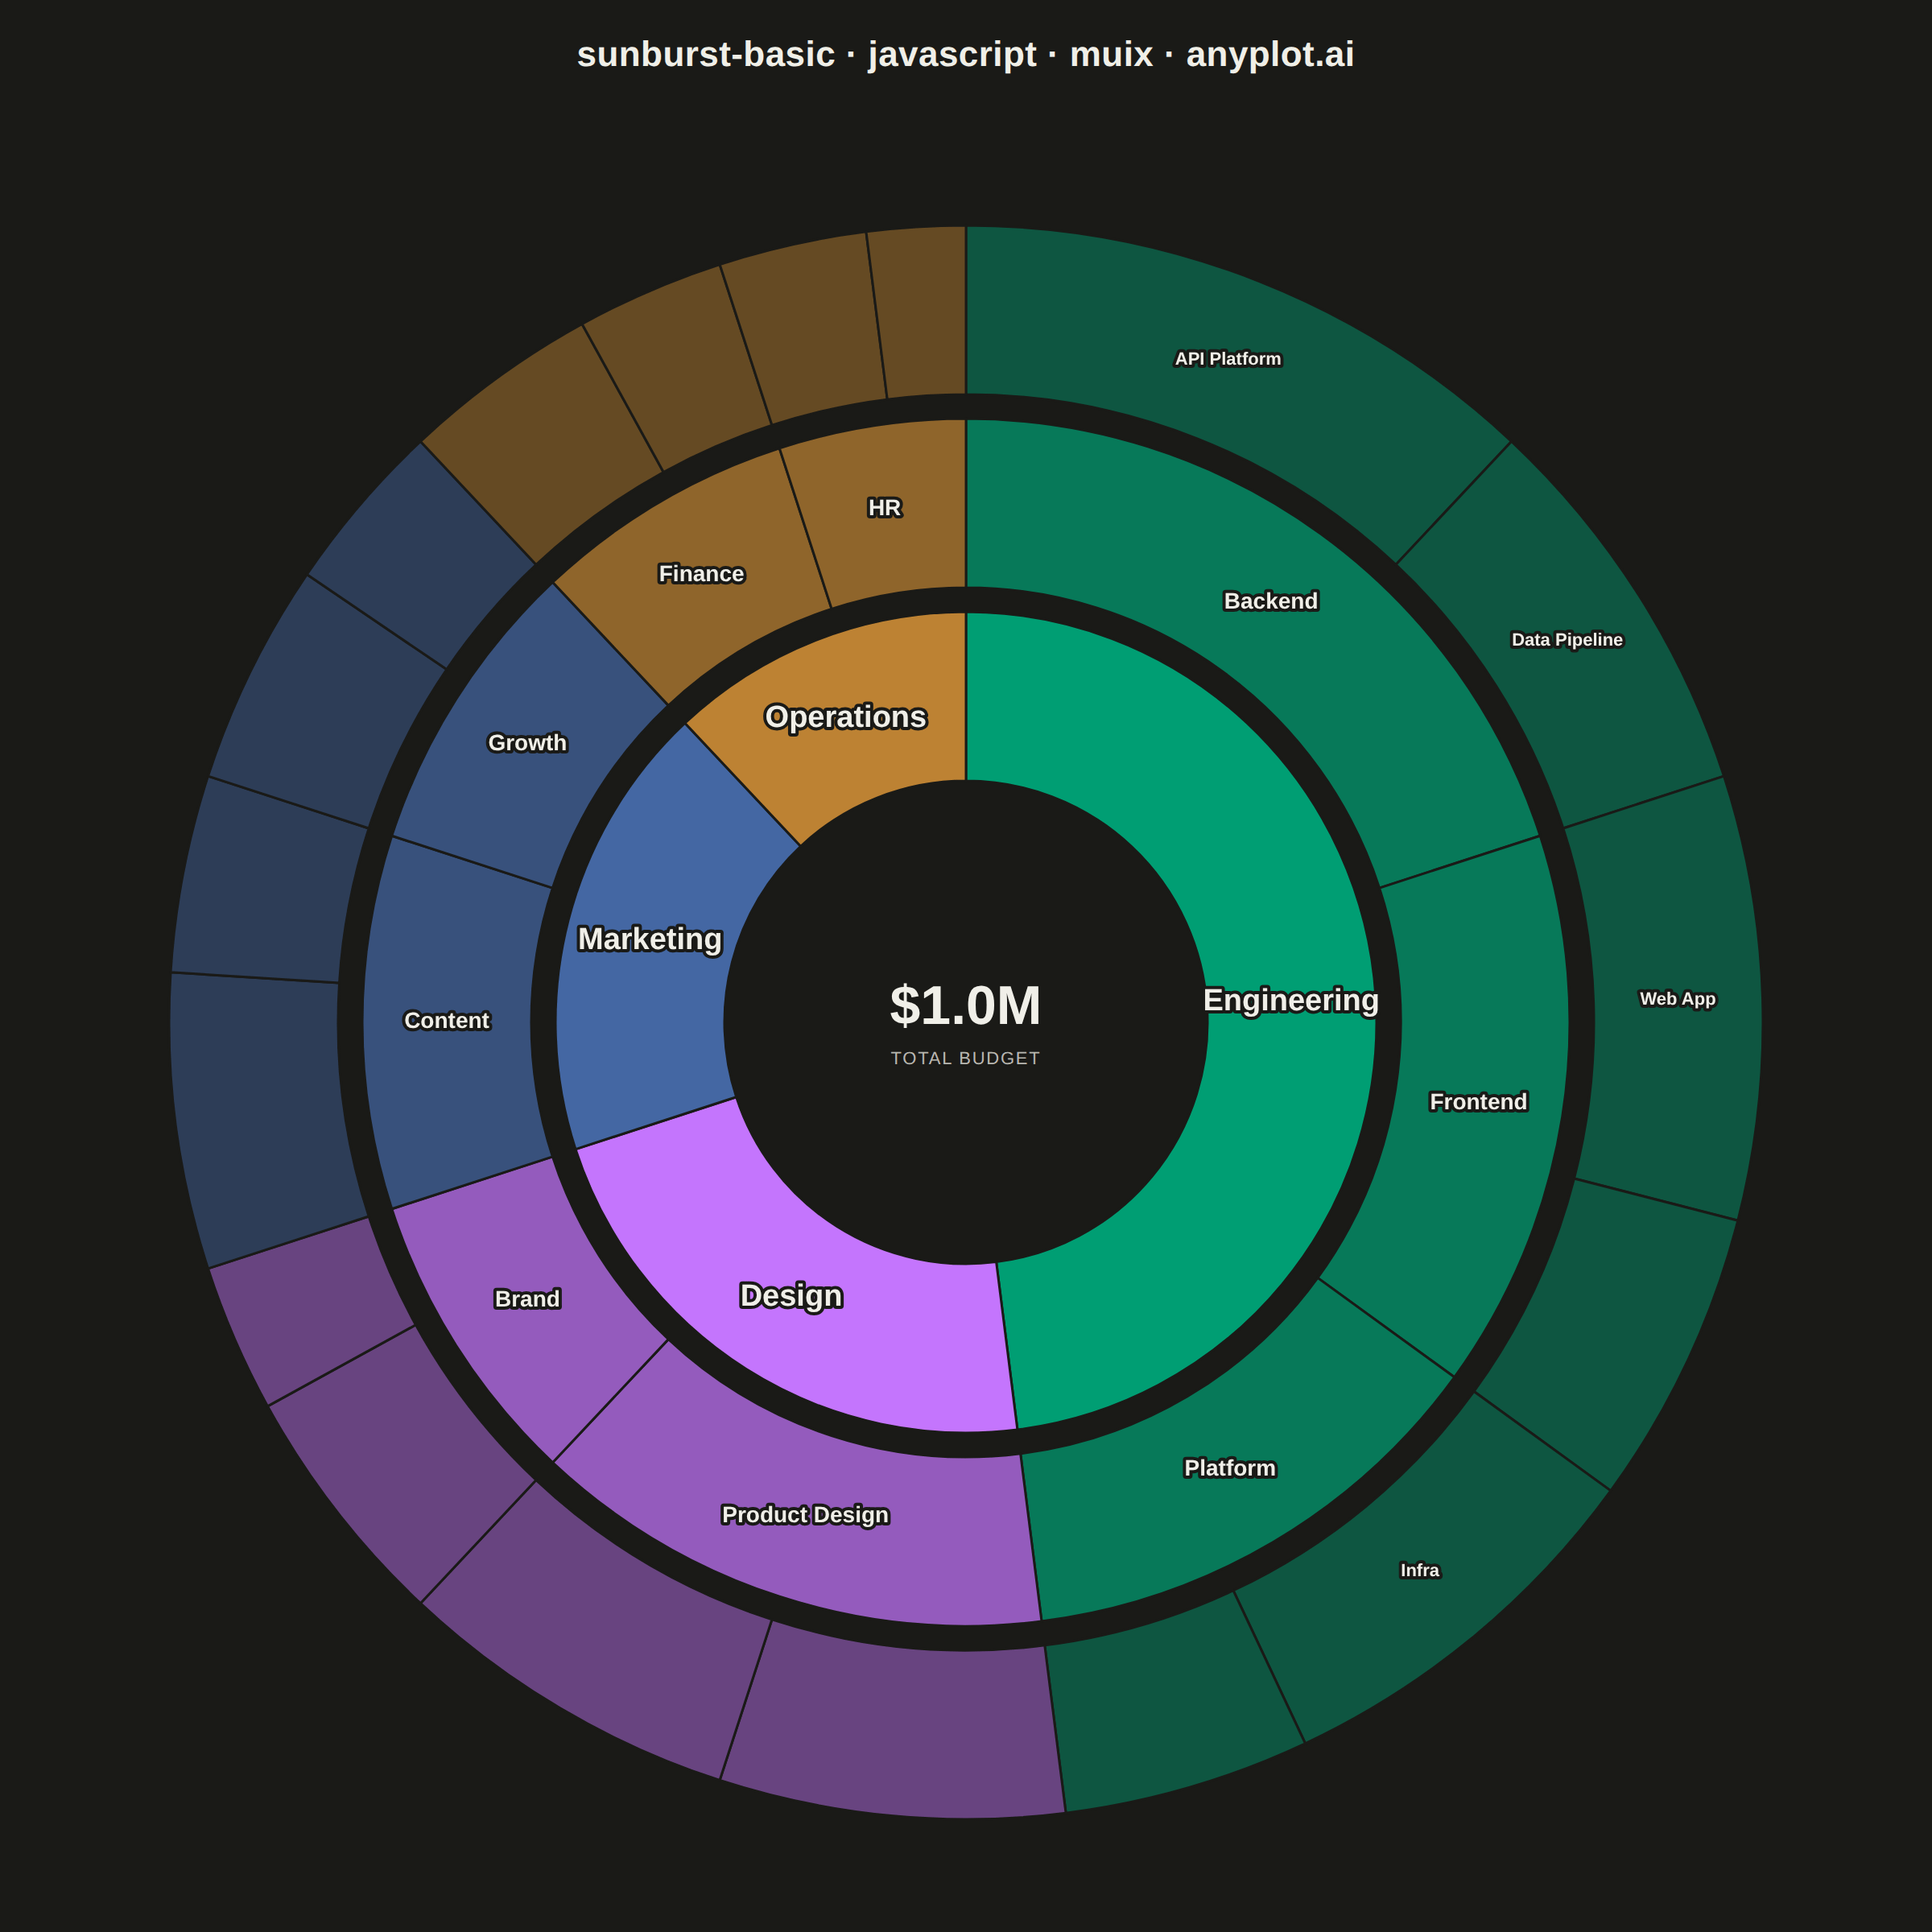
The same plot in 14 other libraries — JavaScript: Chart.js, D3.js, Apache ECharts, Highcharts; Python: Altair, Bokeh, lets-plot, Matplotlib, Plotly, plotnine, Pygal, Seaborn; R: ggplot2; Julia: Makie.jl. Compare all 15 side by side: Basic Sunburst Chart in Python, R, Julia and JavaScript.
A sunburst chart displays hierarchical data as concentric rings, where each ring represents a level in the hierarchy. Inner rings show parent categories while outer rings show their children, with segment angles proportional to values. This radial visualization excels at revealing hierarchical structures and part-to-whole relationships across multiple levels simultaneously.
// anyplot.ai
// sunburst-basic: Basic Sunburst Chart
// Library: muix 7.29.1 | JavaScript 22.23.1
// Quality: 91/100 | Created: 2026-07-26
//# anyplot-orientation: square

import { PieChart } from "@mui/x-charts/PieChart";

const t = window.ANYPLOT_TOKENS;

// Engineering org budget, three hierarchy levels: department -> team -> project.
// Each level's values sum to the same $1,000K total so the three concentric
// rings share one d3 pie layout basis and their arcs stay angularly aligned —
// every child ring exactly spans its parent's angular range.
const DEPARTMENTS = [
  { id: "eng", label: "Engineering", value: 480 },
  { id: "des", label: "Design", value: 220 },
  { id: "mkt", label: "Marketing", value: 180 },
  { id: "ops", label: "Operations", value: 120 },
];

const TEAMS = [
  { id: "backend", label: "Backend", value: 200, dept: "eng" },
  { id: "frontend", label: "Frontend", value: 150, dept: "eng" },
  { id: "platform", label: "Platform", value: 130, dept: "eng" },
  { id: "product-design", label: "Product Design", value: 140, dept: "des" },
  { id: "brand", label: "Brand", value: 80, dept: "des" },
  { id: "content", label: "Content", value: 100, dept: "mkt" },
  { id: "growth", label: "Growth", value: 80, dept: "mkt" },
  { id: "finance", label: "Finance", value: 70, dept: "ops" },
  { id: "hr", label: "HR", value: 50, dept: "ops" },
];

const PROJECTS = [
  { id: "api-platform", label: "API Platform", value: 120, team: "backend" },
  { id: "data-pipeline", label: "Data Pipeline", value: 80, team: "backend" },
  { id: "web-app", label: "Web App", value: 90, team: "frontend" },
  { id: "mobile-app", label: "Mobile App", value: 60, team: "frontend" },
  { id: "infra", label: "Infra", value: 80, team: "platform" },
  { id: "devops", label: "DevOps", value: 50, team: "platform" },
  { id: "ux-research", label: "UX Research", value: 70, team: "product-design" },
  { id: "visual-design", label: "Visual Design", value: 70, team: "product-design" },
  { id: "identity", label: "Identity", value: 50, team: "brand" },
  { id: "campaigns", label: "Campaigns", value: 30, team: "brand" },
  { id: "blog", label: "Blog", value: 60, team: "content" },
  { id: "social", label: "Social", value: 40, team: "content" },
  { id: "seo", label: "SEO", value: 45, team: "growth" },
  { id: "paid-ads", label: "Paid Ads", value: 35, team: "growth" },
  { id: "accounting", label: "Accounting", value: 40, team: "finance" },
  { id: "payroll", label: "Payroll", value: 30, team: "finance" },
  { id: "recruiting", label: "Recruiting", value: 30, team: "hr" },
  { id: "benefits", label: "Benefits", value: 20, team: "hr" },
];

// Department -> Imprint hue (first series is always brand green).
const DEPT_COLOR = {
  eng: t.palette[0],
  des: t.palette[1],
  mkt: t.palette[2],
  ops: t.palette[3],
};

// Same hue per branch across all three rings; only opacity steps down per
// ring depth, so a department keeps one identity while its descendants read
// as clearly nested within it (Imprint identity stays theme-invariant — the
// page background showing through the translucent fill is what shifts per theme).
const hexToRgb = (hex) => [
  parseInt(hex.slice(1, 3), 16),
  parseInt(hex.slice(3, 5), 16),
  parseInt(hex.slice(5, 7), 16),
];
const tint = (hex, alpha) => {
  const [r, g, b] = hexToRgb(hex);
  return `rgba(${r}, ${g}, ${b}, ${alpha})`;
};

const currency = (item) => `$${item.value}K`;

const departmentData = DEPARTMENTS.map((d) => ({
  id: d.id,
  value: d.value,
  label: d.label,
  color: DEPT_COLOR[d.id],
}));

const teamData = TEAMS.map((team) => ({
  id: team.id,
  value: team.value,
  label: team.label,
  color: tint(DEPT_COLOR[team.dept], 0.72),
}));

const projectData = PROJECTS.map((project) => {
  const team = TEAMS.find((candidate) => candidate.id === project.team);
  return {
    id: project.id,
    value: project.value,
    label: project.label,
    color: tint(DEPT_COLOR[team.dept], 0.46),
  };
});

const TITLE = "sunburst-basic · javascript · muix · anyplot.ai";
const MARGIN = { top: 110, bottom: 40, left: 40, right: 40 };
const TOTAL_BUDGET = DEPARTMENTS.reduce((sum, d) => sum + d.value, 0);

export default function Chart() {
  const { width, height } = window.ANYPLOT_SIZE;
  const pieCy = (MARGIN.top + height - MARGIN.bottom) / 2;

  return (
    <div
      style={{
        position: "relative",
        width,
        height,
        fontFamily: "'Segoe UI', Roboto, 'Helvetica Neue', Arial, sans-serif",
      }}
    >
      {/* Title */}
      <div
        style={{
          position: "absolute",
          top: 20,
          left: 0,
          right: 0,
          textAlign: "center",
          fontSize: 22,
          fontWeight: 600,
          color: t.ink,
          letterSpacing: "0.01em",
          lineHeight: 1.3,
        }}
      >
        {TITLE}
      </div>

      {/* Sunburst — 3 concentric rings (department / team / project), each ring
          a PieChart series sharing one 1,000-unit total so arcs stay aligned. */}
      <PieChart
        width={width}
        height={height}
        skipAnimation
        margin={MARGIN}
        series={[
          {
            id: "departments",
            data: departmentData,
            innerRadius: 150,
            outerRadius: 255,
            arcLabel: "label",
            arcLabelMinAngle: 0,
            valueFormatter: currency,
          },
          {
            id: "teams",
            data: teamData,
            innerRadius: 270,
            outerRadius: 375,
            arcLabel: "label",
            arcLabelMinAngle: 15,
            valueFormatter: currency,
          },
          {
            id: "projects",
            data: projectData,
            innerRadius: 390,
            outerRadius: 495,
            arcLabel: "label",
            arcLabelMinAngle: 28,
            valueFormatter: currency,
          },
        ]}
        slotProps={{ legend: { hidden: true } }}
        sx={{
          "& .MuiPieArc-root": { stroke: t.pageBg, strokeWidth: 1.5 },
          "& .MuiPieArcLabel-root": {
            fill: t.ink,
            paintOrder: "stroke",
            stroke: t.pageBg,
            strokeWidth: 4,
            strokeLinejoin: "round",
          },
          "& .MuiPieArcLabel-series-departments": { fontSize: 19, fontWeight: 700 },
          "& .MuiPieArcLabel-series-teams": { fontSize: 14, fontWeight: 600 },
          "& .MuiPieArcLabel-series-projects": { fontSize: 11, fontWeight: 600 },
        }}
      />

      {/* Center overlay — total budget across all departments */}
      <div
        style={{
          position: "absolute",
          top: pieCy,
          left: width / 2,
          transform: "translate(-50%, -50%)",
          textAlign: "center",
          pointerEvents: "none",
          lineHeight: 1.2,
        }}
      >
        <div style={{ fontSize: 34, fontWeight: 700, color: t.ink }}>
          {`$${(TOTAL_BUDGET / 1000).toFixed(1)}M`}
        </div>
        <div
          style={{
            fontSize: 11,
            color: t.inkSoft,
            marginTop: 6,
            letterSpacing: "0.08em",
            textTransform: "uppercase",
          }}
        >
          Total Budget
        </div>
      </div>
    </div>
  );
}
Runnable source as JSON, for any HTTP client: https://api.anyplot.ai/specs/sunburst-basic/muix/code. Any spec id and library id listed in llms-full.txt fit the same URL shape; every URL below is complete and callable.
{
  "spec_id": "sunburst-basic",
  "language": "javascript",
  "library": "muix",
  "page": "https://anyplot.ai/sunburst-basic/javascript/muix",
  "hub": "https://anyplot.ai/sunburst-basic",
  "code_json": "https://api.anyplot.ai/specs/sunburst-basic/muix/code",
  "spec_json": "https://api.anyplot.ai/specs/sunburst-basic",
  "render_light_png": "https://storage.googleapis.com/anyplot-images/plots/sunburst-basic/javascript/muix/plot-light.png",
  "render_dark_png": "https://storage.googleapis.com/anyplot-images/plots/sunburst-basic/javascript/muix/plot-dark.png",
  "interactive_light_html": "https://storage.googleapis.com/anyplot-images/plots/sunburst-basic/javascript/muix/plot-light.html",
  "interactive_dark_html": "https://storage.googleapis.com/anyplot-images/plots/sunburst-basic/javascript/muix/plot-dark.html",
  "quality_score": 91.0,
  "license": "MIT",
  "guide": "https://anyplot.ai/llms.txt"
}
Part of Basic Sunburst Chart on anyplot.ai.