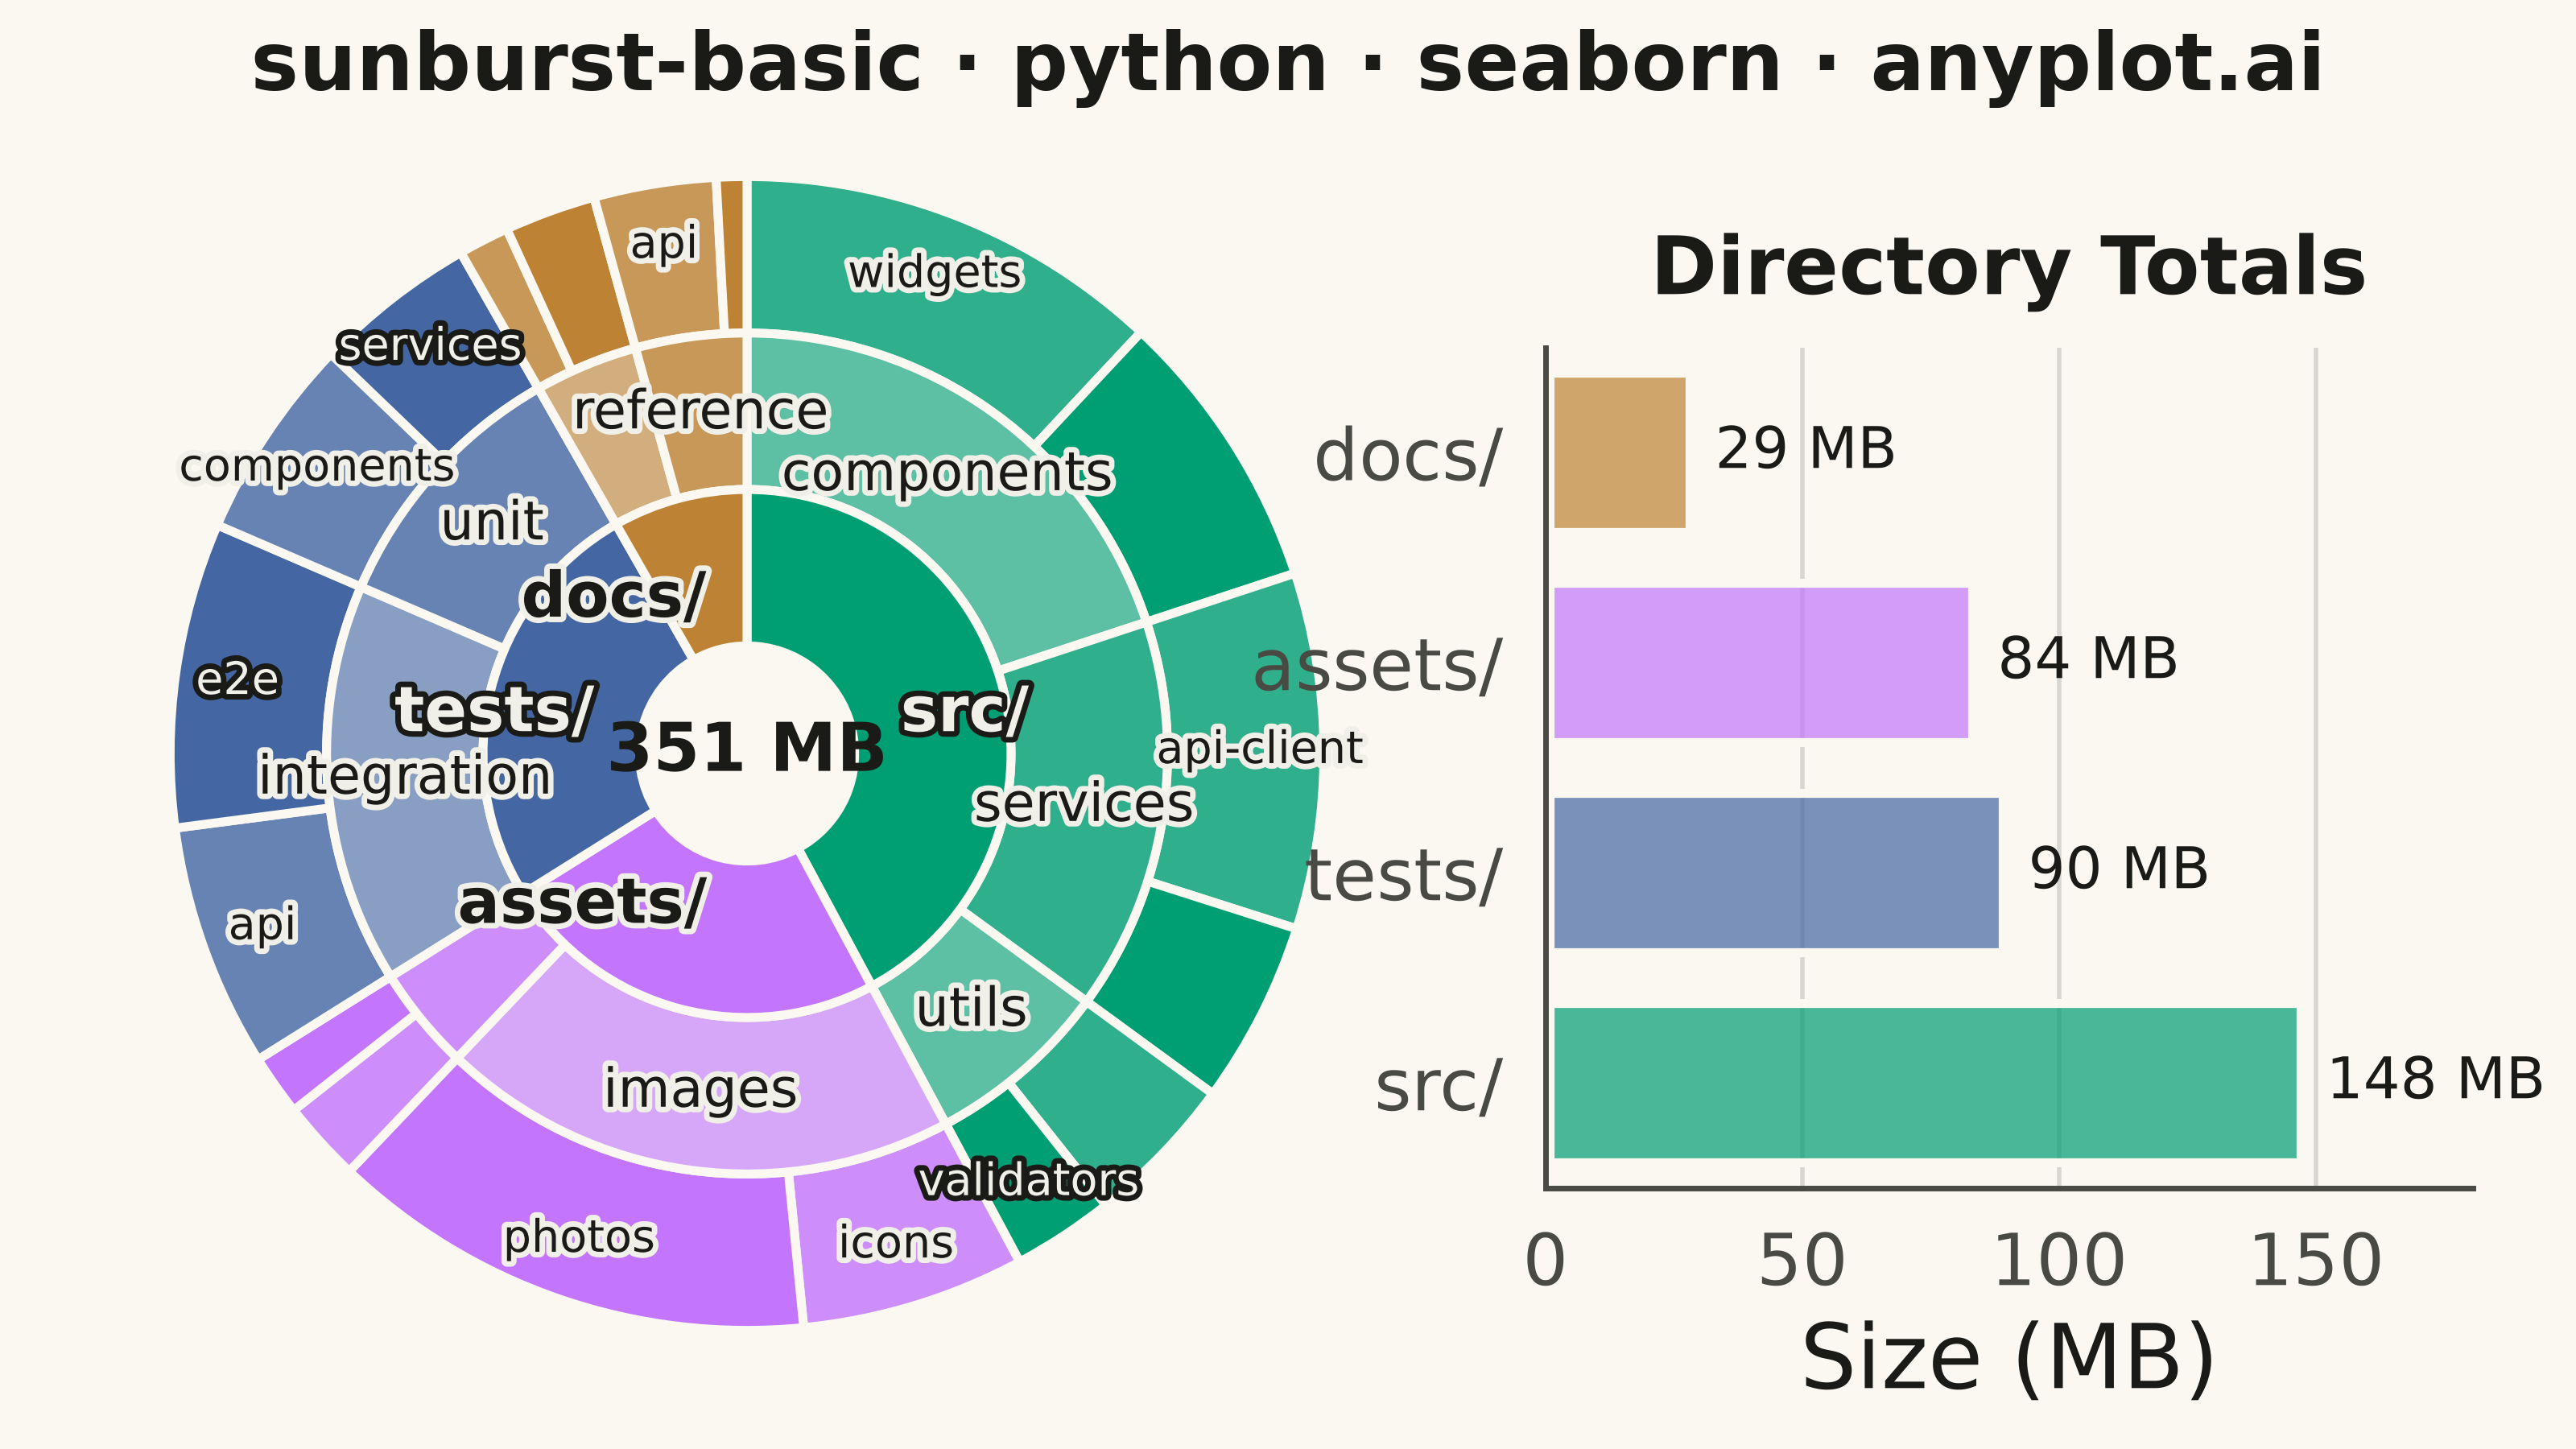
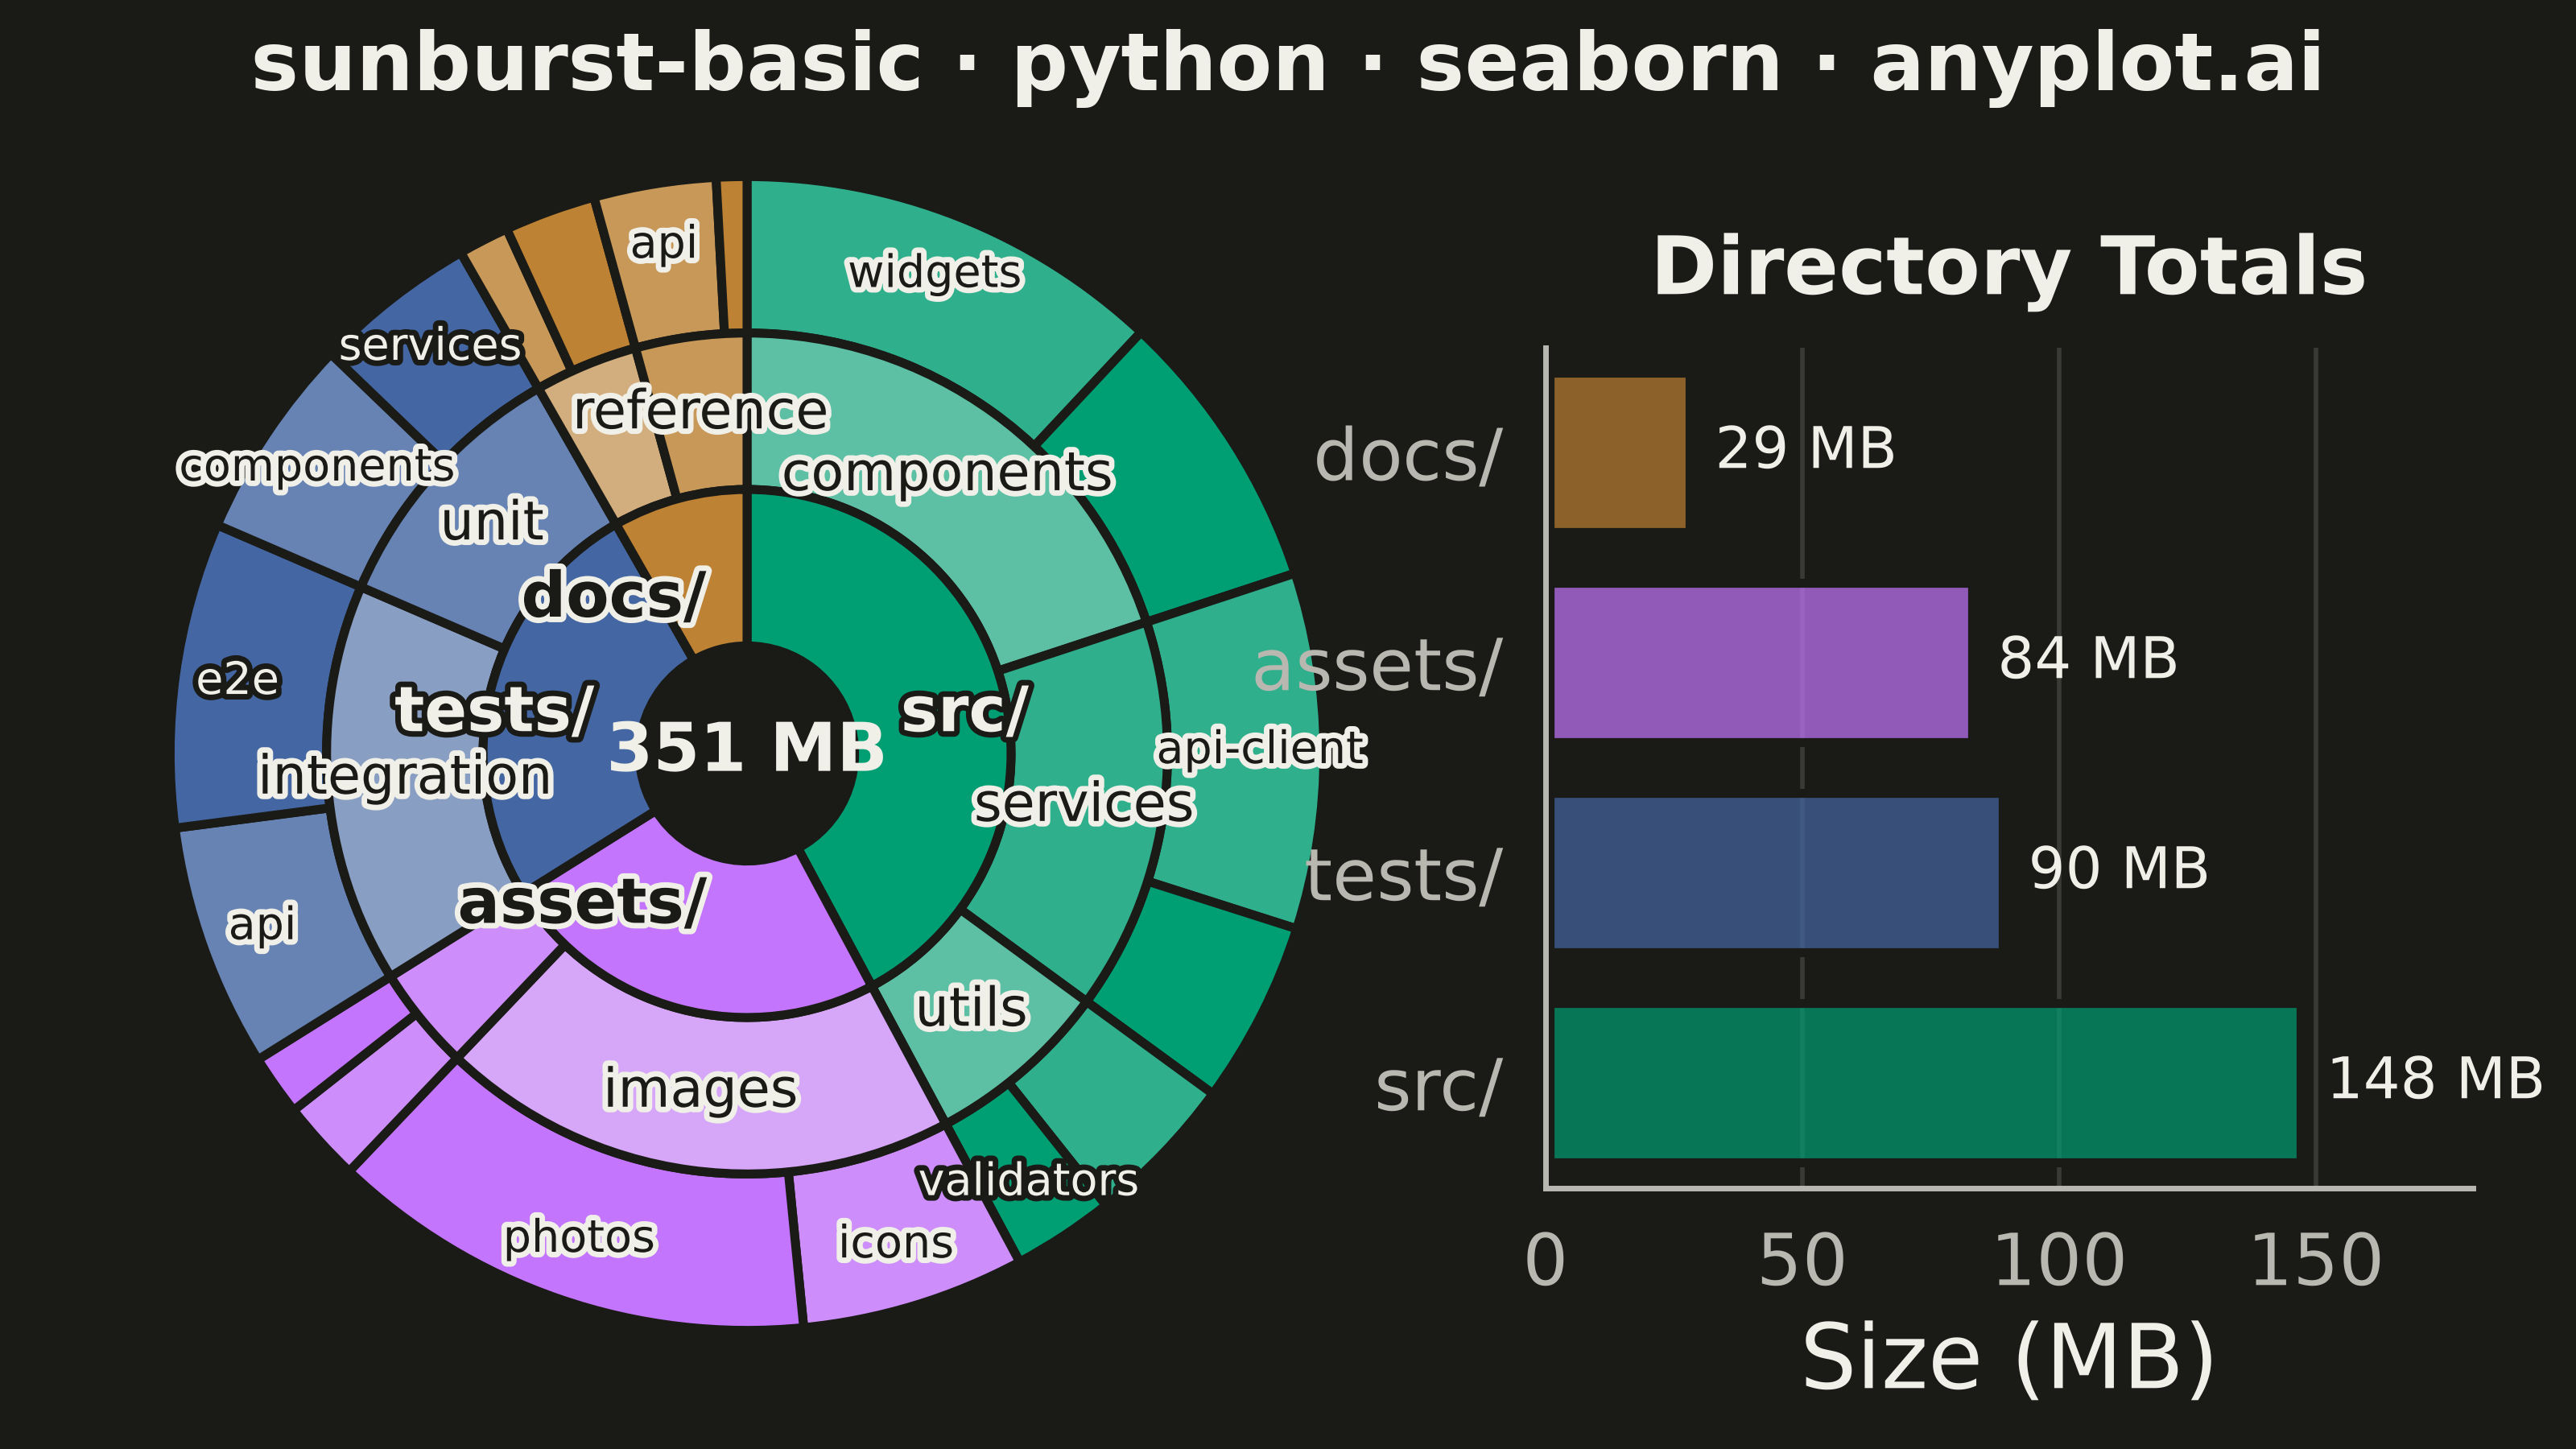
A sunburst chart displays hierarchical data as concentric rings, where each ring represents a level in the hierarchy. Inner rings show parent categories while outer rings show their children, with segment angles proportional to values. This radial visualization excels at revealing hierarchical structures and part-to-whole relationships across multiple levels simultaneously.
""" anyplot.ai
sunburst-basic: Basic Sunburst Chart
Library: seaborn 0.13.2 | Python 3.13.14
Quality: 84/100 | Updated: 2026-07-26
"""

import os

import matplotlib.colors as mcolors
import matplotlib.patheffects as path_effects
import matplotlib.pyplot as plt
import numpy as np
import pandas as pd
import seaborn as sns
import seaborn.objects as so


# Theme tokens
THEME = os.getenv("ANYPLOT_THEME", "light")
PAGE_BG = "#FAF8F1" if THEME == "light" else "#1A1A17"
ELEVATED_BG = "#FFFDF6" if THEME == "light" else "#242420"
INK = "#1A1A17" if THEME == "light" else "#F0EFE8"
INK_SOFT = "#4A4A44" if THEME == "light" else "#B8B7B0"

# Imprint palette — first series always #009E73; abstract folders get canonical order
IMPRINT = ["#009E73", "#C475FD", "#4467A3", "#BD8233"]

# Ring-label text colors, chosen per-wedge from the wedge's own fill luminance rather than
# a fixed theme token — wedge fills are data colors (branch tints), not page chrome, so their
# brightness varies independently of THEME and a single INK/INK_SOFT choice can't stay legible
# across the whole range from pale tints to fully-saturated branch colors.
WEDGE_LABEL_LIGHT = "#F0EFE8"  # for text on saturated/dark wedge fills
WEDGE_LABEL_DARK = "#1A1A17"  # for text on pale wedge tints


def _label_color(hex_color):
    r, g, b = mcolors.to_rgb(hex_color)
    luminance = 0.299 * r + 0.587 * g + 0.114 * b
    return WEDGE_LABEL_DARK if luminance > 0.5 else WEDGE_LABEL_LIGHT


def _label_halo(fill_color):
    # Opposite-tone halo so a label stays legible even where it overhangs its wedge
    # onto the page background — PAGE_BG flips between light/dark per THEME, but the
    # wedge-derived fill color above doesn't, so a plain fill can vanish into PAGE_BG.
    halo_color = WEDGE_LABEL_LIGHT if fill_color == WEDGE_LABEL_DARK else WEDGE_LABEL_DARK
    return [path_effects.withStroke(linewidth=2.5, foreground=halo_color)]


# Hierarchical data: a repository's disk usage (in MB)
# Level 1: top-level directories, Level 2: subdirectories, Level 3: leaf folders
data = {
    "src/": {
        "components/": {"widgets/": 42, "forms/": 28},
        "services/": {"api-client/": 35, "auth/": 18},
        "utils/": {"helpers/": 15, "validators/": 10},
    },
    "assets/": {"images/": {"icons/": 22, "photos/": 48}, "fonts/": {"sans/": 8, "serif/": 6}},
    "tests/": {"integration/": {"api/": 24, "e2e/": 30}, "unit/": {"components/": 20, "services/": 16}},
    "docs/": {"guides/": {"getting-started/": 5, "tutorials/": 9}, "reference/": {"api/": 12, "changelog/": 3}},
}

sns.set_theme(
    style="white",
    context="notebook",
    rc={
        "figure.facecolor": PAGE_BG,
        "axes.facecolor": PAGE_BG,
        "axes.edgecolor": INK_SOFT,
        "axes.labelcolor": INK,
        "text.color": INK,
        "xtick.color": INK_SOFT,
        "ytick.color": INK_SOFT,
        "grid.color": INK,
        "grid.alpha": 0.12,
        "legend.facecolor": ELEVATED_BG,
        "legend.edgecolor": INK_SOFT,
    },
)

# Build hierarchical structure and branch-coherent colors
level1_names, level1_values, level1_colors = [], [], []
level2_names, level2_values, level2_colors = [], [], []
level3_names, level3_values, level3_colors = [], [], []

for i, (top_dir, subdirs) in enumerate(data.items()):
    dir_total = sum(sum(leaves.values()) for leaves in subdirs.values())
    level1_names.append(top_dir)
    level1_values.append(dir_total)
    base_color = IMPRINT[i % len(IMPRINT)]
    level1_colors.append(base_color)

    # Light tints of the branch color carry the parent/child relationship visually
    branch_tints = sns.light_palette(base_color, n_colors=6)

    for j, (subdir, leaves) in enumerate(subdirs.items()):
        subdir_total = sum(leaves.values())
        level2_names.append(subdir)
        level2_values.append(subdir_total)
        level2_colors.append(branch_tints[3 + j % 2])

        for k, (leaf, size) in enumerate(leaves.items()):
            level3_names.append(leaf)
            level3_values.append(size)
            level3_colors.append(branch_tints[4 + k % 2])


# Figure layout: sunburst left, branch-size summary right
fig = plt.figure(figsize=(8, 4.5), dpi=400, facecolor=PAGE_BG)
ax_sun = fig.add_axes((0.02, 0.05, 0.54, 0.86))
ax_bar = fig.add_axes((0.60, 0.18, 0.36, 0.58))
ax_sun.set_facecolor(PAGE_BG)
ax_bar.set_facecolor(PAGE_BG)

ring_width = 0.32
inner_radius = 0.22

# Level 3 (outermost ring — leaf folders)
wedges3, _ = ax_sun.pie(
    level3_values,
    radius=inner_radius + 3 * ring_width,
    colors=level3_colors,
    startangle=90,
    counterclock=False,
    wedgeprops={"width": ring_width, "edgecolor": PAGE_BG, "linewidth": 2},
)

# Level 2 (middle ring — subdirectories)
wedges2, _ = ax_sun.pie(
    level2_values,
    radius=inner_radius + 2 * ring_width,
    colors=level2_colors,
    startangle=90,
    counterclock=False,
    wedgeprops={"width": ring_width, "edgecolor": PAGE_BG, "linewidth": 2},
)

# Level 1 (innermost ring — top-level directories)
wedges1, texts1 = ax_sun.pie(
    level1_values,
    radius=inner_radius + ring_width,
    colors=level1_colors,
    labels=level1_names,
    labeldistance=0.6,
    startangle=90,
    counterclock=False,
    wedgeprops={"width": ring_width, "edgecolor": PAGE_BG, "linewidth": 2},
    textprops={"fontsize": 14, "fontweight": "bold"},
)
for text, color in zip(texts1, level1_colors, strict=True):
    fill = _label_color(color)
    text.set_color(fill)
    text.set_path_effects(_label_halo(fill))

# Level 2 labels — horizontal, shown only where the wedge is wide enough to hold text
level2_label_positions = []  # (x, y) of rendered labels, checked by level-3 labels below
for i, wedge in enumerate(wedges2):
    ang = (wedge.theta2 + wedge.theta1) / 2
    span = wedge.theta2 - wedge.theta1
    if span <= 15:
        continue
    r = inner_radius + 1.5 * ring_width
    x = r * np.cos(np.radians(ang))
    y = r * np.sin(np.radians(ang))
    fill = _label_color(level2_colors[i])
    ax_sun.text(
        x,
        y,
        level2_names[i].rstrip("/"),
        ha="center",
        va="center",
        fontsize=12,
        color=fill,
        path_effects=_label_halo(fill),
    )
    level2_label_positions.append((x, y))

# Level 3 labels — higher threshold to avoid crowding the outermost, narrowest wedges
for i, wedge in enumerate(wedges3):
    ang = (wedge.theta2 + wedge.theta1) / 2
    span = wedge.theta2 - wedge.theta1
    if span <= 10:
        continue
    r = inner_radius + 2.6 * ring_width
    x = r * np.cos(np.radians(ang))
    y = r * np.sin(np.radians(ang))
    # Skip if a level-2 label already sits on almost the same horizontal line — at this
    # radius scale their text would run together (e.g. "componentsforms") with no visible gap.
    if any(abs(y - ly) < 0.08 and abs(x - lx) < 0.9 for lx, ly in level2_label_positions):
        continue
    fill = _label_color(level3_colors[i])
    ax_sun.text(
        x,
        y,
        level3_names[i].rstrip("/"),
        ha="center",
        va="center",
        fontsize=10,
        color=fill,
        path_effects=_label_halo(fill),
    )

# Center text showing repository total
total_size = sum(level1_values)
ax_sun.text(0, 0, f"{total_size} MB", ha="center", va="center", fontsize=15, fontweight="bold", color=INK)
ax_sun.set_aspect("equal")
outer_radius = inner_radius + 3 * ring_width
sun_lim = outer_radius * 1.08
ax_sun.set_xlim(-sun_lim, sun_lim)
ax_sun.set_ylim(-sun_lim, sun_lim)

# Companion panel: directory totals via seaborn's Objects interface (so.Plot),
# colored with the same branch hues as the sunburst rings
df_dir = pd.DataFrame({"Directory": level1_names, "Size (MB)": level1_values}).sort_values("Size (MB)", ascending=True)
(
    so.Plot(df_dir, x="Size (MB)", y="Directory", color="Directory")
    .add(so.Bar(edgecolor=PAGE_BG, edgewidth=2))
    .scale(color=so.Nominal(dict(zip(level1_names, IMPRINT, strict=True))))
    .on(ax_bar)
    .plot()
)
for legend in fig.legends:
    legend.set_visible(False)

ax_bar.set_xlabel("Size (MB)", fontsize=20, color=INK)
ax_bar.set_ylabel("", color=INK)
ax_bar.tick_params(axis="both", labelsize=16, colors=INK_SOFT)
ax_bar.set_title("Directory Totals", fontsize=18, fontweight="bold", pad=12, color=INK)
ax_bar.xaxis.grid(True, alpha=0.15, color=INK)
sns.despine(ax=ax_bar)

for i, v in enumerate(df_dir["Size (MB)"]):
    ax_bar.text(v + 4, i, f"{v} MB", va="center", fontsize=13, fontweight="normal", color=INK)
ax_bar.set_xlim(0, max(level1_values) * 1.22)

fig.suptitle("sunburst-basic · python · seaborn · anyplot.ai", fontsize=18, fontweight="bold", y=0.98, color=INK)

plt.savefig(f"plot-{THEME}.png", dpi=400, facecolor=PAGE_BG)
Runnable source as JSON, for any HTTP client: https://api.anyplot.ai/specs/sunburst-basic/seaborn/code. Any spec id and library id listed in llms-full.txt fit the same URL shape; every URL below is complete and callable.
{
  "spec_id": "sunburst-basic",
  "language": "python",
  "library": "seaborn",
  "page": "https://anyplot.ai/sunburst-basic/python/seaborn",
  "hub": "https://anyplot.ai/sunburst-basic",
  "code_json": "https://api.anyplot.ai/specs/sunburst-basic/seaborn/code",
  "spec_json": "https://api.anyplot.ai/specs/sunburst-basic",
  "render_light_png": "https://storage.googleapis.com/anyplot-images/plots/sunburst-basic/python/seaborn/plot-light.png",
  "render_dark_png": "https://storage.googleapis.com/anyplot-images/plots/sunburst-basic/python/seaborn/plot-dark.png",
  "quality_score": 84.0,
  "license": "MIT",
  "guide": "https://anyplot.ai/llms.txt"
}
Part of Basic Sunburst Chart on anyplot.ai.