The same plot in 14 other libraries — JavaScript: Chart.js, Apache ECharts, Highcharts, MUI X Charts; Python: Altair, Bokeh, lets-plot, Matplotlib, Plotly, plotnine, Pygal, Seaborn; R: ggplot2; Julia: Makie.jl. Compare all 15 side by side: Basic Sunburst Chart in Python, R, Julia and JavaScript.
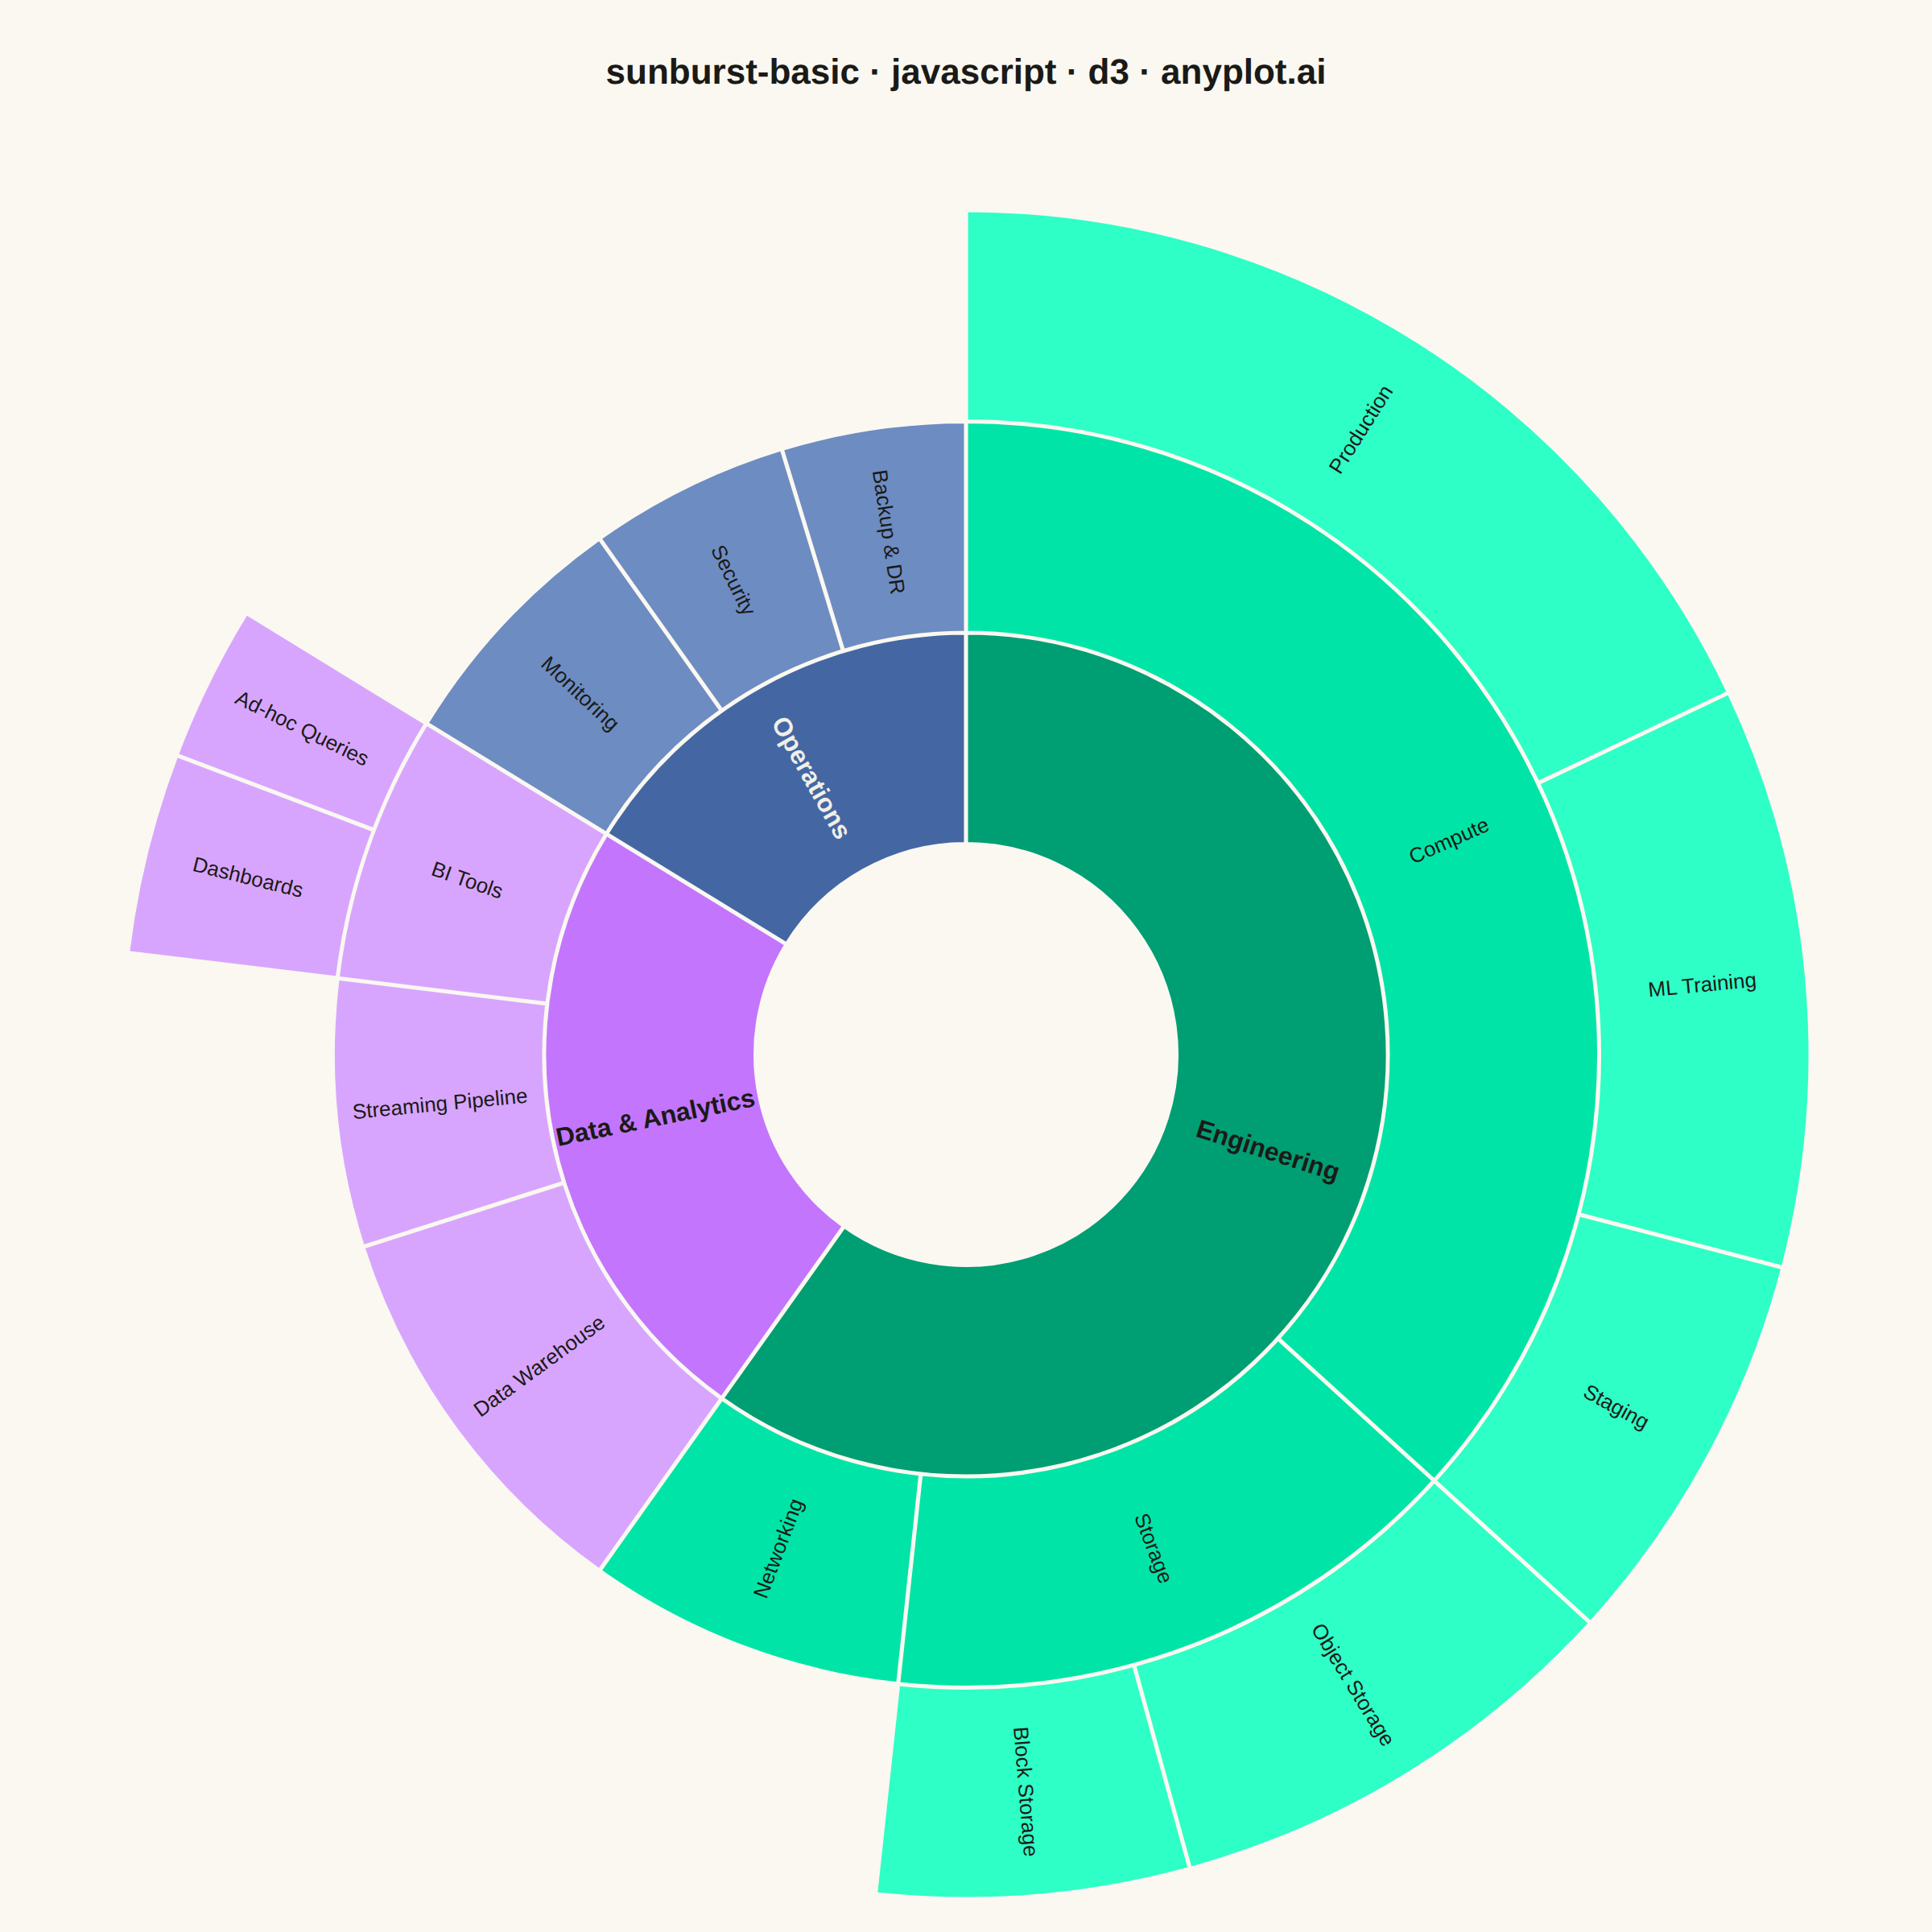
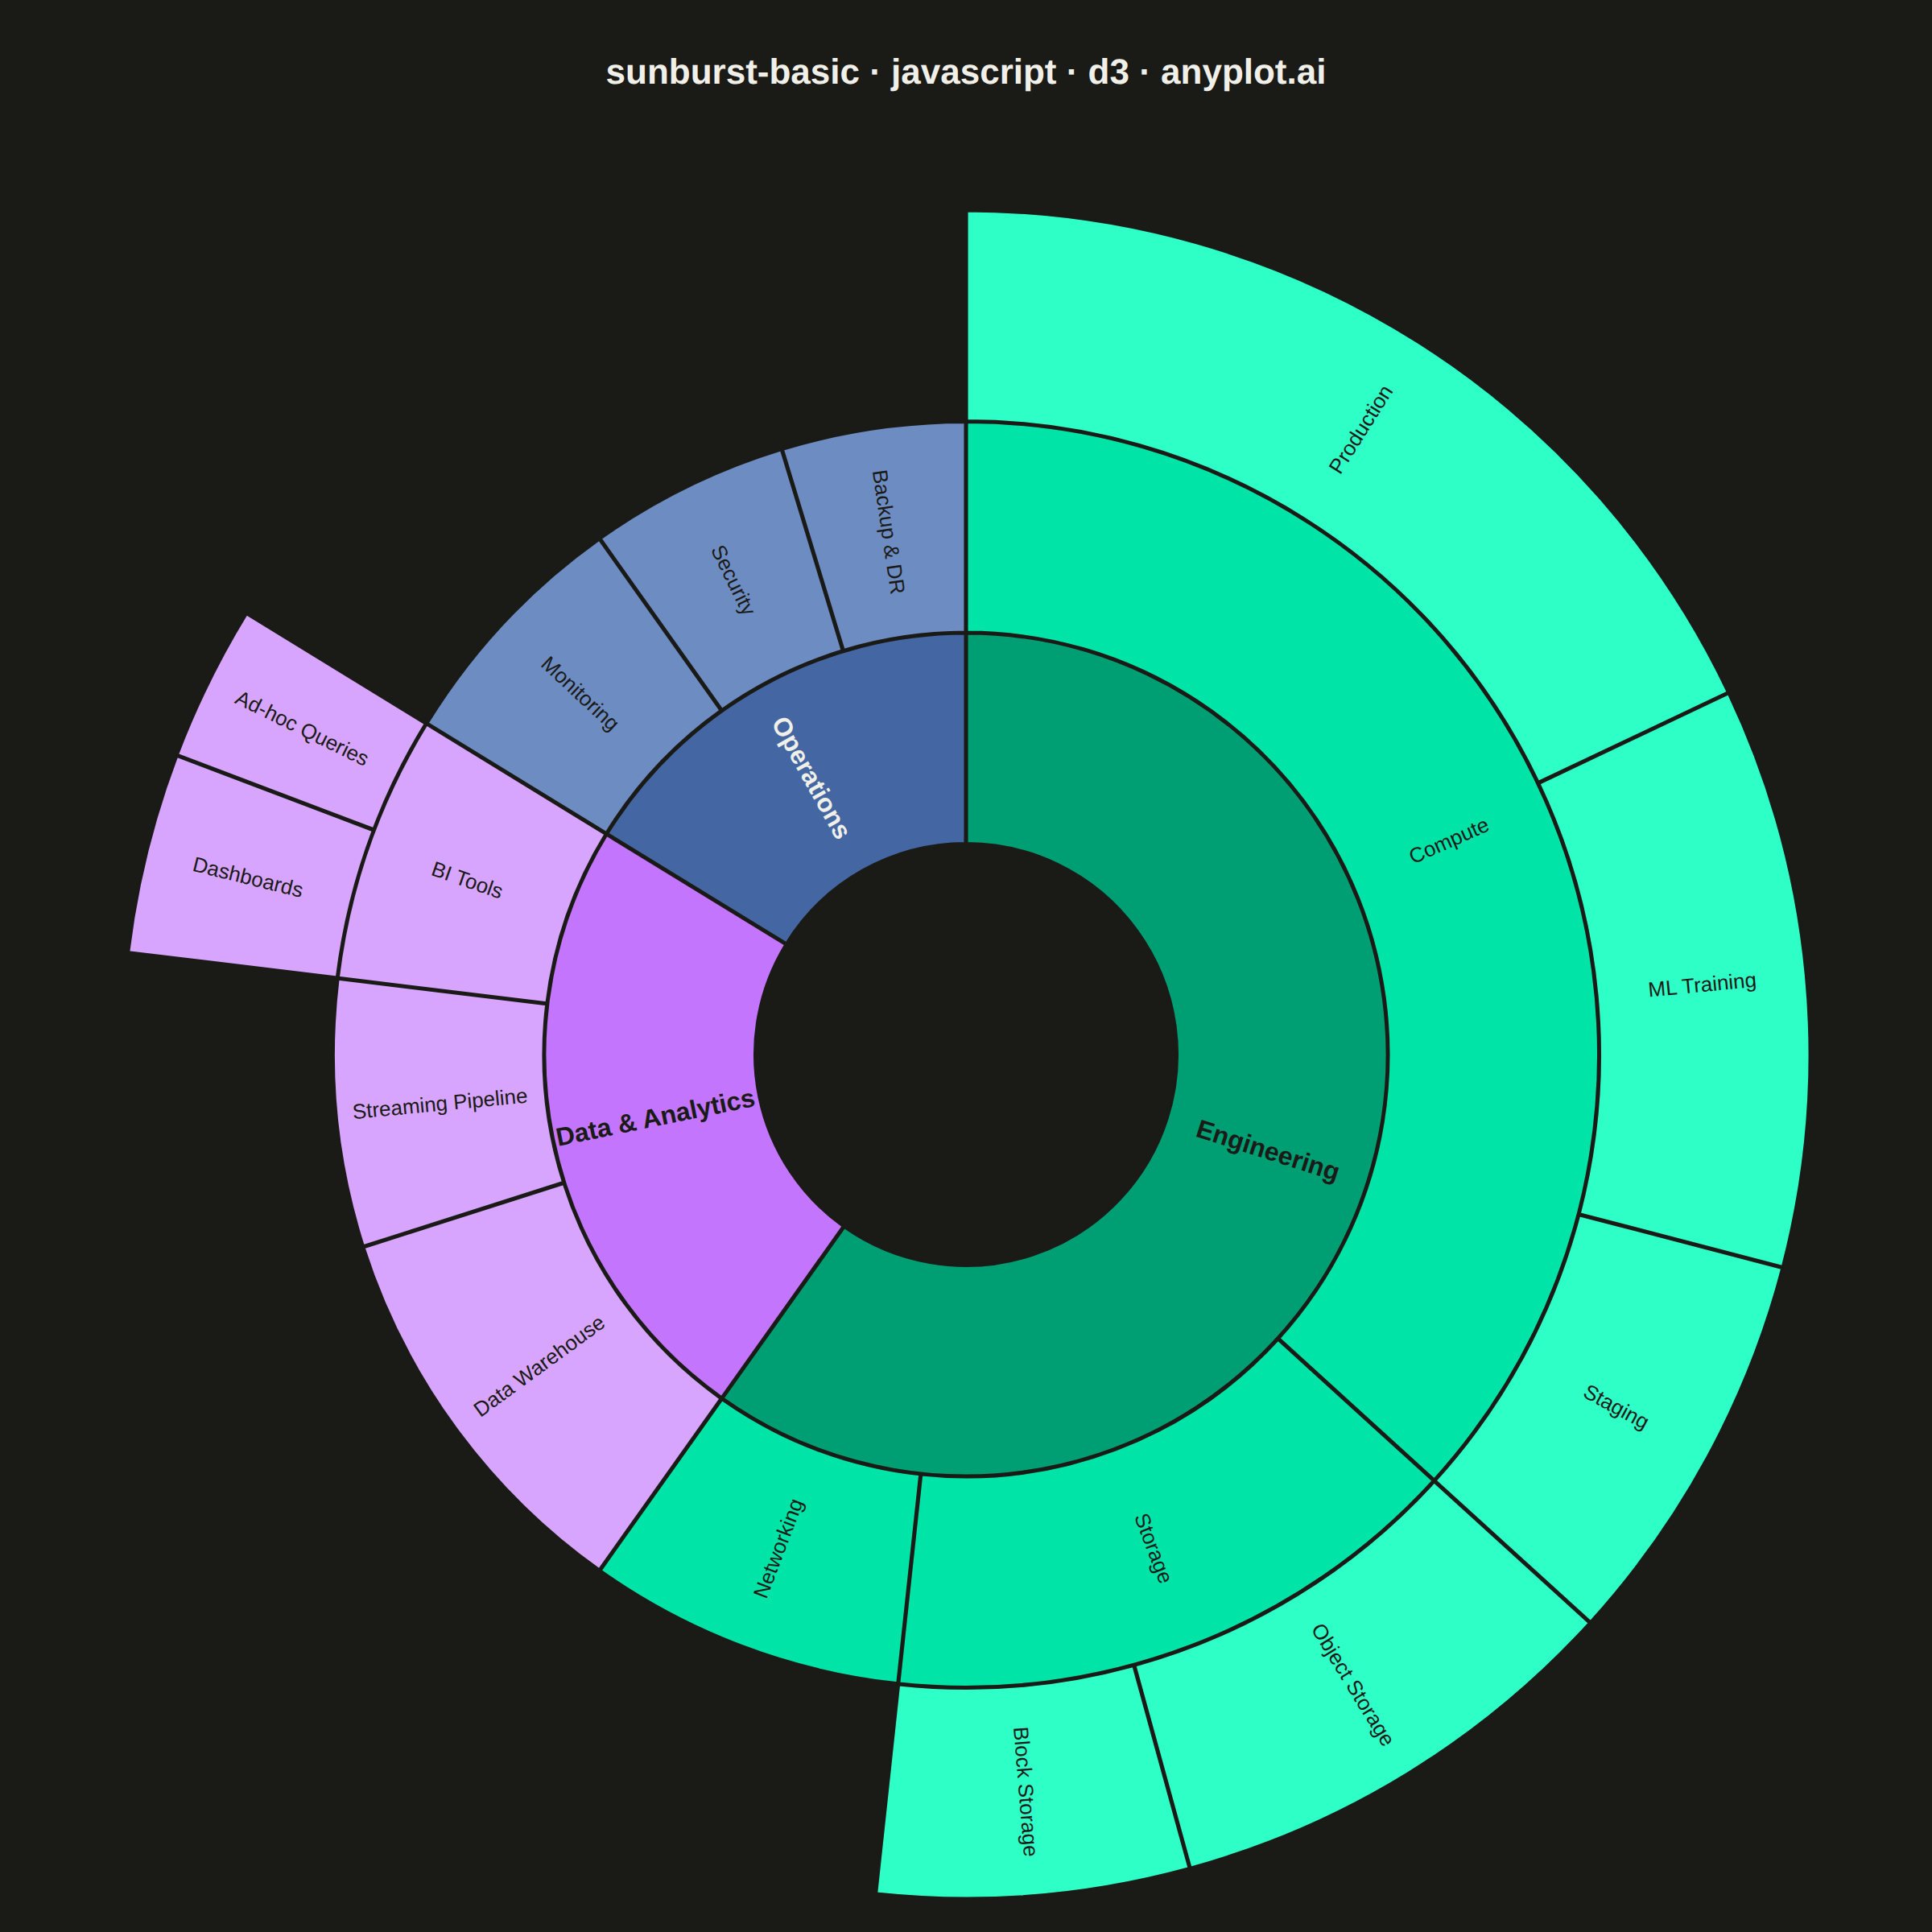
A sunburst chart displays hierarchical data as concentric rings, where each ring represents a level in the hierarchy. Inner rings show parent categories while outer rings show their children, with segment angles proportional to values. This radial visualization excels at revealing hierarchical structures and part-to-whole relationships across multiple levels simultaneously.
// anyplot.ai
// sunburst-basic: Basic Sunburst Chart
// Library: d3 7.9.0 | JavaScript 22.23.1
// Quality: 91/100 | Created: 2026-07-26

//# anyplot-orientation: square
const t = window.ANYPLOT_TOKENS;
const { width, height } = window.ANYPLOT_SIZE;

// --- Data (in-memory, deterministic) ----------------------------------------
// Cloud infrastructure spend, thousands USD/month, by business unit -> service -> workload.
const data = {
  name: "Cloud Spend",
  children: [
    {
      name: "Engineering",
      children: [
        {
          name: "Compute",
          children: [
            { name: "Production", value: 42 },
            { name: "Staging", value: 18 },
            { name: "ML Training", value: 26 },
          ],
        },
        {
          name: "Storage",
          children: [
            { name: "Object Storage", value: 21 },
            { name: "Block Storage", value: 14 },
          ],
        },
        { name: "Networking", value: 19 },
      ],
    },
    {
      name: "Data & Analytics",
      children: [
        { name: "Data Warehouse", value: 24 },
        { name: "Streaming Pipeline", value: 16 },
        {
          name: "BI Tools",
          children: [
            { name: "Dashboards", value: 9 },
            { name: "Ad-hoc Queries", value: 7 },
          ],
        },
      ],
    },
    {
      name: "Operations",
      children: [
        { name: "Monitoring", value: 15 },
        { name: "Security", value: 12 },
        { name: "Backup & DR", value: 11 },
      ],
    },
  ],
};

// --- Layout -------------------------------------------------------------
const margin = { top: 130, right: 20, bottom: 20, left: 20 };
const size = Math.min(width - margin.left - margin.right, height - margin.top - margin.bottom);
const radius = size / 2;

const root = d3
  .hierarchy(data)
  .sum((d) => d.value)
  .sort((a, b) => b.value - a.value);
d3.partition().size([2 * Math.PI, radius])(root);

// --- Color: one hue per top-level branch, lightened per depth -----------
const branchNames = root.children.map((d) => d.data.name);
const branchColor = d3.scaleOrdinal().domain(branchNames).range(t.palette);

function wedgeHsl(d) {
  let branchNode = d;
  while (branchNode.depth > 1) branchNode = branchNode.parent;
  const base = d3.hsl(branchColor(branchNode.data.name));
  base.l = Math.min(0.82, base.l + (d.depth - 1) * 0.14);
  return base;
}
const colorFor = (d) => wedgeHsl(d).toString();
// Label ink is picked by WCAG relative luminance (not HSL lightness, which
// misjudges green: it's weighted 0.7152 in the WCAG formula vs. 0.0722 for
// blue, so a green wedge is far brighter than a blue wedge at the same HSL
// l). Comparing actual contrast ratios against both ink options keeps every
// label >=4.5:1 regardless of hue, in both themes.
const LABEL_DARK = "#1A1A17";
const LABEL_LIGHT = "#F0EFE8";
function relLuminance(color) {
  const c = d3.rgb(color);
  const lin = (v) => {
    v /= 255;
    return v <= 0.03928 ? v / 12.92 : Math.pow((v + 0.055) / 1.055, 2.4);
  };
  return 0.2126 * lin(c.r) + 0.7152 * lin(c.g) + 0.0722 * lin(c.b);
}
function contrastRatio(l1, l2) {
  const [hi, lo] = l1 > l2 ? [l1, l2] : [l2, l1];
  return (hi + 0.05) / (lo + 0.05);
}
function labelColorFor(d) {
  const wedgeLum = relLuminance(colorFor(d));
  const darkContrast = contrastRatio(wedgeLum, relLuminance(LABEL_DARK));
  const lightContrast = contrastRatio(wedgeLum, relLuminance(LABEL_LIGHT));
  return darkContrast >= lightContrast ? LABEL_DARK : LABEL_LIGHT;
}

// --- SVG mount ------------------------------------------------------------
const svg = d3.select("#container").append("svg").attr("width", width).attr("height", height);
const g = svg.append("g").attr("transform", `translate(${width / 2},${margin.top + radius})`);

const arc = d3
  .arc()
  .startAngle((d) => d.x0)
  .endAngle((d) => d.x1)
  .padAngle((d) => Math.min((d.x1 - d.x0) / 2, 0.004))
  .padRadius(radius / 2)
  .innerRadius((d) => d.y0)
  .outerRadius((d) => d.y1 - 1);

// --- Segments (skip the invisible root) ------------------------------------
g.selectAll("path")
  .data(root.descendants().filter((d) => d.depth > 0))
  .join("path")
  .attr("d", arc)
  .attr("fill", colorFor)
  .attr("stroke", t.pageBg)
  .attr("stroke-width", 1.5);

// --- Labels: only where the angular span leaves room to read ---------------
function labelTransform(d) {
  const midAngle = ((d.x0 + d.x1) / 2) * (180 / Math.PI);
  const labelRadius = (d.y0 + d.y1) / 2;
  const rotate = midAngle - 90;
  const flip = midAngle < 180 ? 0 : 180;
  return `rotate(${rotate}) translate(${labelRadius},0) rotate(${flip})`;
}

g.selectAll("text")
  .data(root.descendants().filter((d) => d.depth > 0 && d.x1 - d.x0 > 0.11))
  .join("text")
  .attr("transform", labelTransform)
  .attr("dy", "0.32em")
  .attr("text-anchor", "middle")
  .attr("fill", labelColorFor)
  .style("font-size", (d) => (d.depth === 1 ? "16px" : "13px"))
  .style("font-weight", (d) => (d.depth === 1 ? "600" : "400"))
  .style("pointer-events", "none")
  .text((d) => d.data.name);

// --- Title ------------------------------------------------------------------
svg
  .append("text")
  .attr("x", width / 2)
  .attr("y", 52)
  .attr("text-anchor", "middle")
  .attr("fill", t.ink)
  .style("font-size", "22px")
  .style("font-weight", "600")
  .text("sunburst-basic · javascript · d3 · anyplot.ai");
Runnable source as JSON, for any HTTP client: https://api.anyplot.ai/specs/sunburst-basic/d3/code. Any spec id and library id listed in llms-full.txt fit the same URL shape; every URL below is complete and callable.
{
  "spec_id": "sunburst-basic",
  "language": "javascript",
  "library": "d3",
  "page": "https://anyplot.ai/sunburst-basic/javascript/d3",
  "hub": "https://anyplot.ai/sunburst-basic",
  "code_json": "https://api.anyplot.ai/specs/sunburst-basic/d3/code",
  "spec_json": "https://api.anyplot.ai/specs/sunburst-basic",
  "render_light_png": "https://storage.googleapis.com/anyplot-images/plots/sunburst-basic/javascript/d3/plot-light.png",
  "render_dark_png": "https://storage.googleapis.com/anyplot-images/plots/sunburst-basic/javascript/d3/plot-dark.png",
  "interactive_light_html": "https://storage.googleapis.com/anyplot-images/plots/sunburst-basic/javascript/d3/plot-light.html",
  "interactive_dark_html": "https://storage.googleapis.com/anyplot-images/plots/sunburst-basic/javascript/d3/plot-dark.html",
  "quality_score": 91.0,
  "license": "MIT",
  "guide": "https://anyplot.ai/llms.txt"
}
Part of Basic Sunburst Chart on anyplot.ai.