The same plot in 14 other libraries — JavaScript: Chart.js, D3.js, Apache ECharts, MUI X Charts; Python: Altair, Bokeh, lets-plot, Matplotlib, Plotly, plotnine, Pygal, Seaborn; R: ggplot2; Julia: Makie.jl. Compare all 15 side by side: Basic Sunburst Chart in Python, R, Julia and JavaScript.
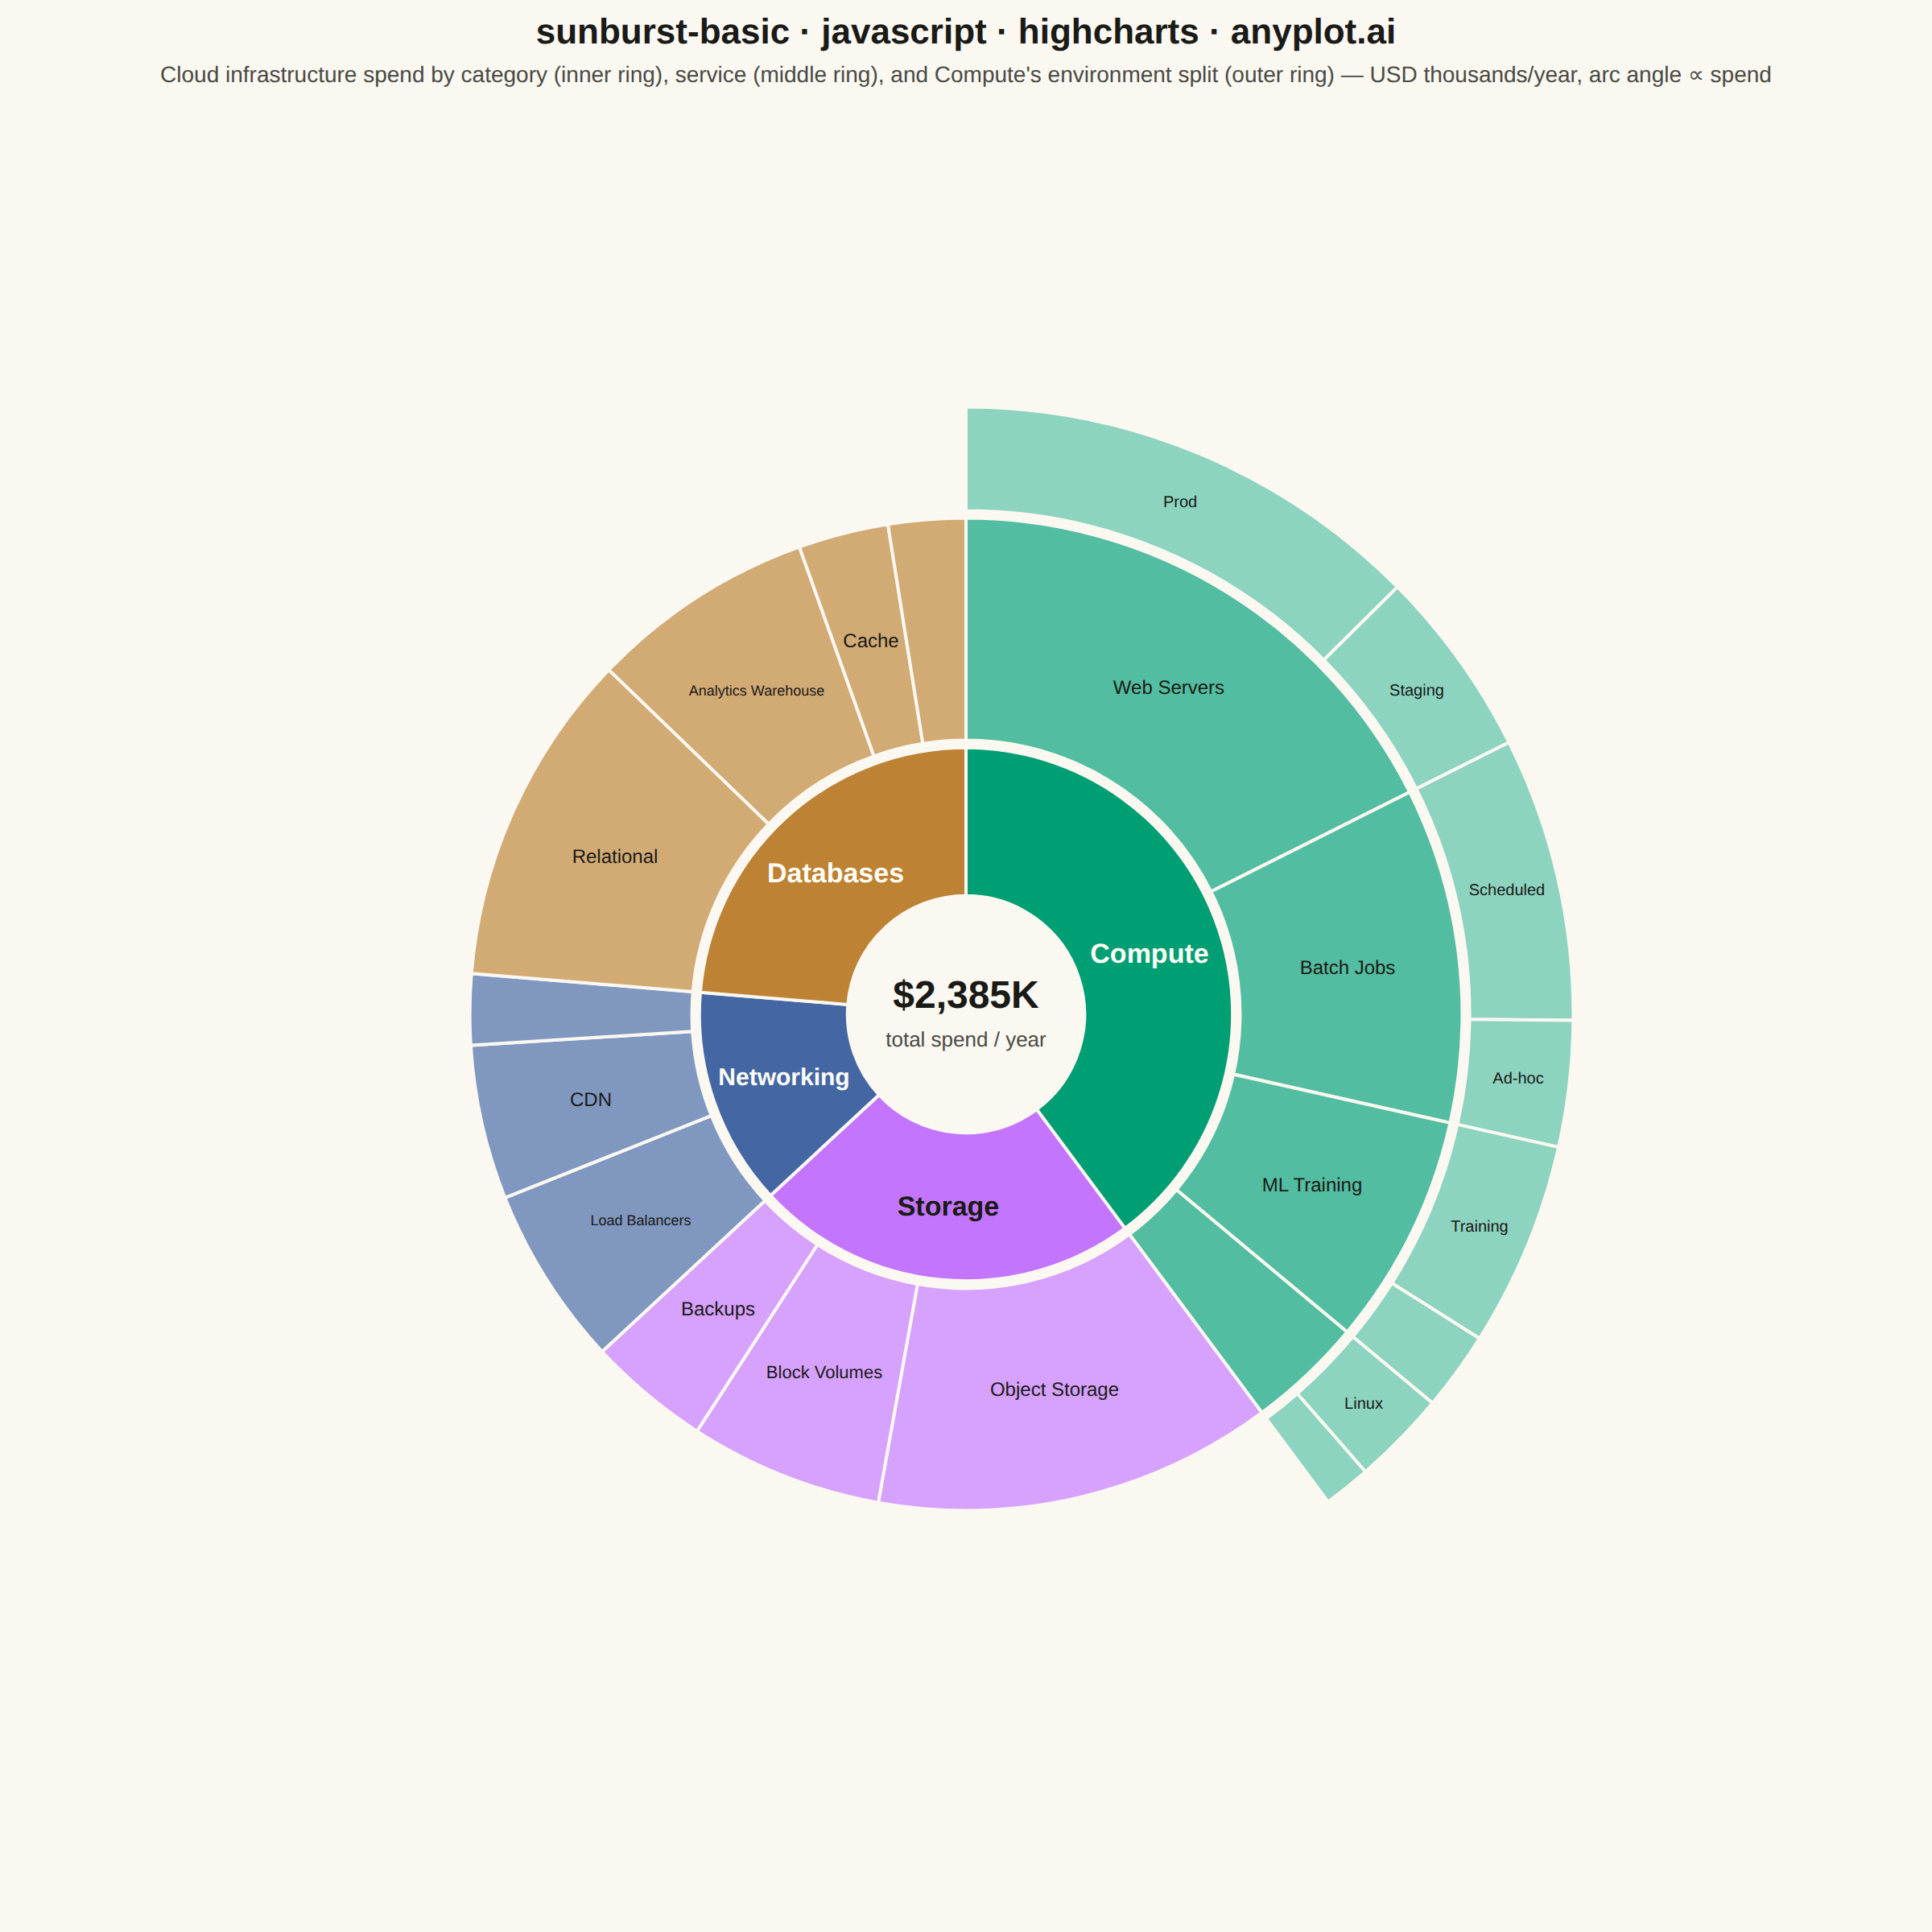
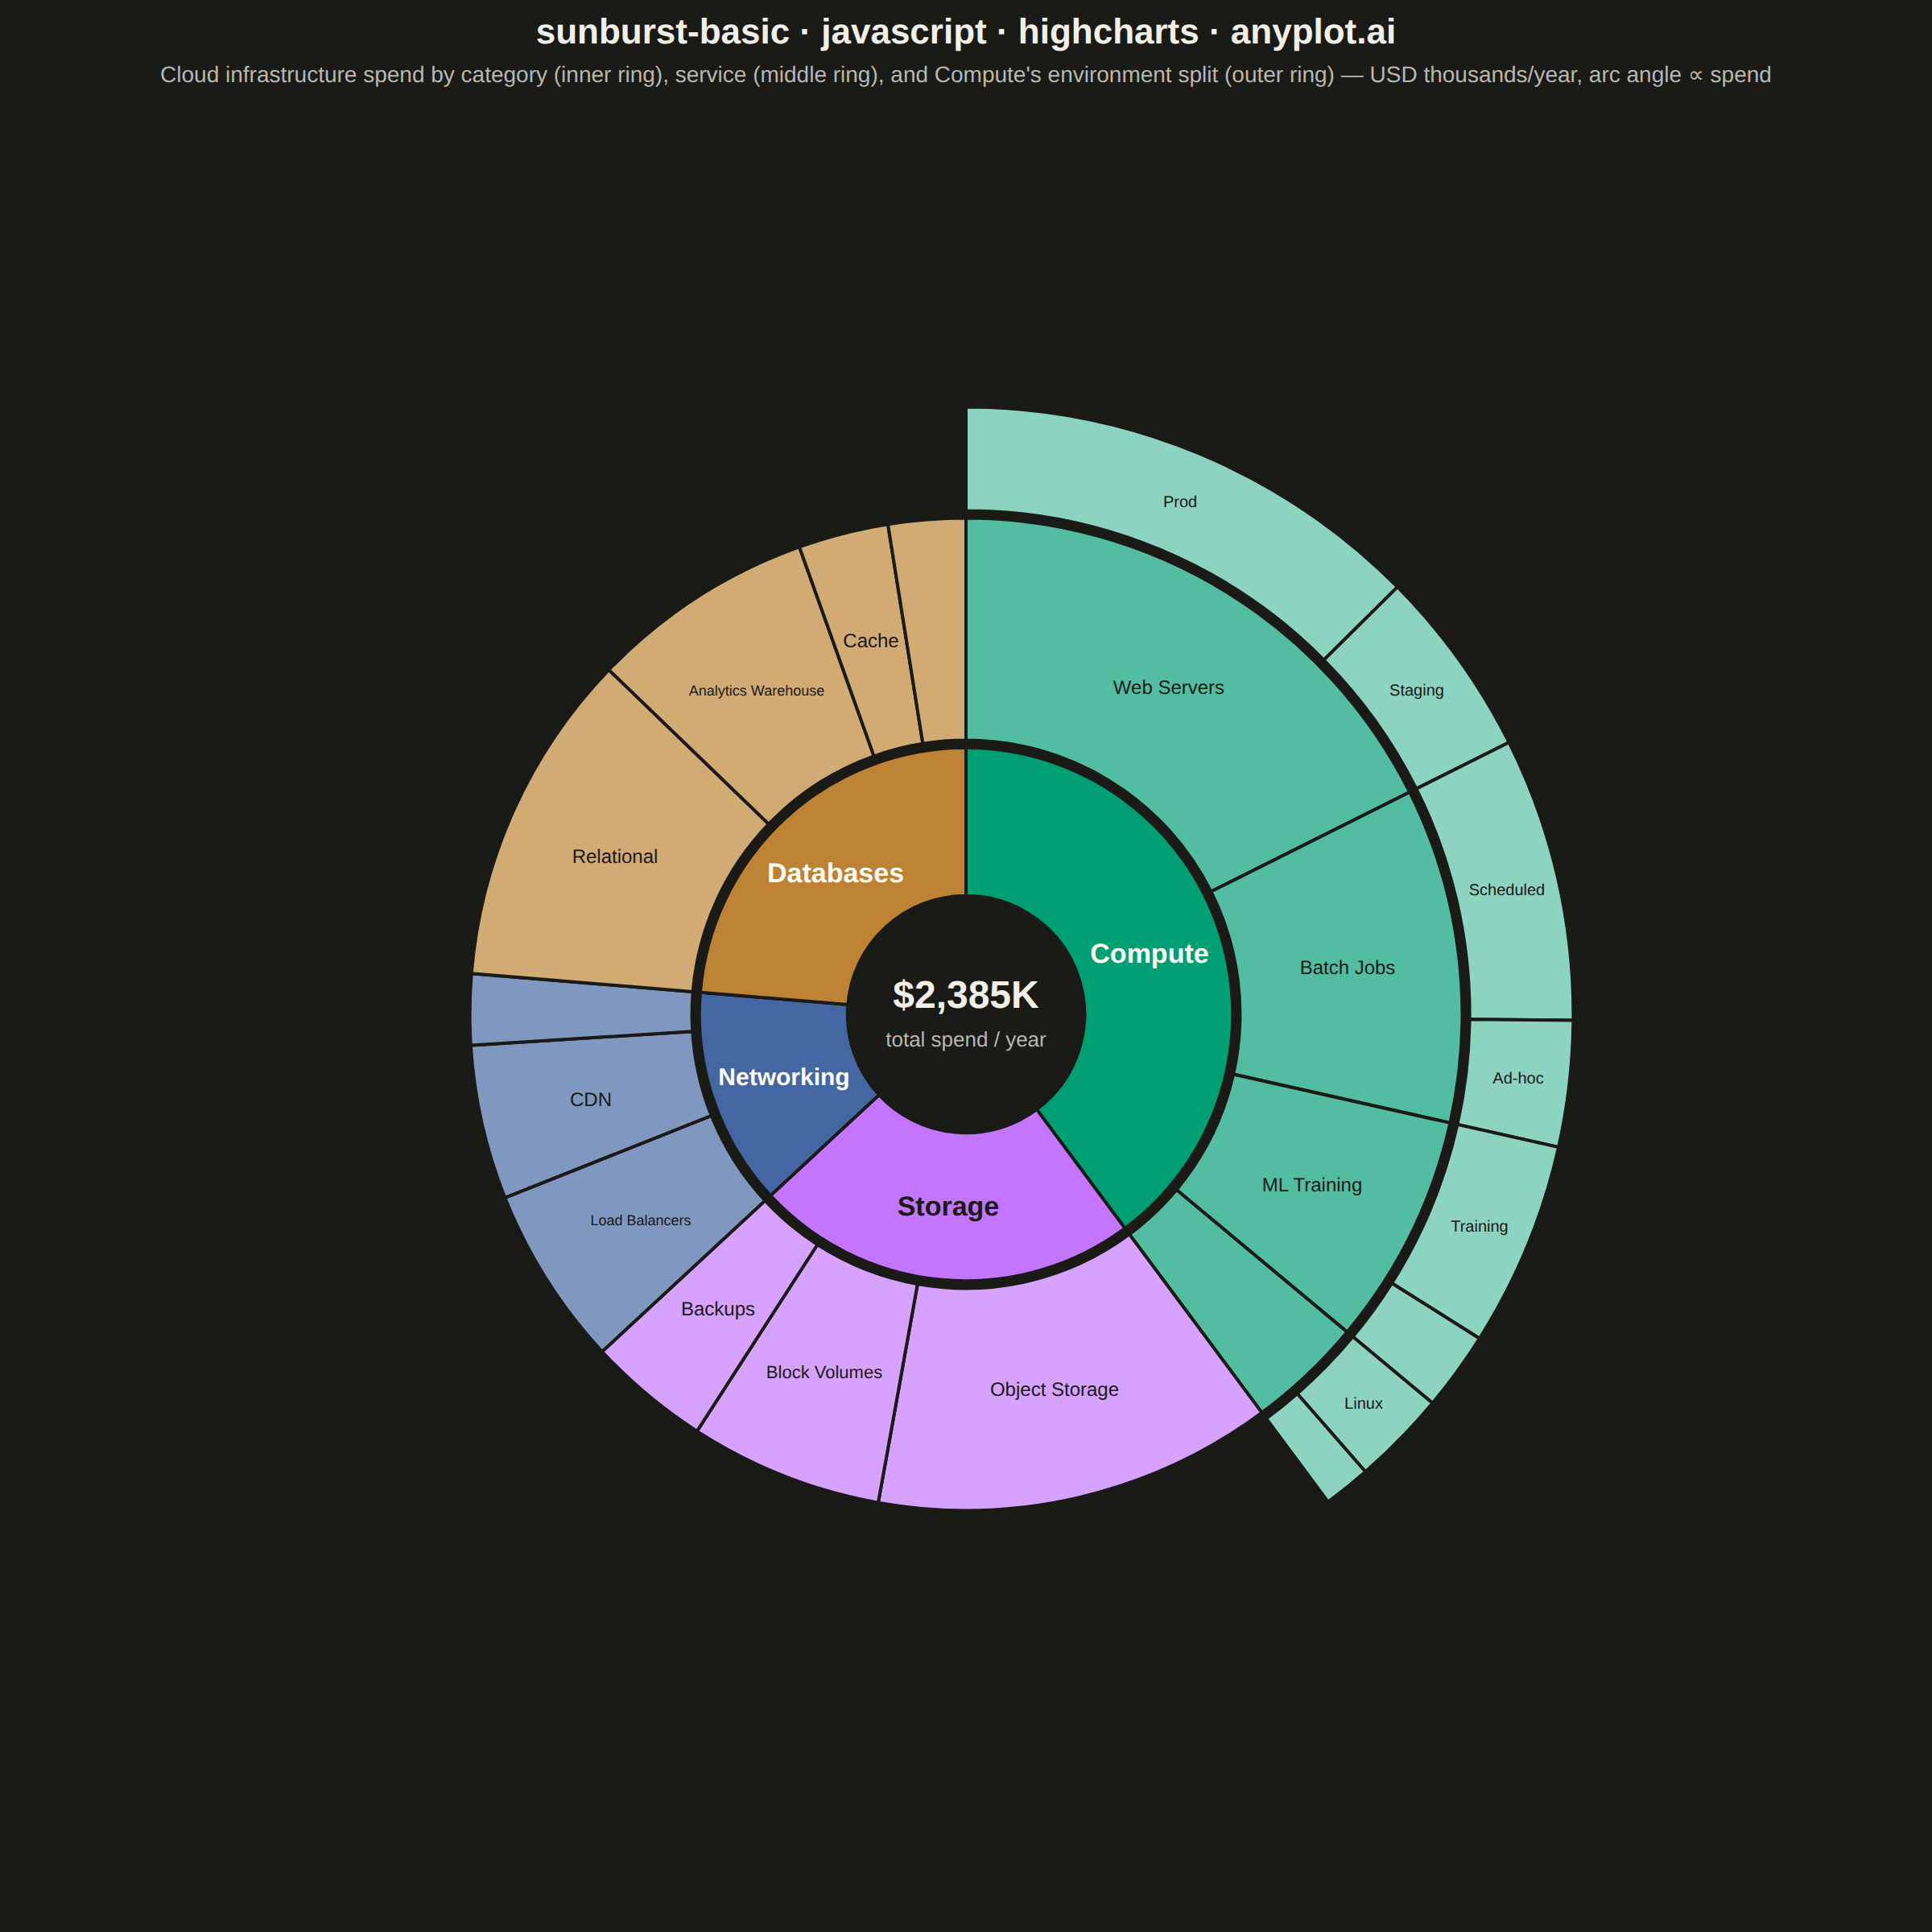
A sunburst chart displays hierarchical data as concentric rings, where each ring represents a level in the hierarchy. Inner rings show parent categories while outer rings show their children, with segment angles proportional to values. This radial visualization excels at revealing hierarchical structures and part-to-whole relationships across multiple levels simultaneously.
// anyplot.ai
// sunburst-basic: Basic Sunburst Chart
// Library: highcharts 12.6.0 | JavaScript 22.23.1
// Quality: 91/100 | Created: 2026-07-26

//# anyplot-orientation: square

// Only the core Highcharts bundle is loaded (no `sunburst`/`treemap` module),
// so the rings are drawn natively with `chart.renderer.arc()` — the same
// public SVGRenderer method the core pie series itself draws slices with.
// Angles are accumulated per branch, then per leaf within each branch, so
// inner segments always encompass the angular span of their children. The
// Compute branch carries an optional 3rd (environment) level to demonstrate
// the plot type's multi-level depth — a sunburst need not go equally deep on
// every path, so the other 3 branches simply terminate at ring 2.

const t = window.ANYPLOT_TOKENS;

// --- Data: cloud infrastructure spend by category and service --------------
// (USD thousands / year). 4 root categories, 14 leaves; Compute's 4 leaves
// further split by environment for a 3rd-ring example.
const DATA = [
  {
    level1: "Compute",
    level2: "Web Servers",
    value: 420,
    level3: [
      { name: "Prod", value: 300 },
      { name: "Staging", value: 120 },
    ],
  },
  {
    level1: "Compute",
    level2: "Batch Jobs",
    value: 260,
    level3: [
      { name: "Scheduled", value: 180 },
      { name: "Ad-hoc", value: 80 },
    ],
  },
  {
    level1: "Compute",
    level2: "ML Training",
    value: 180,
    level3: [
      { name: "Training", value: 130 },
      { name: "Inference", value: 50 },
    ],
  },
  {
    level1: "Compute",
    level2: "CI/CD Runners",
    value: 90,
    level3: [
      { name: "Linux", value: 60 },
      { name: "Windows", value: 30 },
    ],
  },
  { level1: "Storage", level2: "Object Storage", value: 310 },
  { level1: "Storage", level2: "Block Volumes", value: 150 },
  { level1: "Storage", level2: "Backups", value: 95 },
  { level1: "Networking", level2: "Load Balancers", value: 140 },
  { level1: "Networking", level2: "CDN", value: 120 },
  { level1: "Networking", level2: "VPN Gateways", value: 55 },
  { level1: "Databases", level2: "Relational", value: 260 },
  { level1: "Databases", level2: "Analytics Warehouse", value: 175 },
  { level1: "Databases", level2: "Cache", value: 70 },
  { level1: "Databases", level2: "Search Index", value: 60 },
];

// First categorical series is always the brand green (Imprint position 1);
// the remaining root categories follow the canonical order. Every leaf keeps
// its parent's hue (lightened) so the branch stays identifiable ring-to-ring.
const CATEGORIES = ["Compute", "Storage", "Networking", "Databases"];
const branches = CATEGORIES.map((name, i) => {
  const leaves = DATA.filter((d) => d.level1 === name);
  return { name, color: t.palette[i], leaves, total: leaves.reduce((s, d) => s + d.value, 0) };
});
const grandTotal = branches.reduce((s, b) => s + b.total, 0);

// --- Color + label helpers ---------------------------------------------------
const mix = (hex, target, amount) => {
  const a = parseInt(hex.slice(1), 16);
  const b = parseInt(target.slice(1), 16);
  const chan = (shift) => {
    const c1 = (a >> shift) & 255;
    const c2 = (b >> shift) & 255;
    return Math.round(c1 + (c2 - c1) * amount);
  };
  return `#${[16, 8, 0].map((s) => chan(s).toString(16).padStart(2, "0")).join("")}`;
};
const luma = (hex) => {
  const c = parseInt(hex.slice(1), 16);
  const r = (c >> 16) & 255;
  const g = (c >> 8) & 255;
  const b = c & 255;
  return (0.299 * r + 0.587 * g + 0.114 * b) / 255;
};
const labelColorFor = (bgHex) => (luma(bgHex) > 0.55 ? "#1A1A17" : "#FFFDF6");
const money = (v) => `$${v.toLocaleString("en-US")}K`;

// --- Chart shell (no series/axes — both rings are drawn by hand) -----------
const chart = Highcharts.chart("container", {
  chart: {
    backgroundColor: "transparent",
    animation: false,
    style: { fontFamily: "inherit" },
    marginTop: 130,
    marginBottom: 70,
    marginLeft: 140,
    marginRight: 140,
  },
  credits: { enabled: false },
  colors: t.palette,
  title: {
    text: "sunburst-basic · javascript · highcharts · anyplot.ai",
    style: { color: t.ink, fontSize: "22px", fontWeight: "600" },
  },
  subtitle: {
    text: "Cloud infrastructure spend by category (inner ring), service (middle ring), and Compute's environment split (outer ring) — USD thousands/year, arc angle ∝ spend",
    style: { color: t.inkSoft, fontSize: "14px" },
  },
  xAxis: { visible: false },
  yAxis: { visible: false },
  legend: { enabled: false },
  plotOptions: { series: { animation: false } },
  series: [],
});

// --- Layout: concentric rings sized from the plot's own pixel space --------
const cx = chart.plotLeft + chart.plotWidth / 2;
const cy = chart.plotTop + chart.plotHeight / 2;
const maxR = Math.min(chart.plotWidth, chart.plotHeight) / 2;

// Ring 1 (short branch names) stays thin, ring 2 (longest labels, e.g.
// "Analytics Warehouse") keeps most of the original 2-ring radius so its
// labels still have enough arc length to fit, and ring 3 (short env names)
// takes the remainder.
const holeR = maxR * 0.16;
const innerR1 = holeR;
const outerR1 = innerR1 + maxR * 0.2;
const innerR2 = outerR1 + maxR * 0.01;
const outerR2 = innerR2 + maxR * 0.3;
const innerR3 = outerR2 + maxR * 0.01;
const outerR3 = innerR3 + maxR * 0.14;

const TAU = Math.PI * 2;
const TOP = -Math.PI / 2; // renderer.arc: 0 = 3 o'clock, -PI/2 = 12 o'clock, clockwise

const g = chart.renderer.g("sunburst").add();
const arcs = []; // { el, branchIndex } — driving the hover-highlight below

// Draws one ring wedge, an optional centered label, and a native hover
// tooltip (<title>) — the same hand-drawn-tooltip technique used for the
// sankey diagram, since no series/tooltip module is loaded either.
//
// Labels shrink-to-fit: rather than an all-or-nothing check at the nominal
// fontSize (which let a bigger segment with a long name lose its label to a
// smaller segment with a short one), we step the size down to minFontSize
// and take the largest size that actually fits the wedge's arc length. A
// value-ranked segment therefore keeps a (possibly smaller) label instead of
// being dropped outright.
function drawWedge(innerR, outerR, start, end, fill, branchIndex, tooltipText, labelText, fontSize, minFontSize, fontWeight) {
  const el = chart.renderer
    .arc(cx, cy, outerR, innerR, start, end)
    .attr({ fill, stroke: t.pageBg, "stroke-width": 2 })
    .css({ cursor: "pointer" })
    .add(g);
  const titleEl = document.createElementNS("http://www.w3.org/2000/svg", "title");
  titleEl.textContent = tooltipText;
  el.element.appendChild(titleEl);
  arcs.push({ el, branchIndex, baseFill: fill });

  const span = end - start;
  const midR = (innerR + outerR) / 2;
  const arcLen = midR * span;
  let size = fontSize;
  while (size >= minFontSize) {
    const estWidth = labelText.length * size * 0.58 + 8;
    if (arcLen >= estWidth && outerR - innerR >= size * 1.6) break;
    size -= 1;
  }
  if (labelText && size >= minFontSize) {
    const mid = (start + end) / 2;
    const lx = cx + midR * Math.cos(mid);
    const ly = cy + midR * Math.sin(mid);
    chart.renderer
      .text(labelText, lx, ly + size * 0.35)
      .attr({ align: "center", zIndex: 5 })
      .css({ color: labelColorFor(fill), fontSize: `${size}px`, fontWeight, pointerEvents: "none" })
      .add(g);
  }
  return el;
}

// --- Ring 1: root categories -------------------------------------------------
let cursor = TOP;
branches.forEach((branch, i) => {
  const start = cursor;
  const end = start + (branch.total / grandTotal) * TAU;
  cursor = end;
  const pct = ((branch.total / grandTotal) * 100).toFixed(1);
  drawWedge(innerR1, outerR1, start, end, branch.color, i, `${branch.name}: ${money(branch.total)} (${pct}%)`, branch.name, 17, 14, "600");
});

// --- Ring 2: services, angularly nested under their parent category --------
cursor = TOP;
branches.forEach((branch, i) => {
  const leafColor = mix(branch.color, "#FFFFFF", 0.32);
  branch.leaves.forEach((leaf) => {
    const start = cursor;
    const end = start + (leaf.value / grandTotal) * TAU;
    cursor = end;
    const pct = ((leaf.value / grandTotal) * 100).toFixed(1);
    drawWedge(
      innerR2,
      outerR2,
      start,
      end,
      leafColor,
      i,
      `${branch.name} → ${leaf.level2}: ${money(leaf.value)} (${pct}%)`,
      leaf.level2,
      12,
      9,
      "500",
    );
  });
});

// --- Ring 3: environment split for Compute's services only -----------------
// Only branches whose leaves carry a `level3` array go a level deeper; the
// other branches simply have no arcs drawn in this radial band, which is a
// valid (and common) uneven-depth sunburst shape.
cursor = TOP;
branches.forEach((branch, i) => {
  const childColor = mix(branch.color, "#FFFFFF", 0.55);
  branch.leaves.forEach((leaf) => {
    const leafStart = cursor;
    const leafEnd = leafStart + (leaf.value / grandTotal) * TAU;
    cursor = leafEnd;
    if (!leaf.level3) return;
    let childCursor = leafStart;
    leaf.level3.forEach((child) => {
      const start = childCursor;
      const end = start + (child.value / leaf.value) * (leafEnd - leafStart);
      childCursor = end;
      const pct = ((child.value / grandTotal) * 100).toFixed(1);
      drawWedge(
        innerR3,
        outerR3,
        start,
        end,
        childColor,
        i,
        `${branch.name} → ${leaf.level2} → ${child.name}: ${money(child.value)} (${pct}%)`,
        child.name,
        10,
        8,
        "500",
      );
    });
  });
});

// Genuine hover-highlight for the HTML view: dim every wedge outside the
// hovered branch (root + its own services), no series/tooltip module needed.
arcs.forEach((arc) => {
  arc.el.on("mouseover", () => {
    arcs.forEach((other) => other.el.attr({ "fill-opacity": other.branchIndex === arc.branchIndex ? 1 : 0.25 }));
  });
  arc.el.on("mouseout", () => {
    arcs.forEach((other) => other.el.attr({ "fill-opacity": 1 }));
  });
});

// --- Center label: grand total ----------------------------------------------
chart.renderer
  .text(money(grandTotal), cx, cy - 4)
  .attr({ align: "center" })
  .css({ color: t.ink, fontSize: "24px", fontWeight: "700" })
  .add(g);
chart.renderer
  .text("total spend / year", cx, cy + 20)
  .attr({ align: "center" })
  .css({ color: t.inkSoft, fontSize: "13px" })
  .add(g);

// Static-frame timing signal for the harness.
window.__anyplotReady = true;
Runnable source as JSON, for any HTTP client: https://api.anyplot.ai/specs/sunburst-basic/highcharts/code. Any spec id and library id listed in llms-full.txt fit the same URL shape; every URL below is complete and callable.
{
  "spec_id": "sunburst-basic",
  "language": "javascript",
  "library": "highcharts",
  "page": "https://anyplot.ai/sunburst-basic/javascript/highcharts",
  "hub": "https://anyplot.ai/sunburst-basic",
  "code_json": "https://api.anyplot.ai/specs/sunburst-basic/highcharts/code",
  "spec_json": "https://api.anyplot.ai/specs/sunburst-basic",
  "render_light_png": "https://storage.googleapis.com/anyplot-images/plots/sunburst-basic/javascript/highcharts/plot-light.png",
  "render_dark_png": "https://storage.googleapis.com/anyplot-images/plots/sunburst-basic/javascript/highcharts/plot-dark.png",
  "interactive_light_html": "https://storage.googleapis.com/anyplot-images/plots/sunburst-basic/javascript/highcharts/plot-light.html",
  "interactive_dark_html": "https://storage.googleapis.com/anyplot-images/plots/sunburst-basic/javascript/highcharts/plot-dark.html",
  "quality_score": 91.0,
  "license": "MIT",
  "guide": "https://anyplot.ai/llms.txt"
}
Part of Basic Sunburst Chart on anyplot.ai.