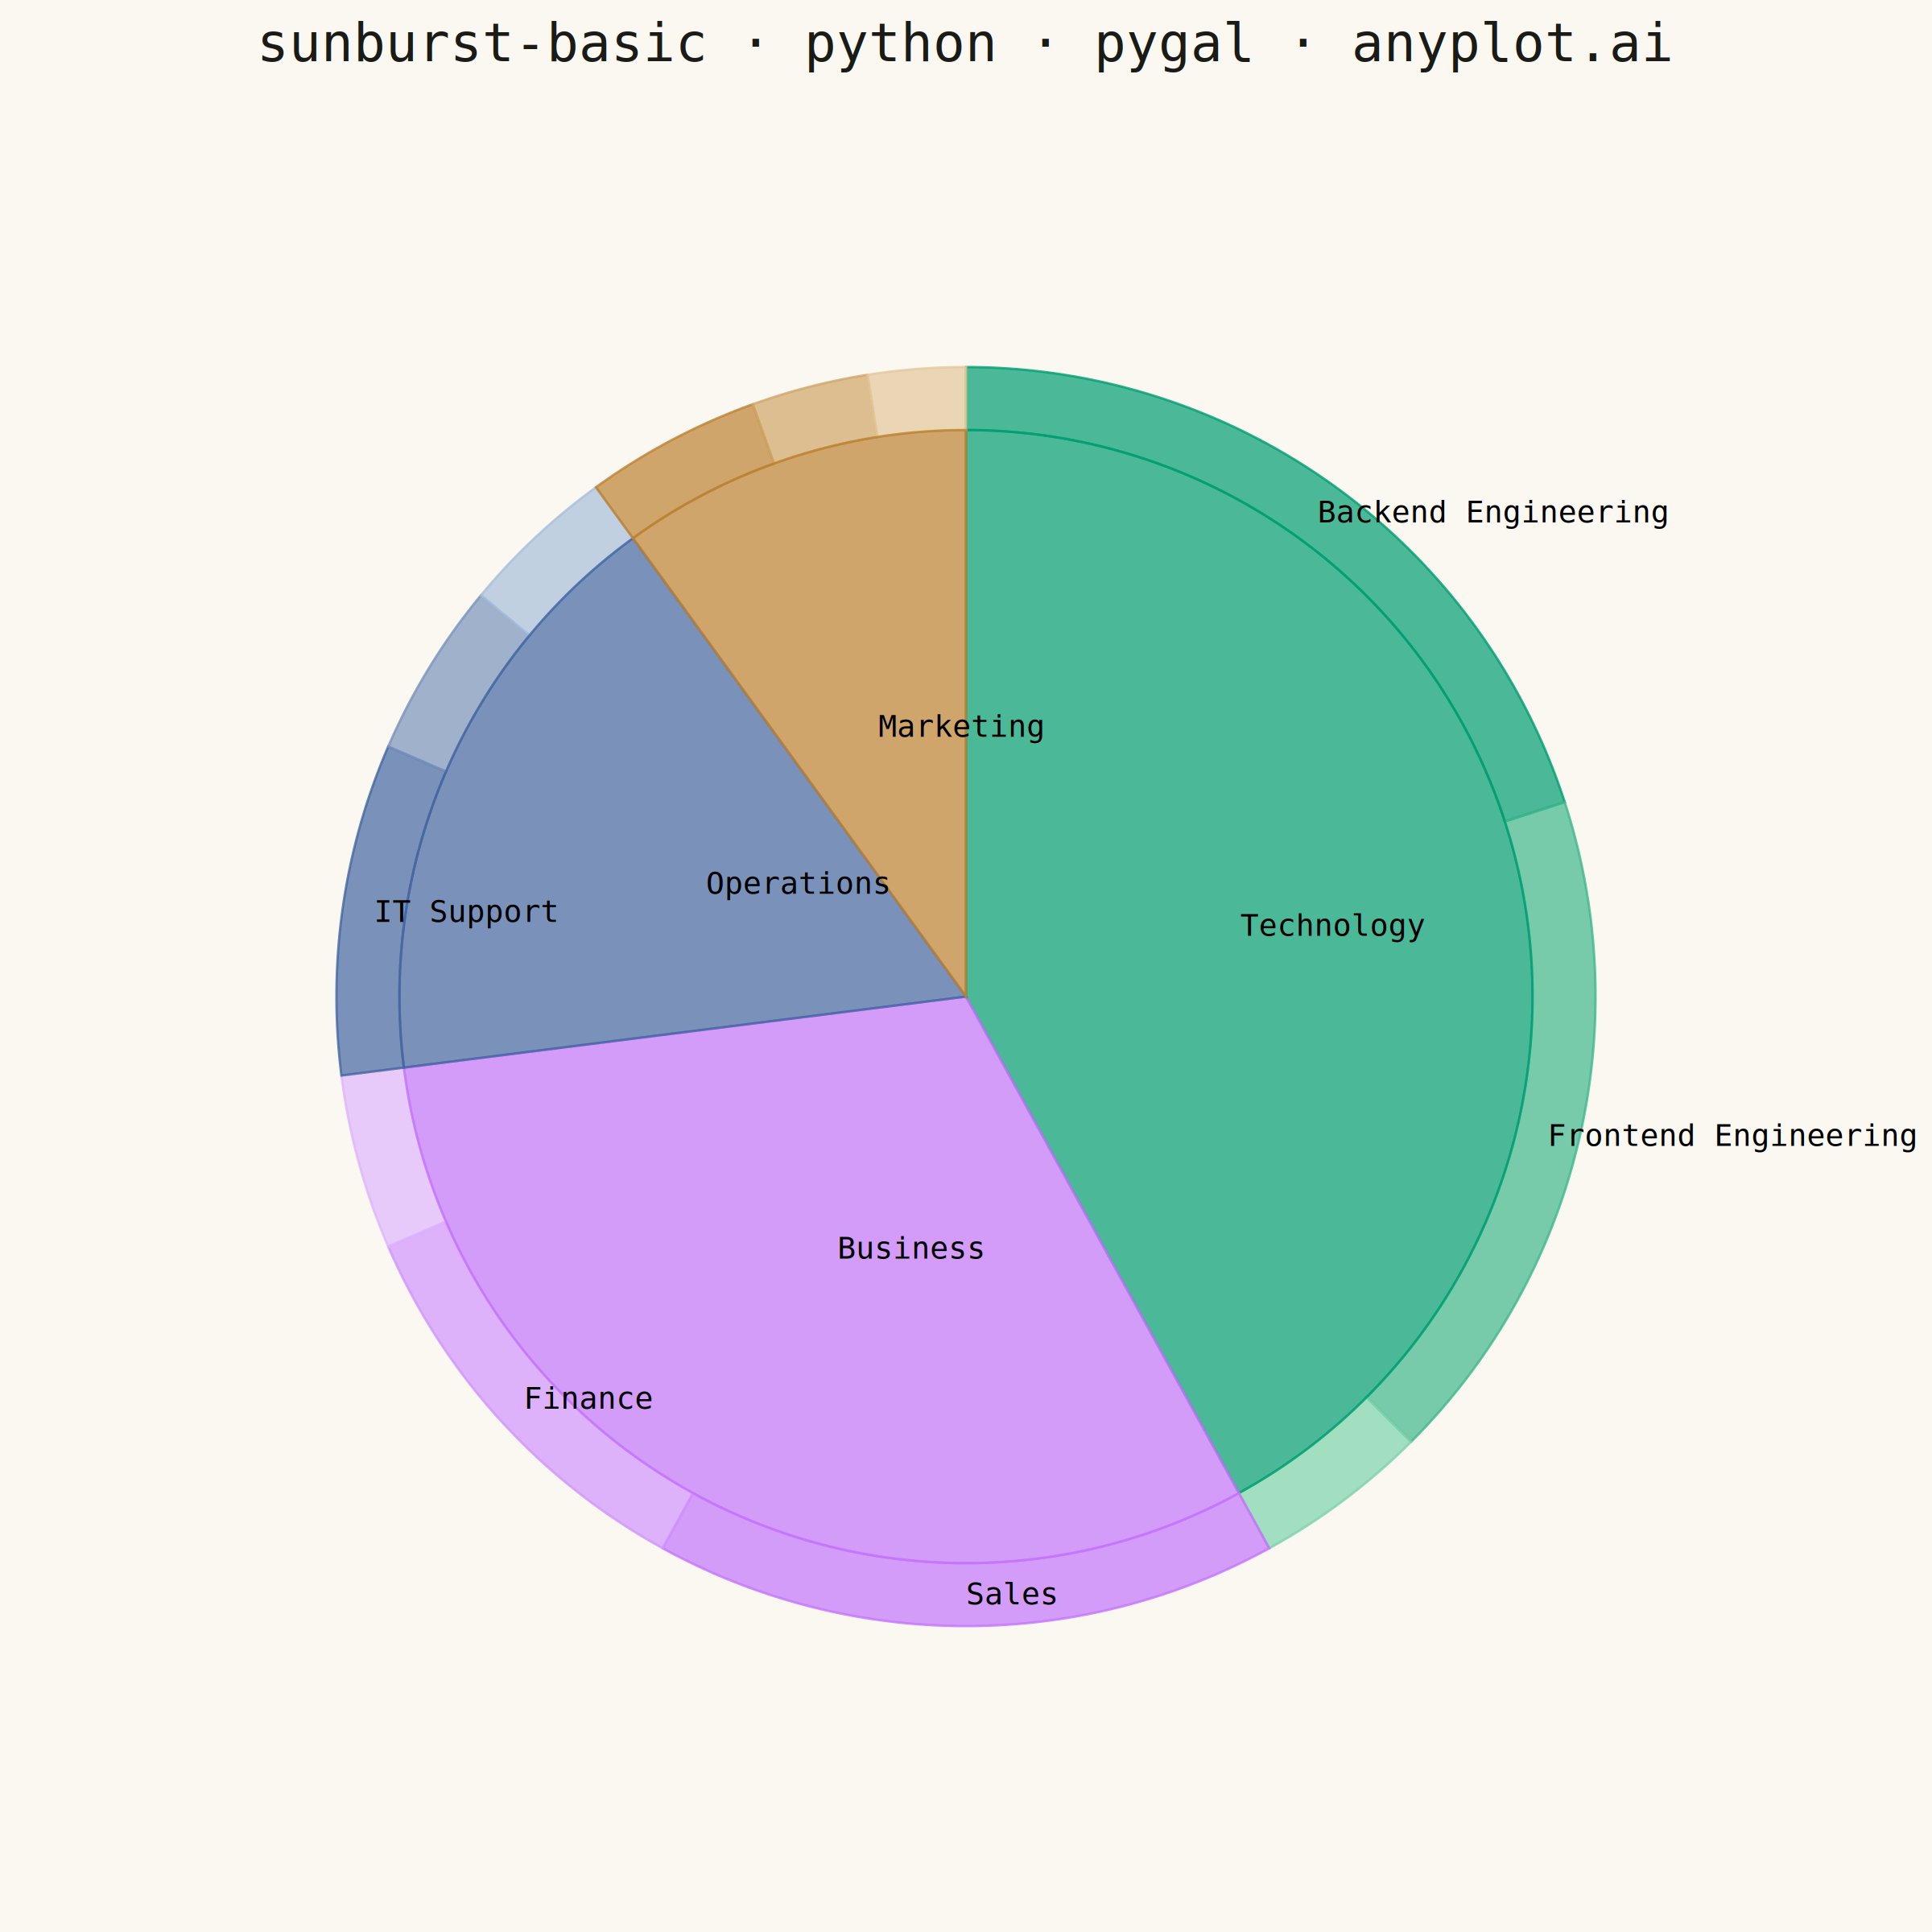
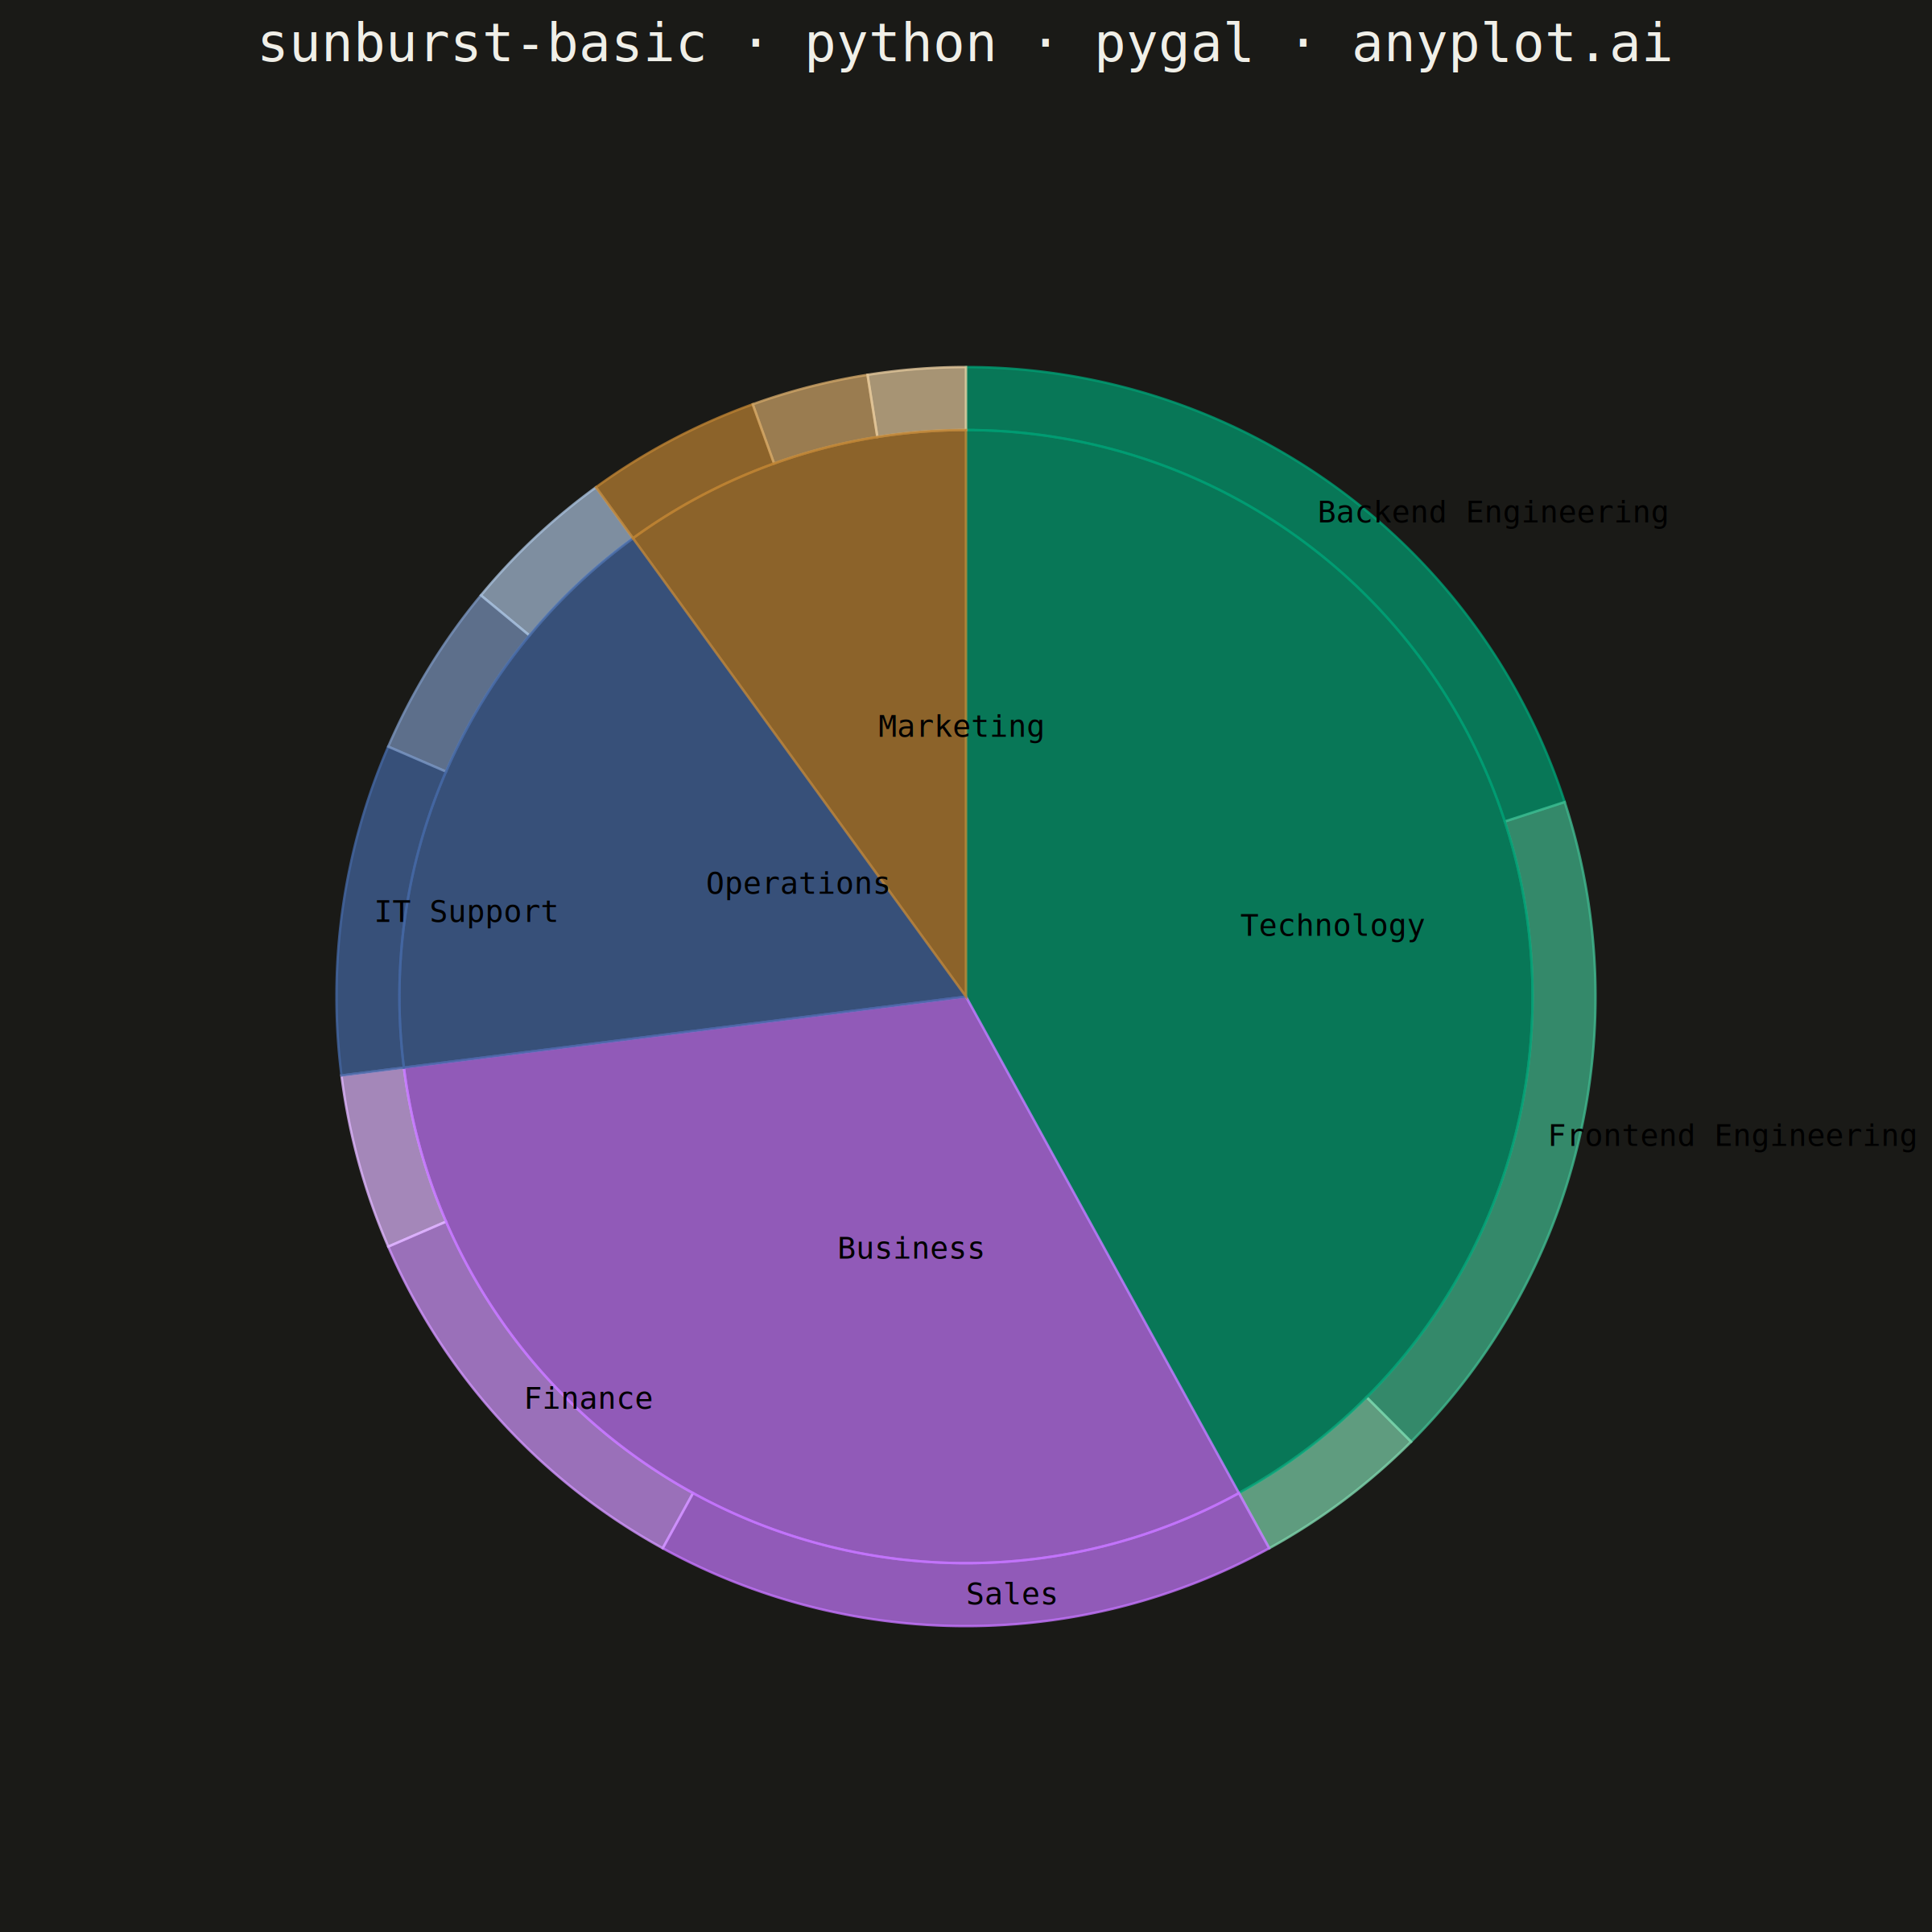
A sunburst chart displays hierarchical data as concentric rings, where each ring represents a level in the hierarchy. Inner rings show parent categories while outer rings show their children, with segment angles proportional to values. This radial visualization excels at revealing hierarchical structures and part-to-whole relationships across multiple levels simultaneously.
""" anyplot.ai
sunburst-basic: Basic Sunburst Chart
Library: pygal 3.1.3 | Python 3.13.14
Quality: 75/100 | Updated: 2026-07-26
"""

import os
import re

import cairosvg
import pygal
from pygal.style import Style


THEME = os.getenv("ANYPLOT_THEME", "light")
PAGE_BG = "#FAF8F1" if THEME == "light" else "#1A1A17"
INK = "#1A1A17" if THEME == "light" else "#F0EFE8"
INK_MUTED = "#6B6A63" if THEME == "light" else "#A8A79F"

# All 4 Imprint wedge hues are dark enough that pygal auto-picks BLACK
# print_labels text (contrast-matched against the wedge fill it normally
# sits on). But a few team labels land past the disk's outer edge on the
# plain page background instead of on a wedge; there pygal's per-series
# fill has no way to know it's off-wedge, so in dark theme black text goes
# invisible on the near-black canvas. A thin light halo (independent of
# THEME, since the black fill itself is theme-independent) keeps every
# label legible everywhere it can land, without touching on-wedge contrast.
LABEL_HALO = "#F0EFE8"

IMPRINT = ("#009E73", "#C475FD", "#4467A3", "#BD8233")

custom_style = Style(
    background=PAGE_BG,
    plot_background=PAGE_BG,
    foreground=INK,
    foreground_strong=INK,
    foreground_subtle=INK_MUTED,
    colors=IMPRINT,
    title_font_size=66,
    label_font_size=56,
    major_label_font_size=40,
    legend_font_size=44,
    value_font_size=36,
    value_label_font_size=38,
    stroke_width=3,
)

# Organizational budget breakdown (in $K). Each department is added as its
# own pygal series (its teams are that series' datapoints), NOT as two
# parallel "Departments" + "Teams" series. That distinction is what makes
# pygal's multi-series "dual" Pie mode produce a genuine sunburst: dual mode
# sizes each series' coarse inner wedge by that series' OWN value sum, and
# subdivides its thin outer-ring arc by its own datapoints. With one series
# per department, the inner disk becomes 4 wedges sized by true department
# share, and each wedge's outer arc subdivides proportionally by that
# department's teams. (A "Departments" + "Teams" series pair does not work:
# both series always sum to the same grand total, so their coarse wedges
# would always split 50/50 no matter what the real department shares are.)
#
# Every department lists exactly the same number of teams (3): pygal pads
# shorter series with a trailing zero-value point to match the longest
# series, which would silently steal the "last datapoint" slot the trick
# below depends on.
#
# Within each department, the smallest team is listed last. pygal's dual
# mode paints the coarse (department-level) wedge using the metadata of the
# LAST datapoint drawn, so giving that entry `label=<department name>`
# is what puts the department name on the big inner wedge. Its own outer
# sliver stays label-free because pygal only prints a datapoint's label when
# its angular span is at least ~17 degrees (0.3 radians), and each smallest
# team is kept under that share by construction; its `tooltip` still
# surfaces the real team name on hover.
departments = [
    (
        "Technology",
        [
            ("Backend Engineering", "#009E73", 200),
            ("Frontend Engineering", "#40B88E", 175),
            ("Data Science", "#7DD3AB", 45),
        ],
    ),
    ("Business", [("Sales", "#C475FD", 160), ("Finance", "#D195FE", 105), ("Legal", "#DEB5FE", 45)]),
    ("Operations", [("IT Support", "#4467A3", 85), ("Human Resources", "#7A93BD", 45), ("Facilities", "#A8BFDA", 40)]),
    (
        "Marketing",
        [("Brand Design", "#BD8233", 45), ("Digital Marketing", "#D1A668", 30), ("Content Marketing", "#E3C89C", 25)],
    ),
]

chart = pygal.Pie(
    style=custom_style,
    width=2400,
    height=2400,
    title="sunburst-basic · python · pygal · anyplot.ai",
    show_legend=False,
    print_labels=True,
    print_values=False,
    margin=380,
)

for dept_name, teams in departments:
    points = [{"value": value, "color": color, "label": name, "tooltip": name} for name, color, value in teams[:-1]]
    carrier_name, carrier_color, carrier_value = teams[-1]
    points.append({"value": carrier_value, "color": carrier_color, "label": dept_name, "tooltip": carrier_name})
    chart.add(dept_name, points)

svg = chart.render(is_unicode=True)
chart_id = re.search(r'id="(chart-[^"]+)"', svg).group(1)
# pygal's base stylesheet ships `#chart-id text, #chart-id tspan
# {stroke:none!important}`, which would otherwise strip the halo above -
# match its id-scoped specificity (plus !important) to win the cascade.
svg = svg.replace(
    '<style type="text/css">',
    f'<style type="text/css">#{chart_id} .text-overlay text.label '
    f"{{stroke:{LABEL_HALO} !important;stroke-width:2px !important;"
    f"stroke-linejoin:round !important;}}",
    1,
)

cairosvg.svg2png(bytestring=svg.encode("utf-8"), write_to=f"plot-{THEME}.png", dpi=72)
with open(f"plot-{THEME}.html", "w", encoding="utf-8") as f:
    f.write(svg)
Runnable source as JSON, for any HTTP client: https://api.anyplot.ai/specs/sunburst-basic/pygal/code. Any spec id and library id listed in llms-full.txt fit the same URL shape; every URL below is complete and callable.
{
  "spec_id": "sunburst-basic",
  "language": "python",
  "library": "pygal",
  "page": "https://anyplot.ai/sunburst-basic/python/pygal",
  "hub": "https://anyplot.ai/sunburst-basic",
  "code_json": "https://api.anyplot.ai/specs/sunburst-basic/pygal/code",
  "spec_json": "https://api.anyplot.ai/specs/sunburst-basic",
  "render_light_png": "https://storage.googleapis.com/anyplot-images/plots/sunburst-basic/python/pygal/plot-light.png",
  "render_dark_png": "https://storage.googleapis.com/anyplot-images/plots/sunburst-basic/python/pygal/plot-dark.png",
  "interactive_light_html": "https://storage.googleapis.com/anyplot-images/plots/sunburst-basic/python/pygal/plot-light.html",
  "interactive_dark_html": "https://storage.googleapis.com/anyplot-images/plots/sunburst-basic/python/pygal/plot-dark.html",
  "quality_score": 75.0,
  "license": "MIT",
  "guide": "https://anyplot.ai/llms.txt"
}
Part of Basic Sunburst Chart on anyplot.ai.