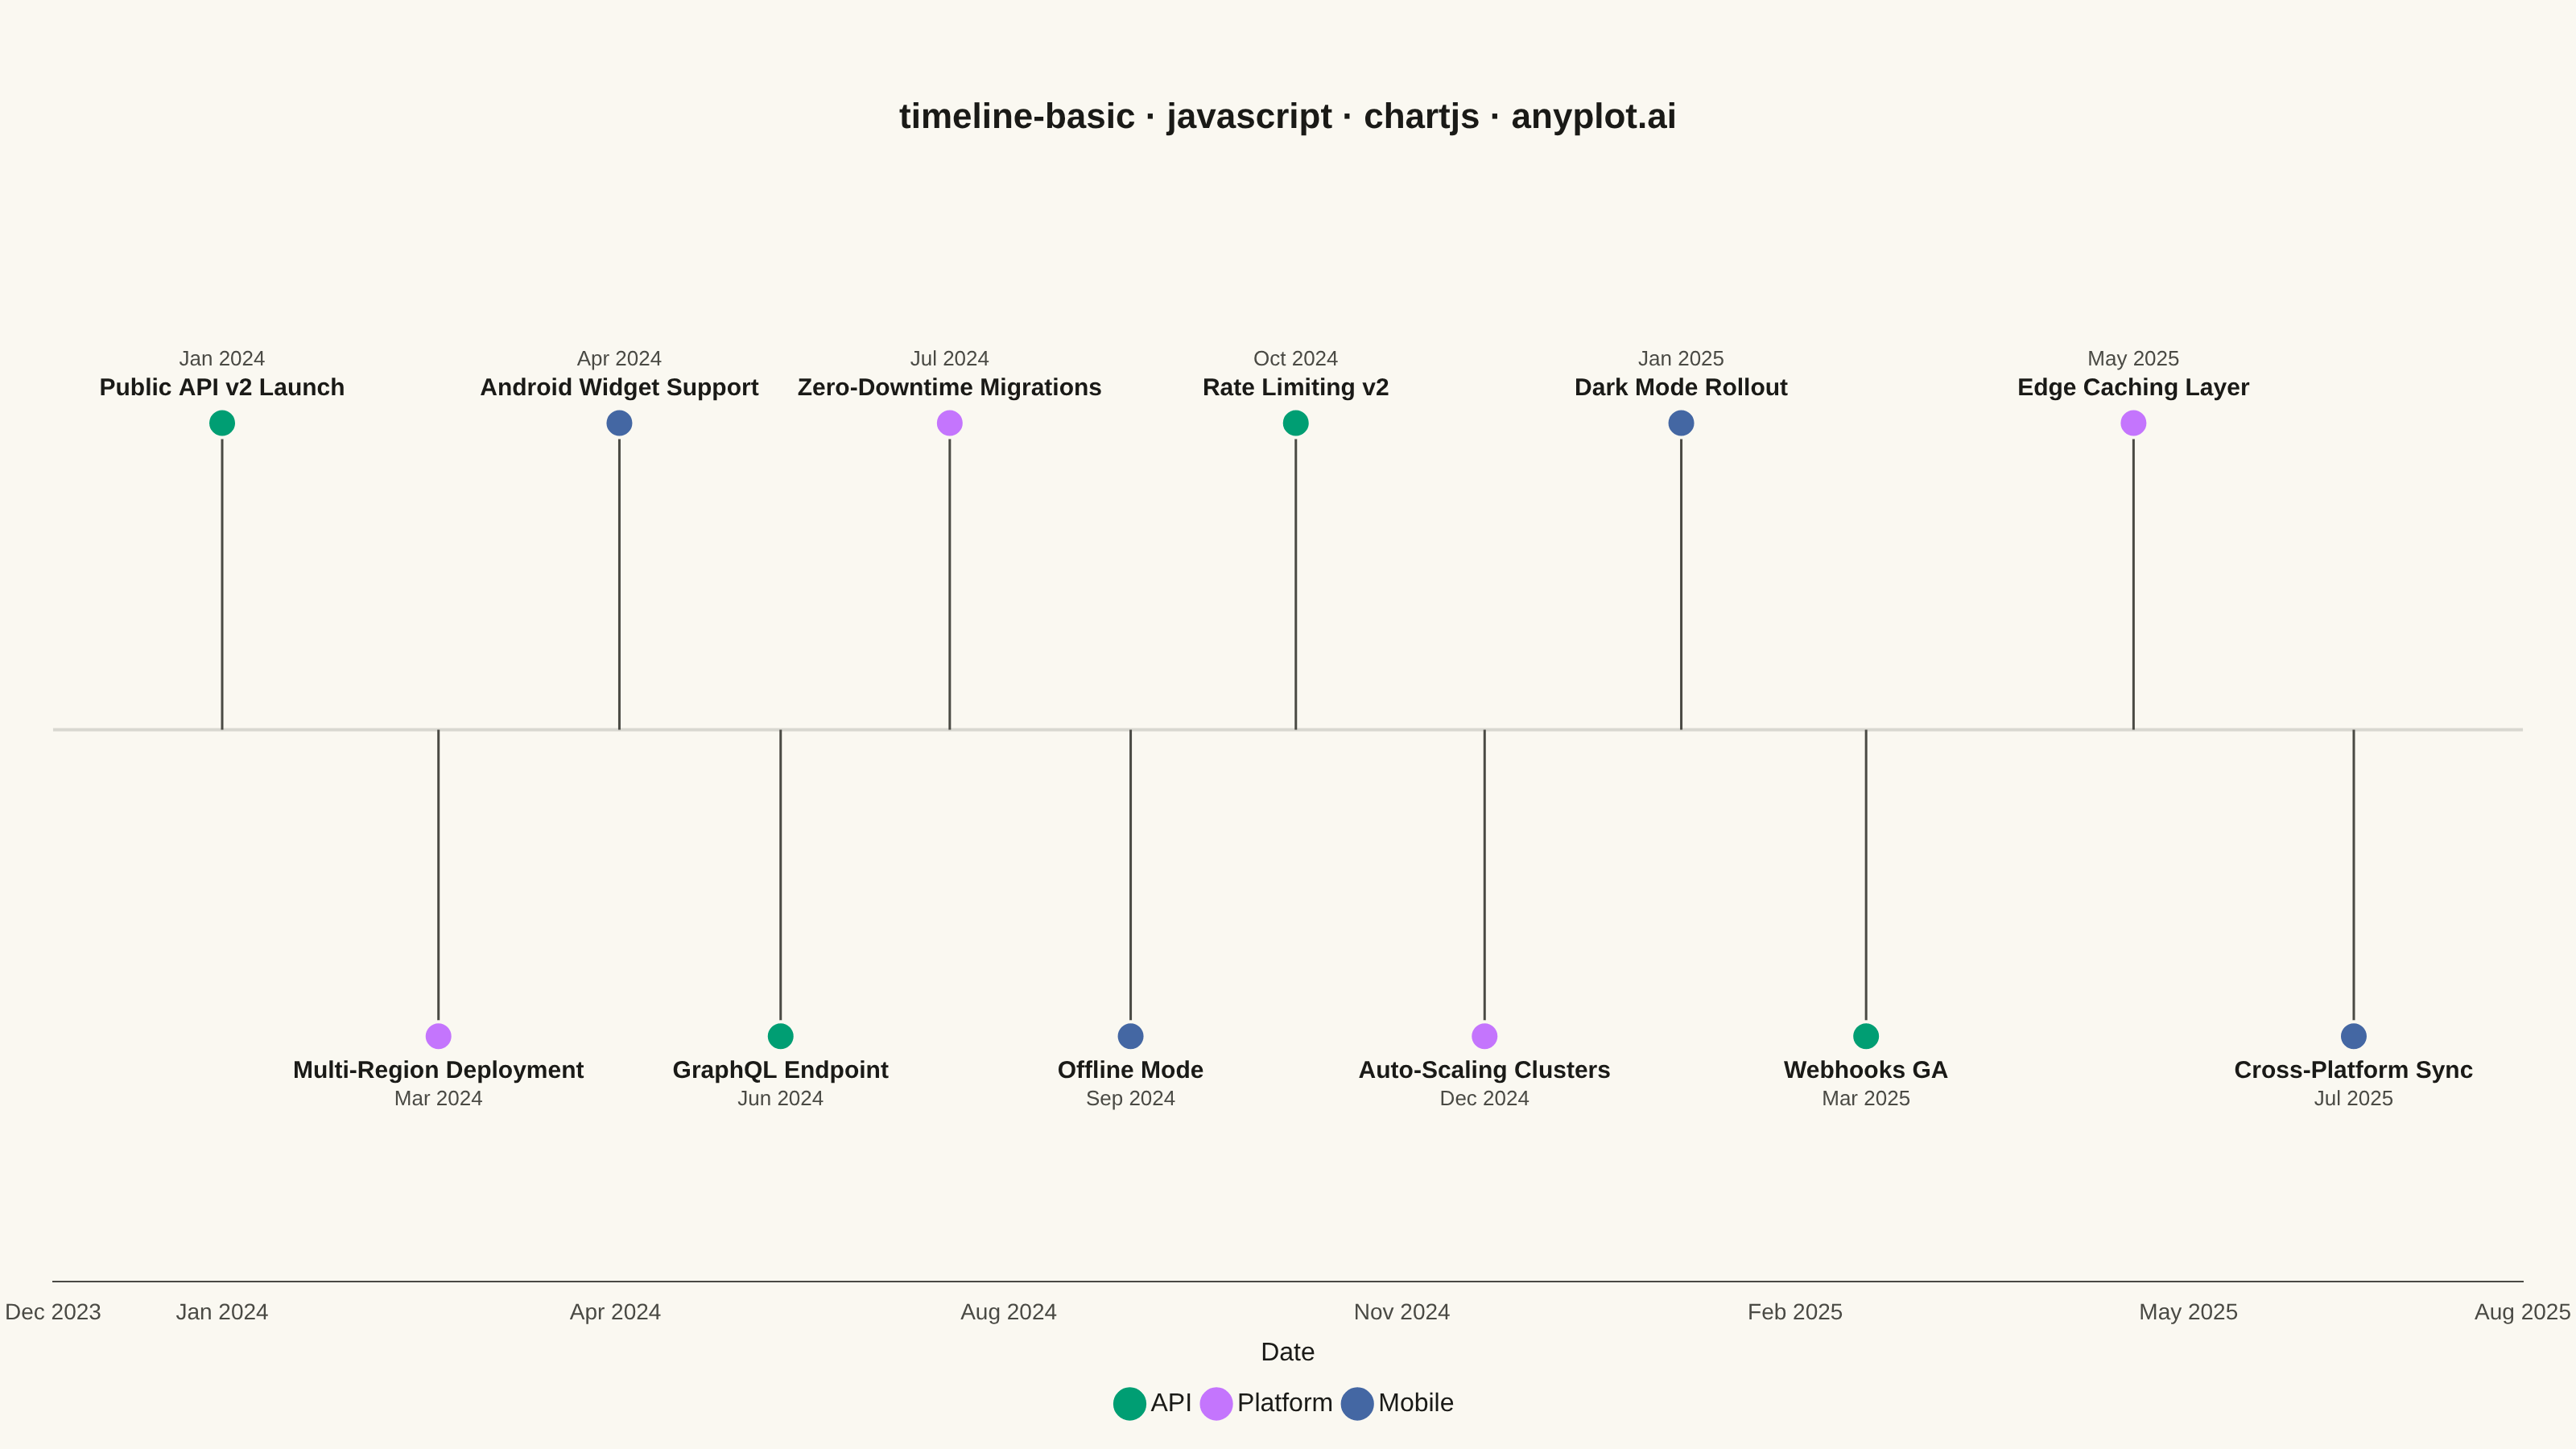
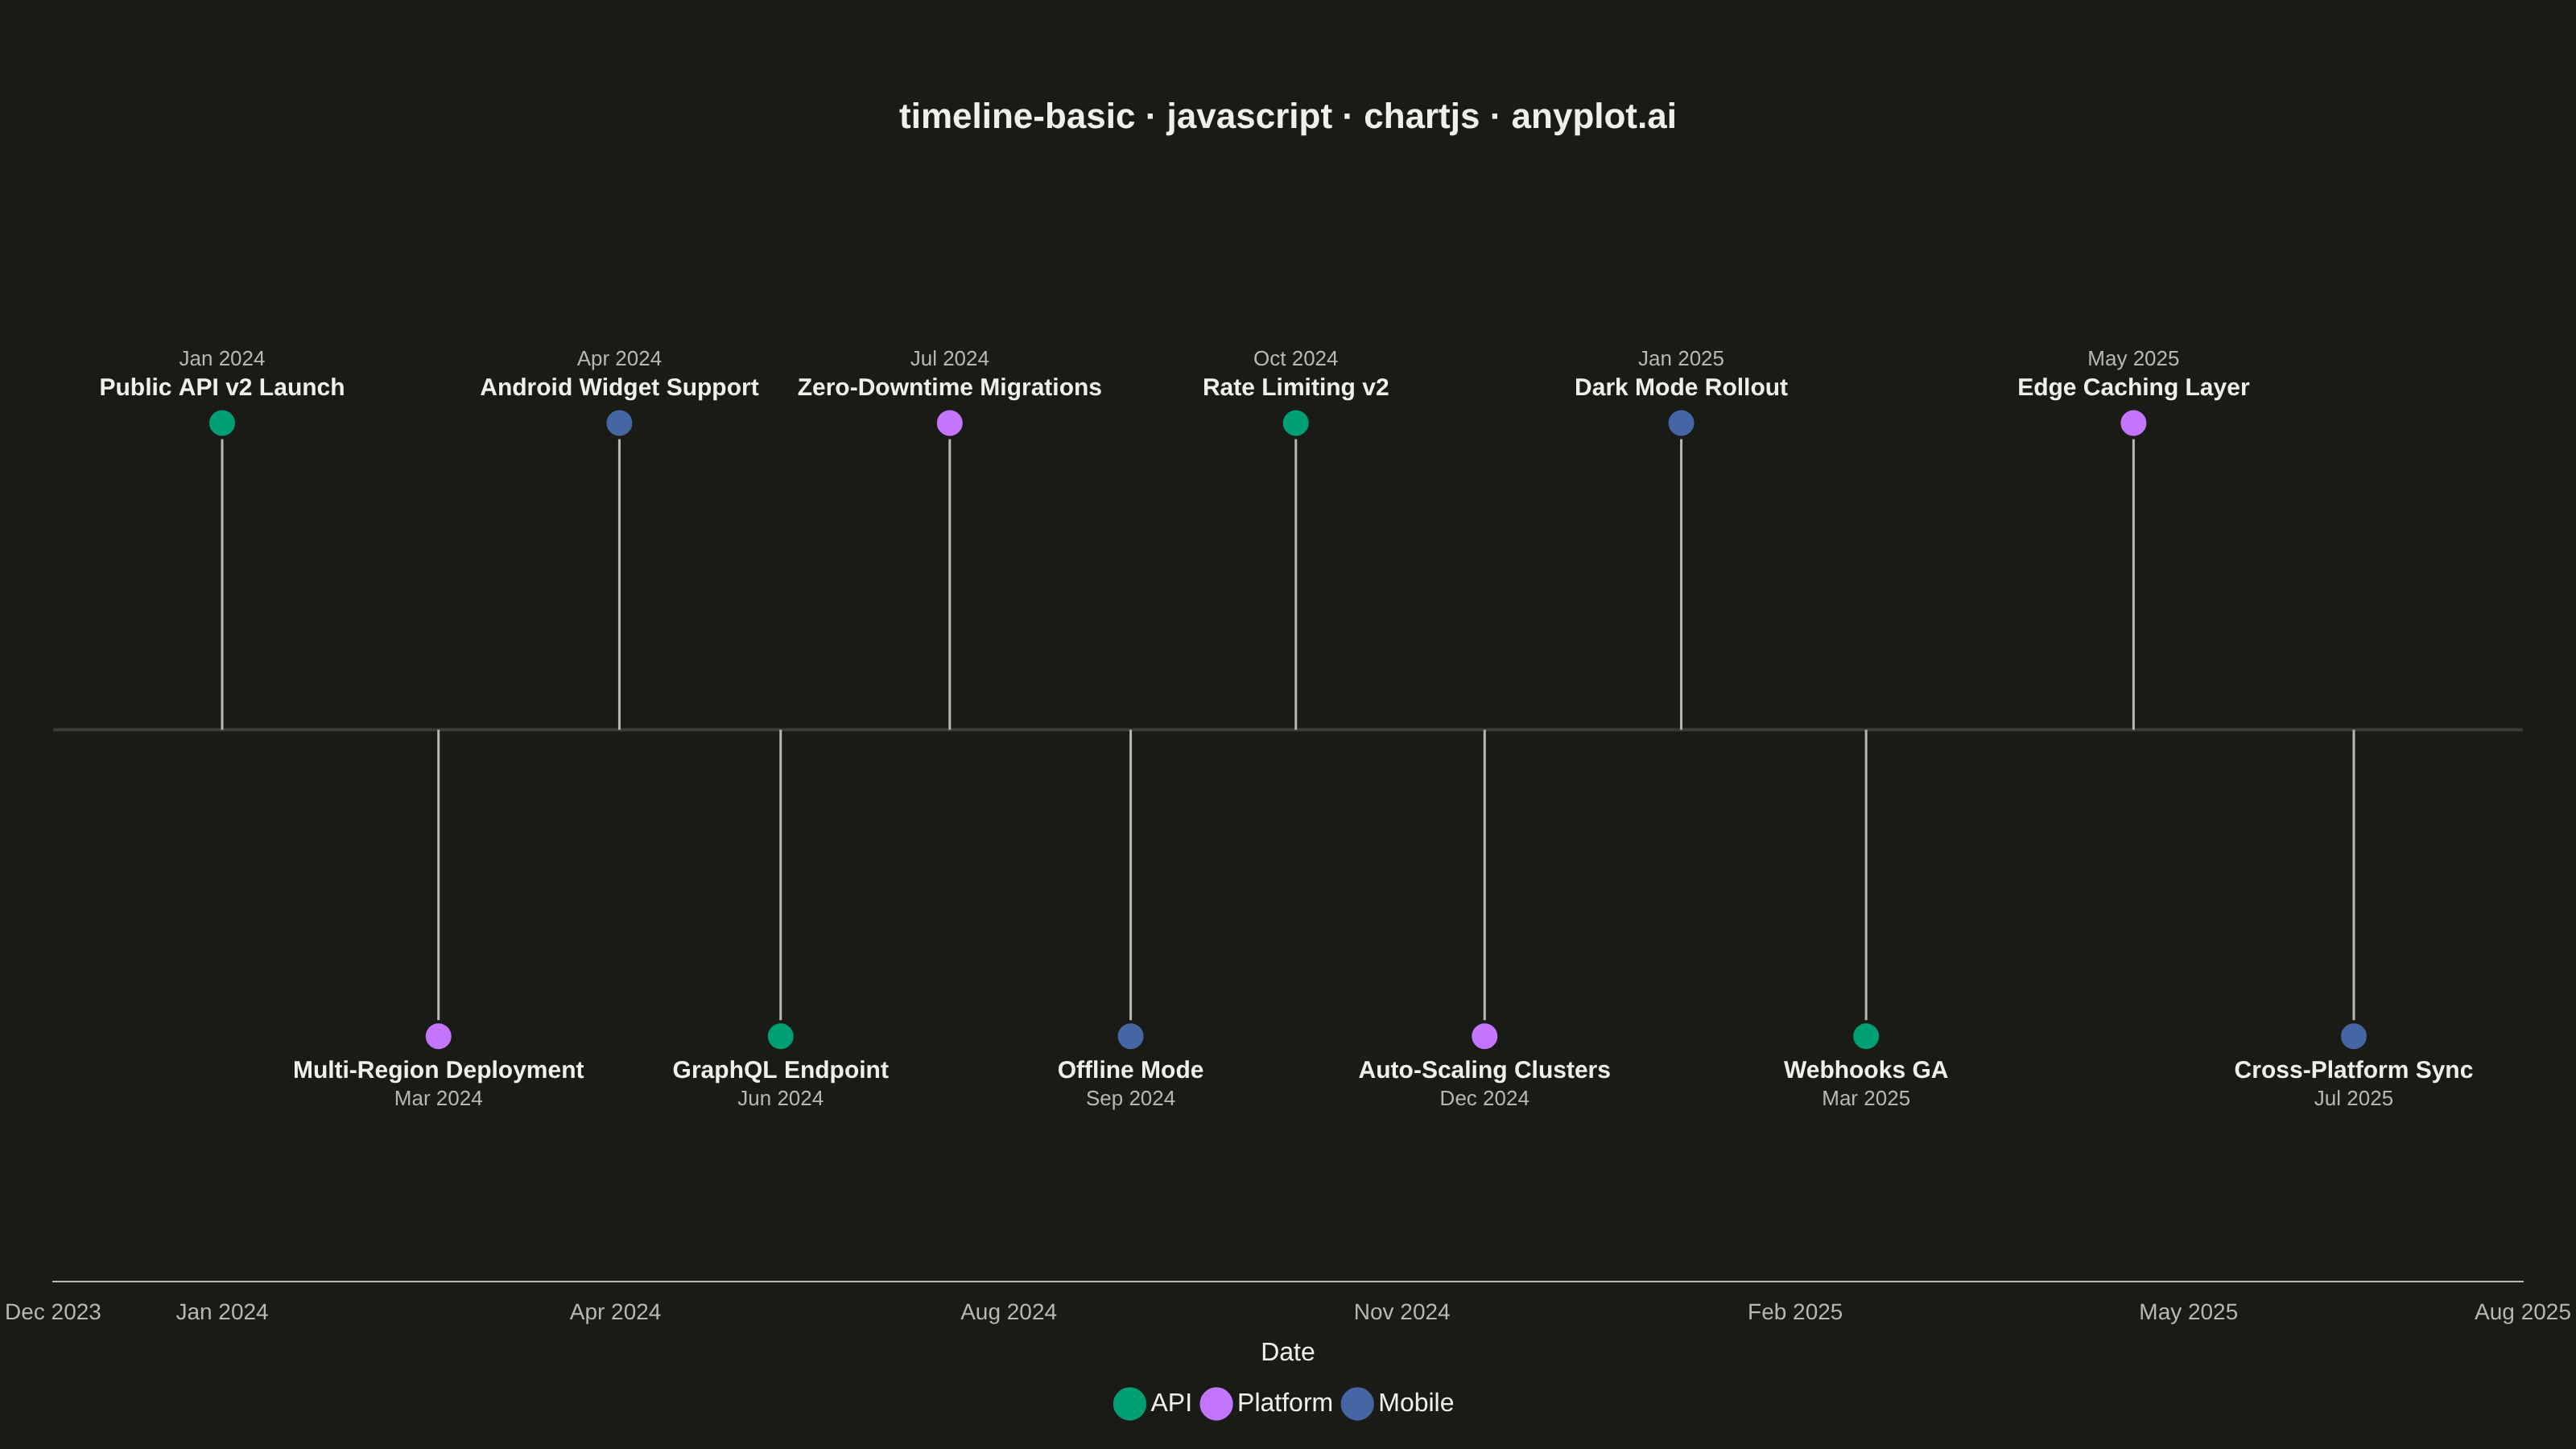
The same plot in 14 other libraries — JavaScript: D3.js, Apache ECharts, Highcharts, MUI X Charts; Python: Altair, Bokeh, lets-plot, Matplotlib, Plotly, plotnine, Pygal, Seaborn; R: ggplot2; Julia: Makie.jl. Compare all 15 side by side: Event Timeline in Python, R, Julia and JavaScript.
A timeline visualization that displays events and milestones along a temporal axis. Events are represented as points or markers with accompanying labels, making it easy to understand the sequence and timing of events. This plot type excels at showing chronological progressions and is particularly effective for communicating project phases, historical events, or any time-ordered sequence of occurrences.
// anyplot.ai
// timeline-basic: Event Timeline
// Library: chartjs 4.4.7 | JavaScript 22.23.2
// Quality: 91/100 | Created: 2026-09-09

const t = window.ANYPLOT_TOKENS;

// --- Data (in-memory, deterministic) ---------------------------------------
// Cloud platform product roadmap, chronological, alternating above/below the
// spine to avoid label overlap.
const roadmap = [
  { date: "2024-01-15", event: "Public API v2 Launch", category: "API" },
  { date: "2024-03-10", event: "Multi-Region Deployment", category: "Platform" },
  { date: "2024-04-25", event: "Android Widget Support", category: "Mobile" },
  { date: "2024-06-05", event: "GraphQL Endpoint", category: "API" },
  { date: "2024-07-18", event: "Zero-Downtime Migrations", category: "Platform" },
  { date: "2024-09-02", event: "Offline Mode", category: "Mobile" },
  { date: "2024-10-14", event: "Rate Limiting v2", category: "API" },
  { date: "2024-12-01", event: "Auto-Scaling Clusters", category: "Platform" },
  { date: "2025-01-20", event: "Dark Mode Rollout", category: "Mobile" },
  { date: "2025-03-08", event: "Webhooks GA", category: "API" },
  { date: "2025-05-15", event: "Edge Caching Layer", category: "Platform" },
  { date: "2025-07-10", event: "Cross-Platform Sync", category: "Mobile" },
];

const MS_PER_DAY = 86_400_000;
const baseDate = new Date(roadmap[0].date);
const dayOffset = (isoDate) => Math.round((new Date(isoDate) - baseDate) / MS_PER_DAY);
const formatDate = (days) => {
  const d = new Date(baseDate.getTime() + days * MS_PER_DAY);
  return d.toLocaleDateString("en-US", { month: "short", year: "numeric" });
};

const categories = ["API", "Platform", "Mobile"];
const points = roadmap.map((row, i) => ({
  x: dayOffset(row.date),
  y: i % 2 === 0 ? 1 : -1,
  event: row.event,
  dateLabel: formatDate(dayOffset(row.date)),
  category: row.category,
}));

const lastDay = points[points.length - 1].x;
const xPadding = Math.round(lastDay * 0.08);

const datasets = categories.map((category, i) => ({
  label: category,
  data: points.filter((p) => p.category === category),
  backgroundColor: t.palette[i],
  borderColor: t.pageBg,
  borderWidth: 2,
  pointRadius: 9,
  pointHoverRadius: 9,
  showLine: false,
}));

// --- Mount -------------------------------------------------------------------
const canvas = document.createElement("canvas");
document.getElementById("container").appendChild(canvas);

// --- Custom plugin: spine + stems (behind markers), labels (above markers) --
const timelineDecorations = {
  id: "timelineDecorations",
  beforeDatasetsDraw(chart) {
    const { ctx, chartArea, scales } = chart;
    const spineY = scales.y.getPixelForValue(0);

    ctx.save();
    ctx.strokeStyle = t.grid;
    ctx.lineWidth = 2;
    ctx.beginPath();
    ctx.moveTo(chartArea.left, spineY);
    ctx.lineTo(chartArea.right, spineY);
    ctx.stroke();

    ctx.strokeStyle = t.inkSoft;
    ctx.lineWidth = 1.5;
    for (const dataset of chart.data.datasets) {
      for (const point of dataset.data) {
        const px = scales.x.getPixelForValue(point.x);
        const py = scales.y.getPixelForValue(point.y);
        ctx.beginPath();
        ctx.moveTo(px, spineY);
        ctx.lineTo(px, py);
        ctx.stroke();
      }
    }
    ctx.restore();
  },
  afterDatasetsDraw(chart) {
    const { ctx, scales } = chart;

    ctx.save();
    for (const dataset of chart.data.datasets) {
      for (const point of dataset.data) {
        const px = scales.x.getPixelForValue(point.x);
        const py = scales.y.getPixelForValue(point.y);
        const above = point.y > 0;

        ctx.textAlign = "center";
        ctx.textBaseline = above ? "bottom" : "top";

        const labelY = above ? py - 14 : py + 14;
        ctx.fillStyle = t.ink;
        ctx.font = "600 15px sans-serif";
        ctx.fillText(point.event, px, labelY);

        const dateY = above ? labelY - 19 : labelY + 19;
        ctx.fillStyle = t.inkSoft;
        ctx.font = "13px sans-serif";
        ctx.fillText(point.dateLabel, px, dateY);
      }
    }
    ctx.restore();
  },
};

// --- Chart --------------------------------------------------------------------
new Chart(canvas, {
  type: "scatter",
  data: { datasets },
  options: {
    responsive: true,
    maintainAspectRatio: false,
    animation: false,
    layout: { padding: { top: 60, bottom: 10, left: 20, right: 20 } },
    plugins: {
      title: {
        display: true,
        text: "timeline-basic · javascript · chartjs · anyplot.ai",
        color: t.ink,
        font: { size: 22 },
        padding: { bottom: 24 },
      },
      legend: {
        position: "bottom",
        labels: { color: t.ink, font: { size: 16 }, usePointStyle: true, boxWidth: 10 },
      },
      tooltip: { enabled: false },
    },
    scales: {
      x: {
        type: "linear",
        min: -xPadding,
        max: lastDay + xPadding,
        ticks: {
          color: t.inkSoft,
          font: { size: 14 },
          maxTicksLimit: 8,
          callback: (value) => formatDate(value),
        },
        grid: { display: false },
        border: { color: t.inkSoft },
        title: { display: true, text: "Date", color: t.ink, font: { size: 16 } },
      },
      y: {
        display: false,
        min: -1.8,
        max: 1.8,
      },
    },
  },
  plugins: [timelineDecorations],
});
Runnable source as JSON, for any HTTP client: https://api.anyplot.ai/specs/timeline-basic/chartjs/code. Any spec id and library id listed in llms-full.txt fit the same URL shape; every URL below is complete and callable.
{
  "spec_id": "timeline-basic",
  "language": "javascript",
  "library": "chartjs",
  "page": "https://anyplot.ai/timeline-basic/javascript/chartjs",
  "hub": "https://anyplot.ai/timeline-basic",
  "code_json": "https://api.anyplot.ai/specs/timeline-basic/chartjs/code",
  "spec_json": "https://api.anyplot.ai/specs/timeline-basic",
  "render_light_png": "https://storage.googleapis.com/anyplot-images/plots/timeline-basic/javascript/chartjs/plot-light.png",
  "render_dark_png": "https://storage.googleapis.com/anyplot-images/plots/timeline-basic/javascript/chartjs/plot-dark.png",
  "interactive_light_html": "https://storage.googleapis.com/anyplot-images/plots/timeline-basic/javascript/chartjs/plot-light.html",
  "interactive_dark_html": "https://storage.googleapis.com/anyplot-images/plots/timeline-basic/javascript/chartjs/plot-dark.html",
  "quality_score": 91.0,
  "license": "MIT",
  "guide": "https://anyplot.ai/llms.txt"
}
Part of Event Timeline on anyplot.ai.