The same plot in 14 other libraries — Python: Altair, Bokeh, lets-plot, Matplotlib, Plotly, plotnine, Pygal, Seaborn; Julia: Makie.jl; JavaScript: Chart.js, D3.js, Apache ECharts, Highcharts, MUI X Charts. Compare all 15 side by side: Event Timeline in Python, R, Julia and JavaScript.
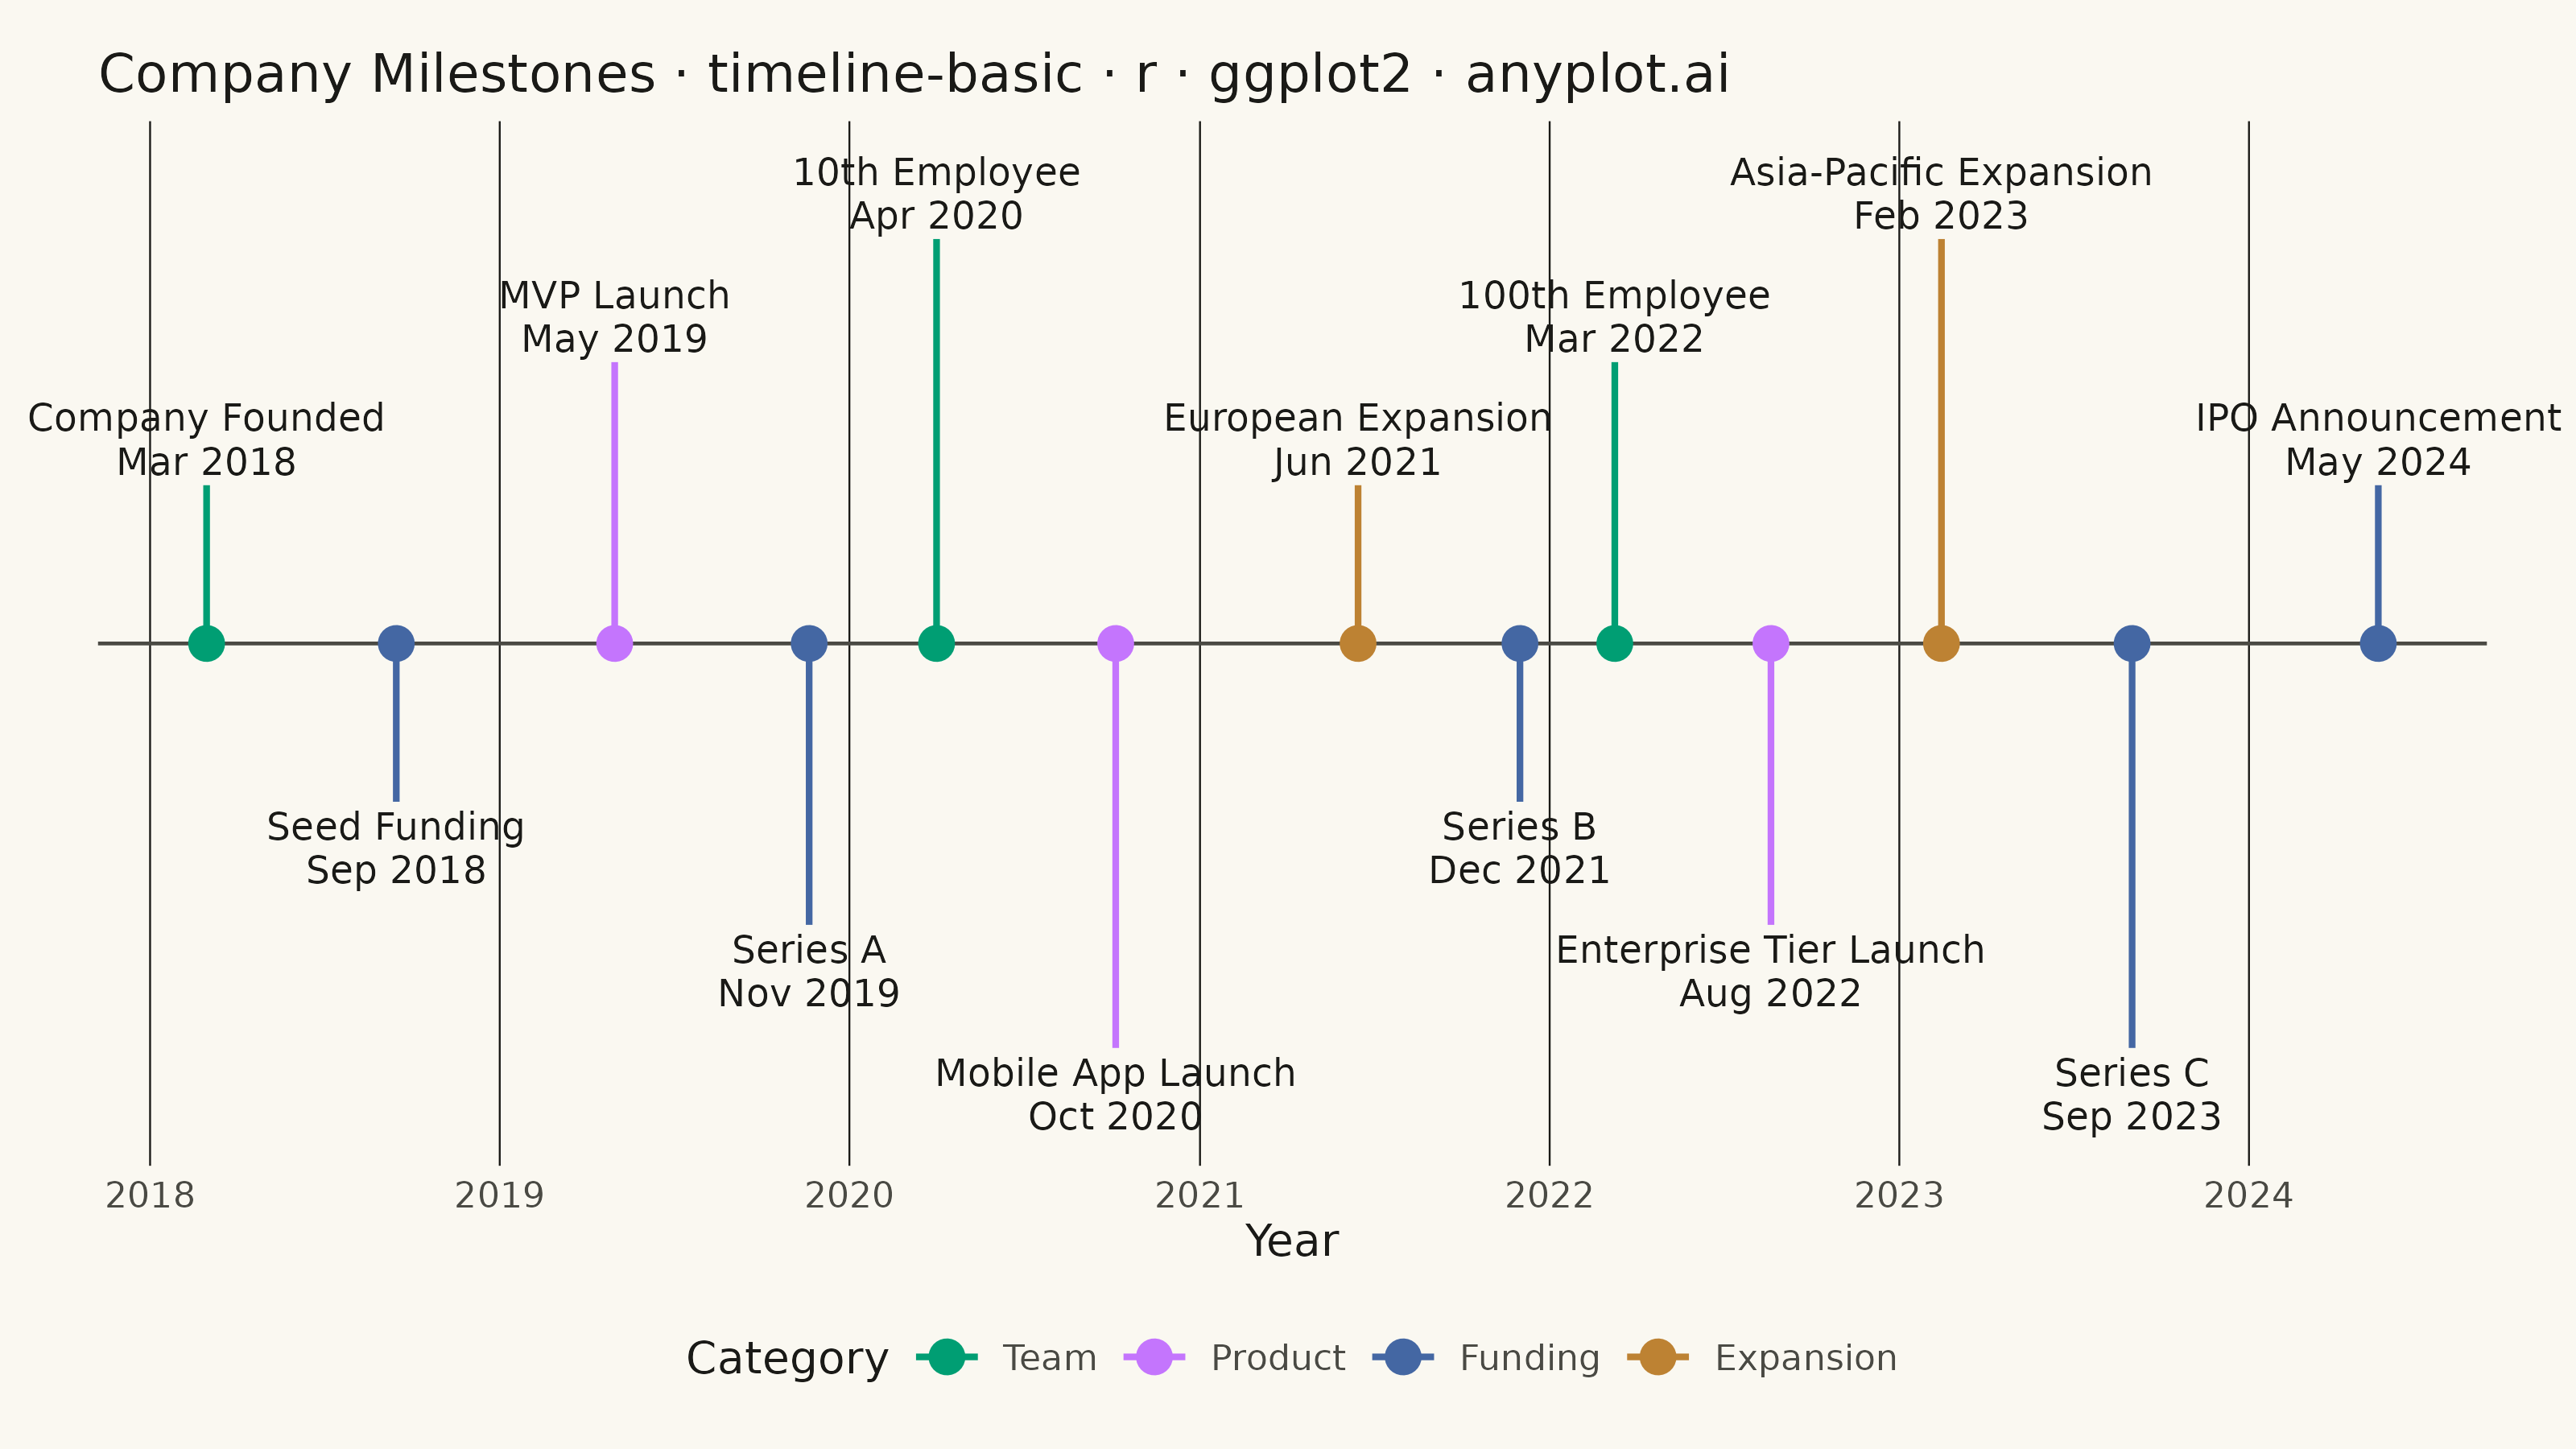
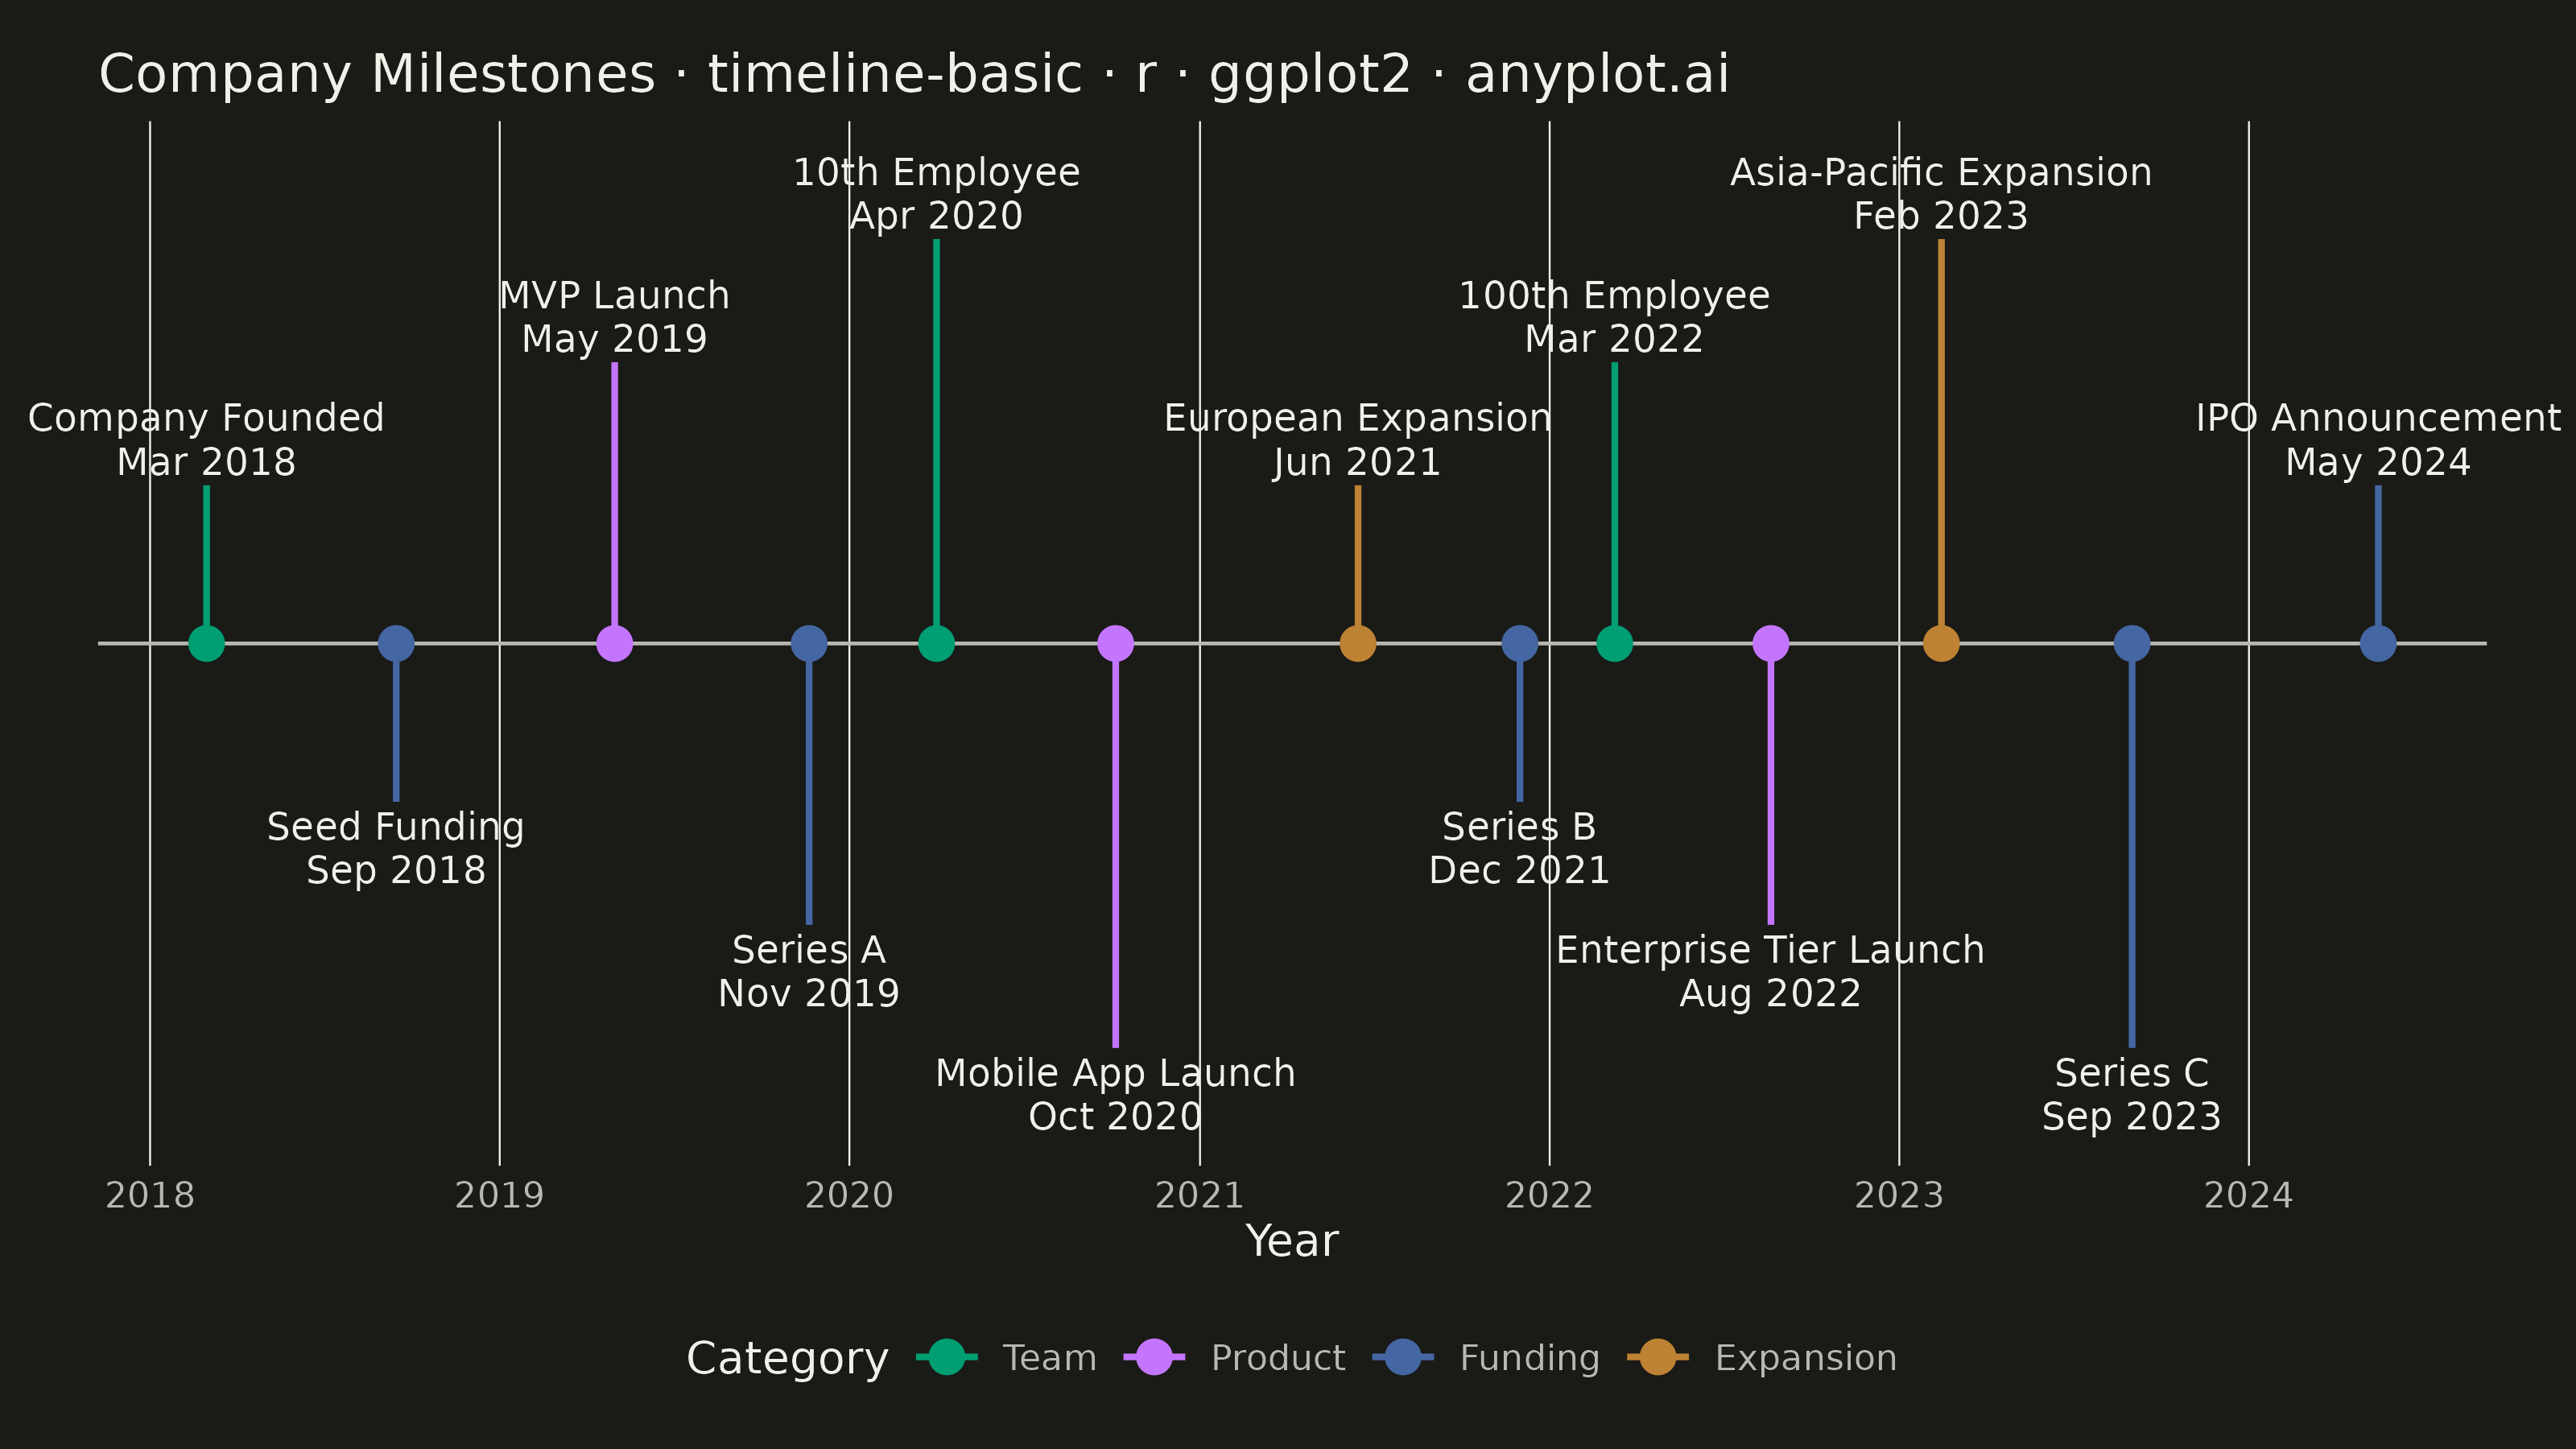
A timeline visualization that displays events and milestones along a temporal axis. Events are represented as points or markers with accompanying labels, making it easy to understand the sequence and timing of events. This plot type excels at showing chronological progressions and is particularly effective for communicating project phases, historical events, or any time-ordered sequence of occurrences.
#' anyplot.ai
#' timeline-basic: Event Timeline
#' Library: ggplot2 3.5.1 | R 4.4.1
#' Quality: 89/100 | Created: 2026-09-09

library(ggplot2)
library(dplyr)
library(ragg)

set.seed(42)

# --- Theme tokens -------------------------------------------------------
THEME       <- Sys.getenv("ANYPLOT_THEME", "light")
PAGE_BG     <- if (THEME == "light") "#FAF8F1" else "#1A1A17"
INK         <- if (THEME == "light") "#1A1A17" else "#F0EFE8"
INK_SOFT    <- if (THEME == "light") "#4A4A44" else "#B8B7B0"

IMPRINT_PALETTE <- c(
  "#009E73", # 1 - Team (brand green)
  "#C475FD", # 2 - Product (lavender)
  "#4467A3", # 3 - Funding (blue)
  "#BD8233"  # 4 - Expansion (ochre)
)

# --- Data: company milestones since founding -----------------------------
milestones <- tibble::tibble(
  date = as.Date(c(
    "2018-03-01", "2018-09-15", "2019-05-01", "2019-11-20",
    "2020-04-01", "2020-10-05", "2021-06-15", "2021-12-01",
    "2022-03-10", "2022-08-20", "2023-02-14", "2023-09-01",
    "2024-05-15"
  )),
  event = c(
    "Company Founded", "Seed Funding", "MVP Launch", "Series A",
    "10th Employee", "Mobile App Launch", "European Expansion", "Series B",
    "100th Employee", "Enterprise Tier Launch", "Asia-Pacific Expansion",
    "Series C", "IPO Announcement"
  ),
  category = factor(
    c(
      "Team", "Funding", "Product", "Funding",
      "Team", "Product", "Expansion", "Funding",
      "Team", "Product", "Expansion", "Funding", "Funding"
    ),
    levels = c("Team", "Product", "Funding", "Expansion")
  )
) %>%
  arrange(date) %>%
  mutate(
    above = row_number() %% 2 == 1,
    label = paste0(event, "\n", format(date, "%b %Y"))
  ) %>%
  group_by(above) %>%
  mutate(tier = (row_number() - 1) %% 3 + 1) %>%
  ungroup() %>%
  mutate(label_y = (0.9 + (tier - 1) * 0.7) * ifelse(above, 1, -1))

# --- Plot -----------------------------------------------------------------
p <- ggplot(milestones) +
  geom_hline(yintercept = 0, color = INK_SOFT, linewidth = 0.4) +
  geom_segment(
    aes(x = date, xend = date, y = 0, yend = label_y, color = category),
    linewidth = 0.7
  ) +
  geom_point(
    aes(x = date, y = 0, color = category),
    size = 3.2
  ) +
  geom_text(
    aes(
      x = date, y = label_y, label = label,
      vjust = ifelse(above, -0.15, 1.15)
    ),
    color = INK, size = 3, lineheight = 0.95, fontface = "plain"
  ) +
  scale_color_manual(values = IMPRINT_PALETTE, name = "Category") +
  scale_x_date(date_breaks = "1 year", date_labels = "%Y") +
  scale_y_continuous(limits = c(-2.7, 2.7)) +
  labs(
    title = "Company Milestones · timeline-basic · r · ggplot2 · anyplot.ai",
    x = "Year",
    y = NULL
  ) +
  theme_minimal(base_size = 8) +
  theme(
    plot.background     = element_rect(fill = PAGE_BG, color = PAGE_BG),
    panel.background    = element_rect(fill = PAGE_BG, color = NA),
    panel.grid.major.x  = element_line(color = INK, linewidth = 0.2),
    panel.grid.minor.x  = element_blank(),
    panel.grid.major.y  = element_blank(),
    panel.grid.minor.y  = element_blank(),
    axis.title.x        = element_text(color = INK, size = 10),
    axis.text.x         = element_text(color = INK_SOFT, size = 8),
    axis.title.y        = element_blank(),
    axis.text.y         = element_blank(),
    axis.ticks          = element_blank(),
    plot.title          = element_text(color = INK, size = 12),
    legend.position     = "bottom",
    legend.background   = element_rect(fill = PAGE_BG, color = NA),
    legend.text         = element_text(color = INK_SOFT, size = 8),
    legend.title        = element_text(color = INK, size = 10),
    plot.margin         = margin(t = 12, r = 20, b = 8, l = 20)
  ) +
  coord_cartesian(clip = "off")

# --- Save -------------------------------------------------------------------
ggsave(
  filename = sprintf("plot-%s.png", THEME),
  plot     = p,
  device   = ragg::agg_png,
  width    = 8,
  height   = 4.5,
  units    = "in",
  dpi      = 400
)
Runnable source as JSON, for any HTTP client: https://api.anyplot.ai/specs/timeline-basic/ggplot2/code. Any spec id and library id listed in llms-full.txt fit the same URL shape; every URL below is complete and callable.
{
  "spec_id": "timeline-basic",
  "language": "r",
  "library": "ggplot2",
  "page": "https://anyplot.ai/timeline-basic/r/ggplot2",
  "hub": "https://anyplot.ai/timeline-basic",
  "code_json": "https://api.anyplot.ai/specs/timeline-basic/ggplot2/code",
  "spec_json": "https://api.anyplot.ai/specs/timeline-basic",
  "render_light_png": "https://storage.googleapis.com/anyplot-images/plots/timeline-basic/r/ggplot2/plot-light.png",
  "render_dark_png": "https://storage.googleapis.com/anyplot-images/plots/timeline-basic/r/ggplot2/plot-dark.png",
  "quality_score": 89.0,
  "license": "MIT",
  "guide": "https://anyplot.ai/llms.txt"
}
Part of Event Timeline on anyplot.ai.