The same plot in 14 other libraries — JavaScript: Chart.js, Apache ECharts, Highcharts, MUI X Charts; Python: Altair, Bokeh, lets-plot, Matplotlib, Plotly, plotnine, Pygal, Seaborn; R: ggplot2; Julia: Makie.jl. Compare all 15 side by side: Event Timeline in Python, R, Julia and JavaScript.
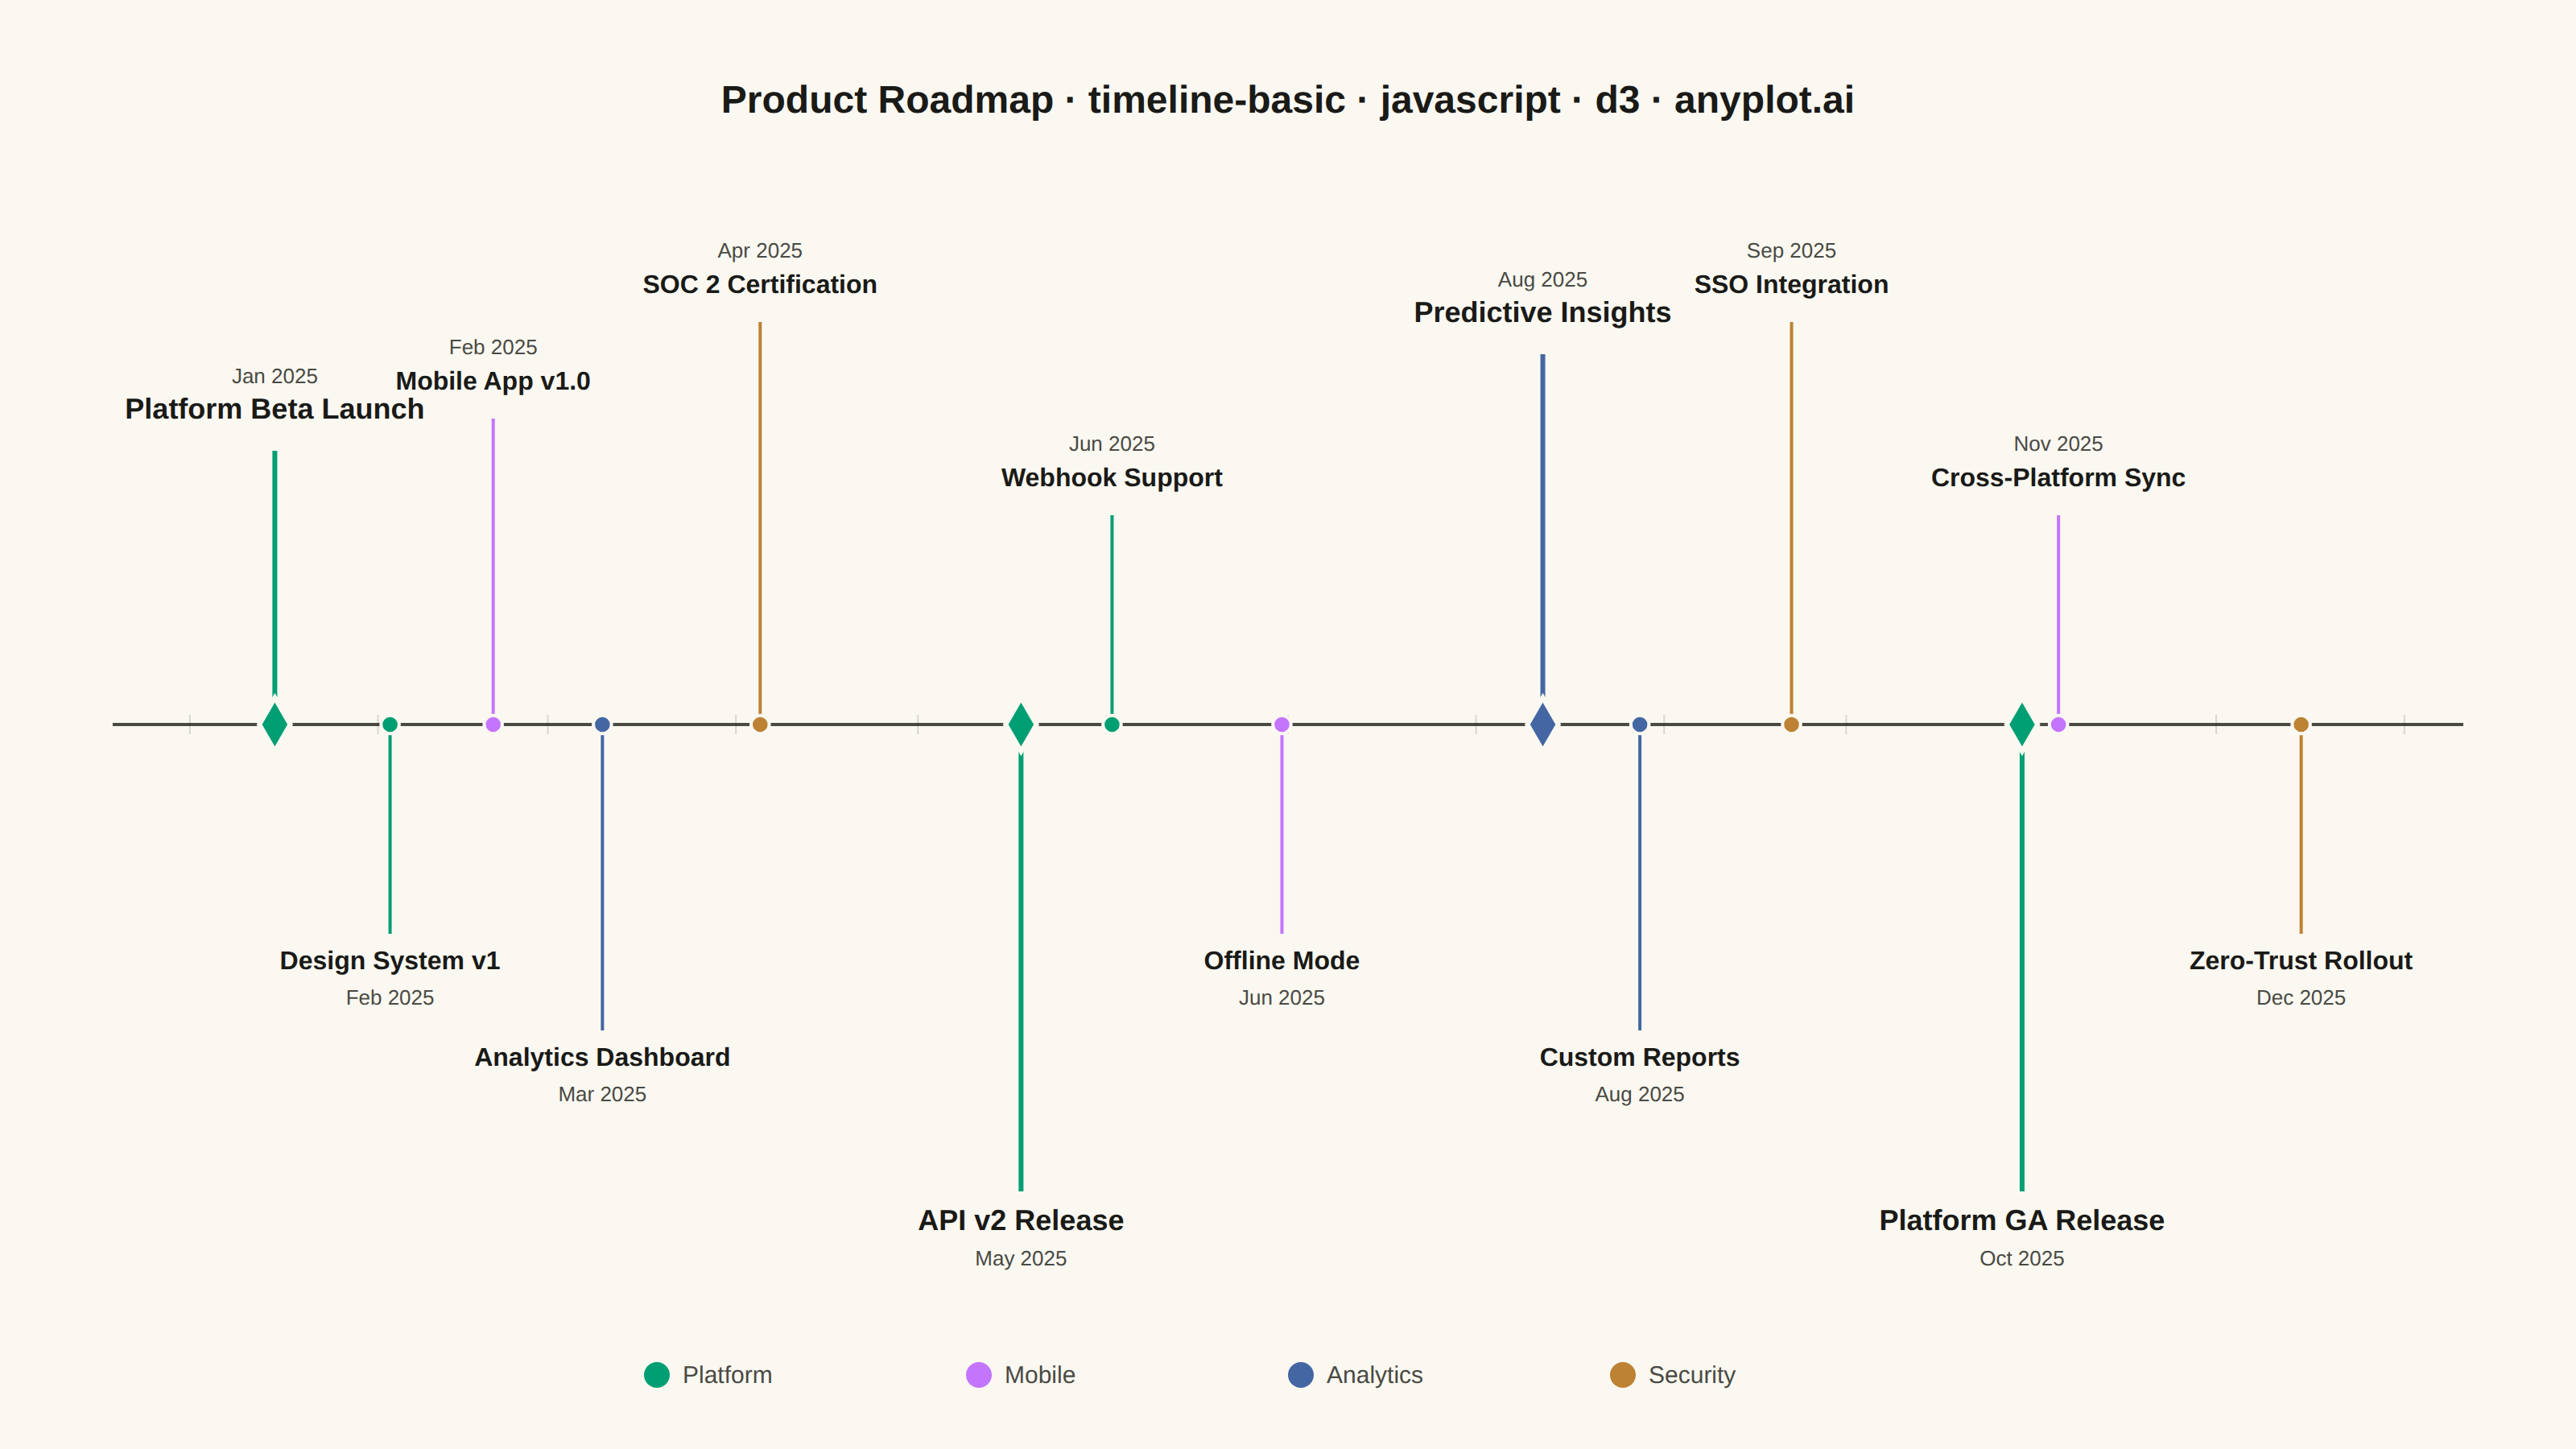
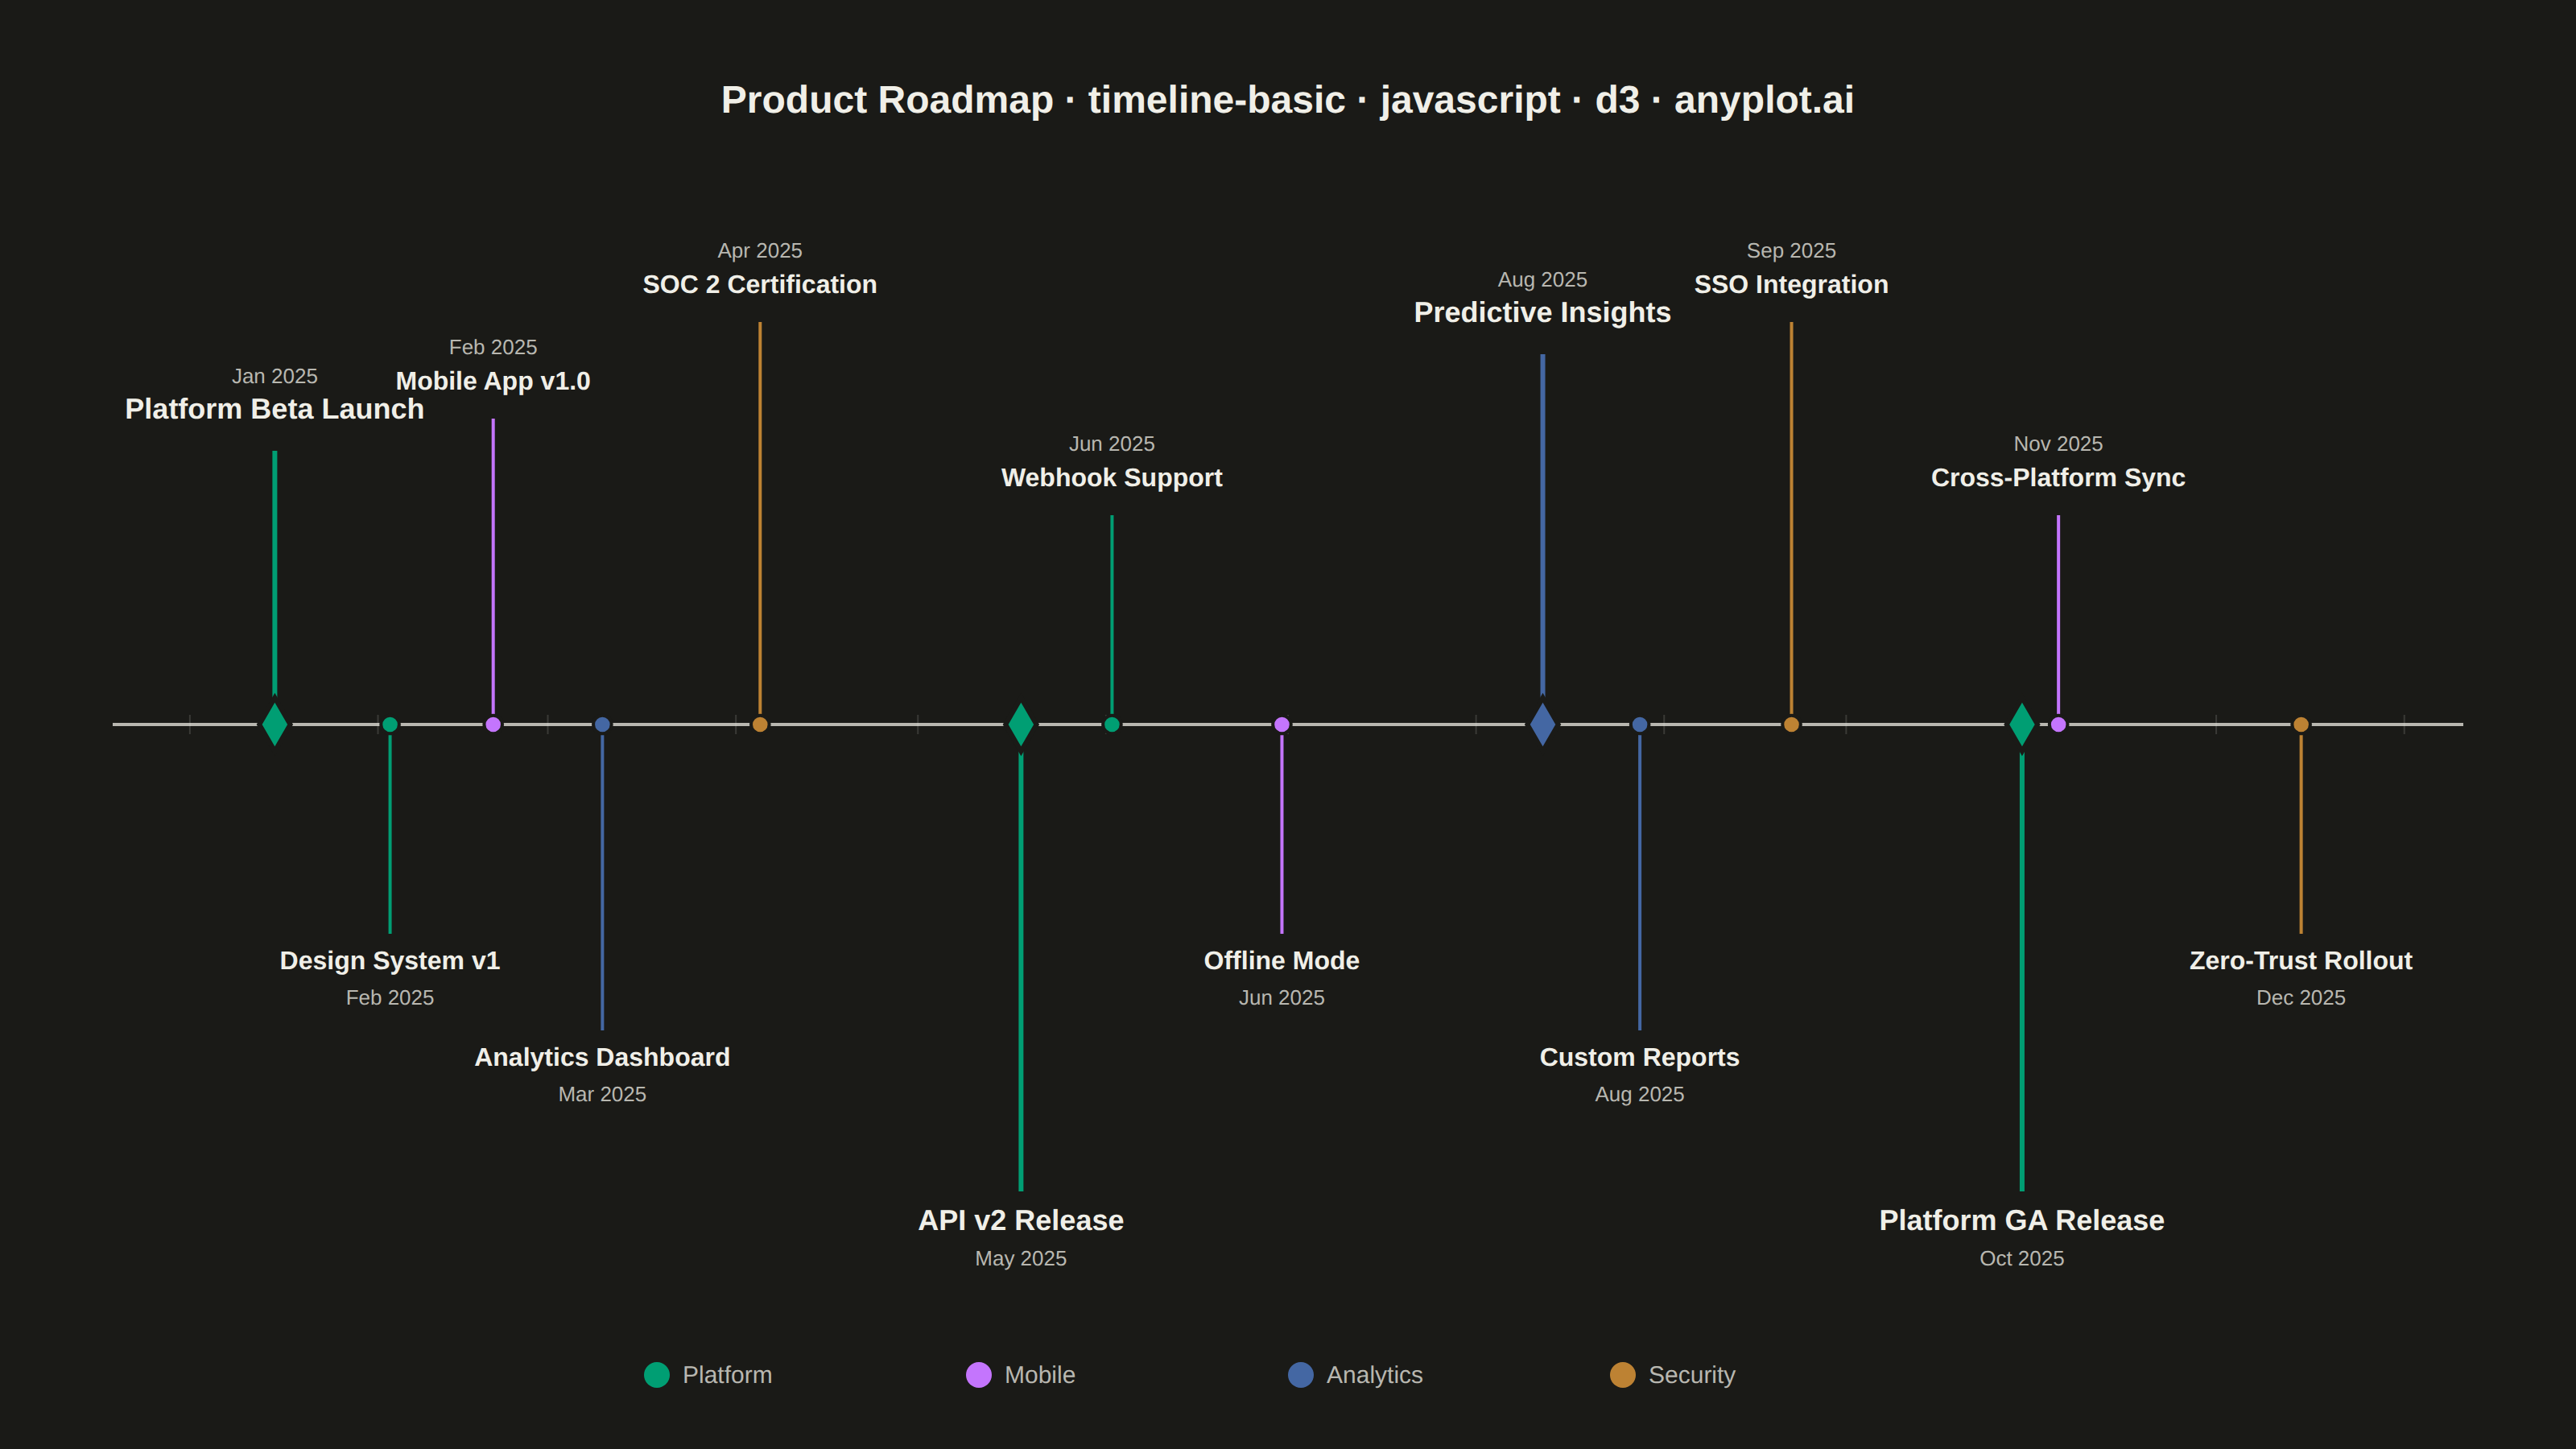
A timeline visualization that displays events and milestones along a temporal axis. Events are represented as points or markers with accompanying labels, making it easy to understand the sequence and timing of events. This plot type excels at showing chronological progressions and is particularly effective for communicating project phases, historical events, or any time-ordered sequence of occurrences.
// anyplot.ai
// timeline-basic: Event Timeline
// Library: d3 7.9.0 | JavaScript 22.23.2
// Quality: 91/100 | Created: 2026-09-09

const t = window.ANYPLOT_TOKENS;
const { width, height } = window.ANYPLOT_SIZE;
const margin = { left: 70, right: 70 };
const centerY = height / 2;
const iw = width - margin.left - margin.right;

// --- Data: product roadmap milestones (in-memory, deterministic) -----------
// `major: true` flags flagship releases that get an emphasized diamond marker,
// bolder label, and a longer stem — giving the timeline a focal hierarchy
// instead of a uniform run of same-weight events.
const categories = ["Platform", "Mobile", "Analytics", "Security"];
const events = [
  {
    date: new Date(2025, 0, 15),
    name: "Platform Beta Launch",
    category: "Platform",
    major: true,
  },
  {
    date: new Date(2025, 1, 3),
    name: "Design System v1",
    category: "Platform",
  },
  { date: new Date(2025, 1, 20), name: "Mobile App v1.0", category: "Mobile" },
  {
    date: new Date(2025, 2, 10),
    name: "Analytics Dashboard",
    category: "Analytics",
  },
  {
    date: new Date(2025, 3, 5),
    name: "SOC 2 Certification",
    category: "Security",
  },
  {
    date: new Date(2025, 4, 18),
    name: "API v2 Release",
    category: "Platform",
    major: true,
  },
  { date: new Date(2025, 5, 2), name: "Webhook Support", category: "Platform" },
  { date: new Date(2025, 5, 30), name: "Offline Mode", category: "Mobile" },
  {
    date: new Date(2025, 7, 12),
    name: "Predictive Insights",
    category: "Analytics",
    major: true,
  },
  {
    date: new Date(2025, 7, 28),
    name: "Custom Reports",
    category: "Analytics",
  },
  {
    date: new Date(2025, 8, 22),
    name: "SSO Integration",
    category: "Security",
  },
  {
    date: new Date(2025, 9, 30),
    name: "Platform GA Release",
    category: "Platform",
    major: true,
  },
  {
    date: new Date(2025, 10, 5),
    name: "Cross-Platform Sync",
    category: "Mobile",
  },
  {
    date: new Date(2025, 11, 15),
    name: "Zero-Trust Rollout",
    category: "Security",
  },
];

const color = d3.scaleOrdinal().domain(categories).range(t.palette);
const formatDate = d3.timeFormat("%b %Y");

// --- Scale -------------------------------------------------------------------
const [minDate, maxDate] = d3.extent(events, (d) => d.date);
const pad = (maxDate - minDate) * 0.08;
const x = d3
  .scaleTime()
  .domain([new Date(+minDate - pad), new Date(+maxDate + pad)])
  .range([0, iw]);

// --- SVG mount ----------------------------------------------------------------
const svg = d3
  .select("#container")
  .append("svg")
  .attr("width", width)
  .attr("height", height);
const g = svg.append("g").attr("transform", `translate(${margin.left},0)`);

// --- Timeline spine + month ticks --------------------------------------------
g.append("line")
  .attr("x1", 0)
  .attr("x2", iw)
  .attr("y1", centerY)
  .attr("y2", centerY)
  .attr("stroke", t.inkSoft)
  .attr("stroke-width", 2);

g.selectAll(".month-tick")
  .data(x.ticks(d3.timeMonth.every(1)))
  .join("line")
  .attr("class", "month-tick")
  .attr("x1", (d) => x(d))
  .attr("x2", (d) => x(d))
  .attr("y1", centerY - 6)
  .attr("y2", centerY + 6)
  .attr("stroke", t.grid)
  .attr("stroke-width", 1);

// --- Layout: alternating sides with a deterministic vertical stagger ---------
// Each side (above/below) gets its own sequence of events in date order. The
// stem length cycles through 3 fixed tiers by position within that sequence,
// so any two events that are neighbors on the same side always land on a
// different tier (guaranteed by construction, not by an estimated text width)
// and never share a vertical level.
const baseStem = 130;
const tierStep = 60;
const majorBonus = 40;
const tierCount = 3;

const sideIndex = { above: 0, below: 0 };

const laidOut = events.map((d, i) => {
  const cx = x(d.date);
  const side = i % 2 === 0 ? "above" : "below";
  const tier = sideIndex[side] % tierCount;
  sideIndex[side] += 1;

  const stemLen = baseStem + tier * tierStep + (d.major ? majorBonus : 0);
  return { ...d, cx, side, stemLen };
});

// --- Event markers: d3-shape symbols distinguish major vs. minor milestones --
const majorSymbol = d3.symbol().type(d3.symbolDiamond).size(320);
const minorSymbol = d3.symbol().type(d3.symbolCircle).size(100);

const eventGroups = g
  .selectAll(".event")
  .data(laidOut)
  .join("g")
  .attr("class", "event");

eventGroups.each(function (d) {
  const eg = d3.select(this);
  const above = d.side === "above";
  const c = color(d.category);
  const tipY = above ? centerY - d.stemLen : centerY + d.stemLen;
  const gap = d.major ? 20 : 18;
  const nameY = above ? tipY - gap : tipY + gap + 4;
  const dateY = above ? nameY - 22 : nameY + 22;

  eg.append("line")
    .attr("x1", d.cx)
    .attr("x2", d.cx)
    .attr("y1", centerY)
    .attr("y2", tipY)
    .attr("stroke", c)
    .attr("stroke-width", d.major ? 3 : 2);

  eg.append("path")
    .attr("d", d.major ? majorSymbol() : minorSymbol())
    .attr("transform", `translate(${d.cx},${centerY})`)
    .attr("fill", c)
    .attr("stroke", t.pageBg)
    .attr("stroke-width", d.major ? 3 : 2);

  eg.append("text")
    .attr("x", d.cx)
    .attr("y", nameY)
    .attr("text-anchor", "middle")
    .attr("fill", t.ink)
    .style("font-size", d.major ? "18px" : "16px")
    .style("font-weight", d.major ? "700" : "600")
    .text(d.name);

  eg.append("text")
    .attr("x", d.cx)
    .attr("y", dateY)
    .attr("text-anchor", "middle")
    .attr("fill", t.inkSoft)
    .style("font-size", "13px")
    .text(formatDate(d.date));
});

// --- Legend -------------------------------------------------------------------
const legendItemWidth = 200;
const legend = svg
  .append("g")
  .attr(
    "transform",
    `translate(${width / 2 - (categories.length * legendItemWidth) / 2}, ${height - 46})`,
  );

const legendItems = legend
  .selectAll(".legend-item")
  .data(categories)
  .join("g")
  .attr("class", "legend-item")
  .attr("transform", (_, i) => `translate(${i * legendItemWidth}, 0)`);

legendItems
  .append("circle")
  .attr("cx", 8)
  .attr("cy", 0)
  .attr("r", 8)
  .attr("fill", (d) => color(d));

legendItems
  .append("text")
  .attr("x", 24)
  .attr("y", 5)
  .attr("fill", t.inkSoft)
  .style("font-size", "15px")
  .text((d) => d);

// --- Title ----------------------------------------------------------------
svg
  .append("text")
  .attr("x", width / 2)
  .attr("y", 70)
  .attr("text-anchor", "middle")
  .attr("fill", t.ink)
  .style("font-size", "24px")
  .style("font-weight", "600")
  .text("Product Roadmap · timeline-basic · javascript · d3 · anyplot.ai");
Runnable source as JSON, for any HTTP client: https://api.anyplot.ai/specs/timeline-basic/d3/code. Any spec id and library id listed in llms-full.txt fit the same URL shape; every URL below is complete and callable.
{
  "spec_id": "timeline-basic",
  "language": "javascript",
  "library": "d3",
  "page": "https://anyplot.ai/timeline-basic/javascript/d3",
  "hub": "https://anyplot.ai/timeline-basic",
  "code_json": "https://api.anyplot.ai/specs/timeline-basic/d3/code",
  "spec_json": "https://api.anyplot.ai/specs/timeline-basic",
  "render_light_png": "https://storage.googleapis.com/anyplot-images/plots/timeline-basic/javascript/d3/plot-light.png",
  "render_dark_png": "https://storage.googleapis.com/anyplot-images/plots/timeline-basic/javascript/d3/plot-dark.png",
  "interactive_light_html": "https://storage.googleapis.com/anyplot-images/plots/timeline-basic/javascript/d3/plot-light.html",
  "interactive_dark_html": "https://storage.googleapis.com/anyplot-images/plots/timeline-basic/javascript/d3/plot-dark.html",
  "quality_score": 91.0,
  "license": "MIT",
  "guide": "https://anyplot.ai/llms.txt"
}
Part of Event Timeline on anyplot.ai.