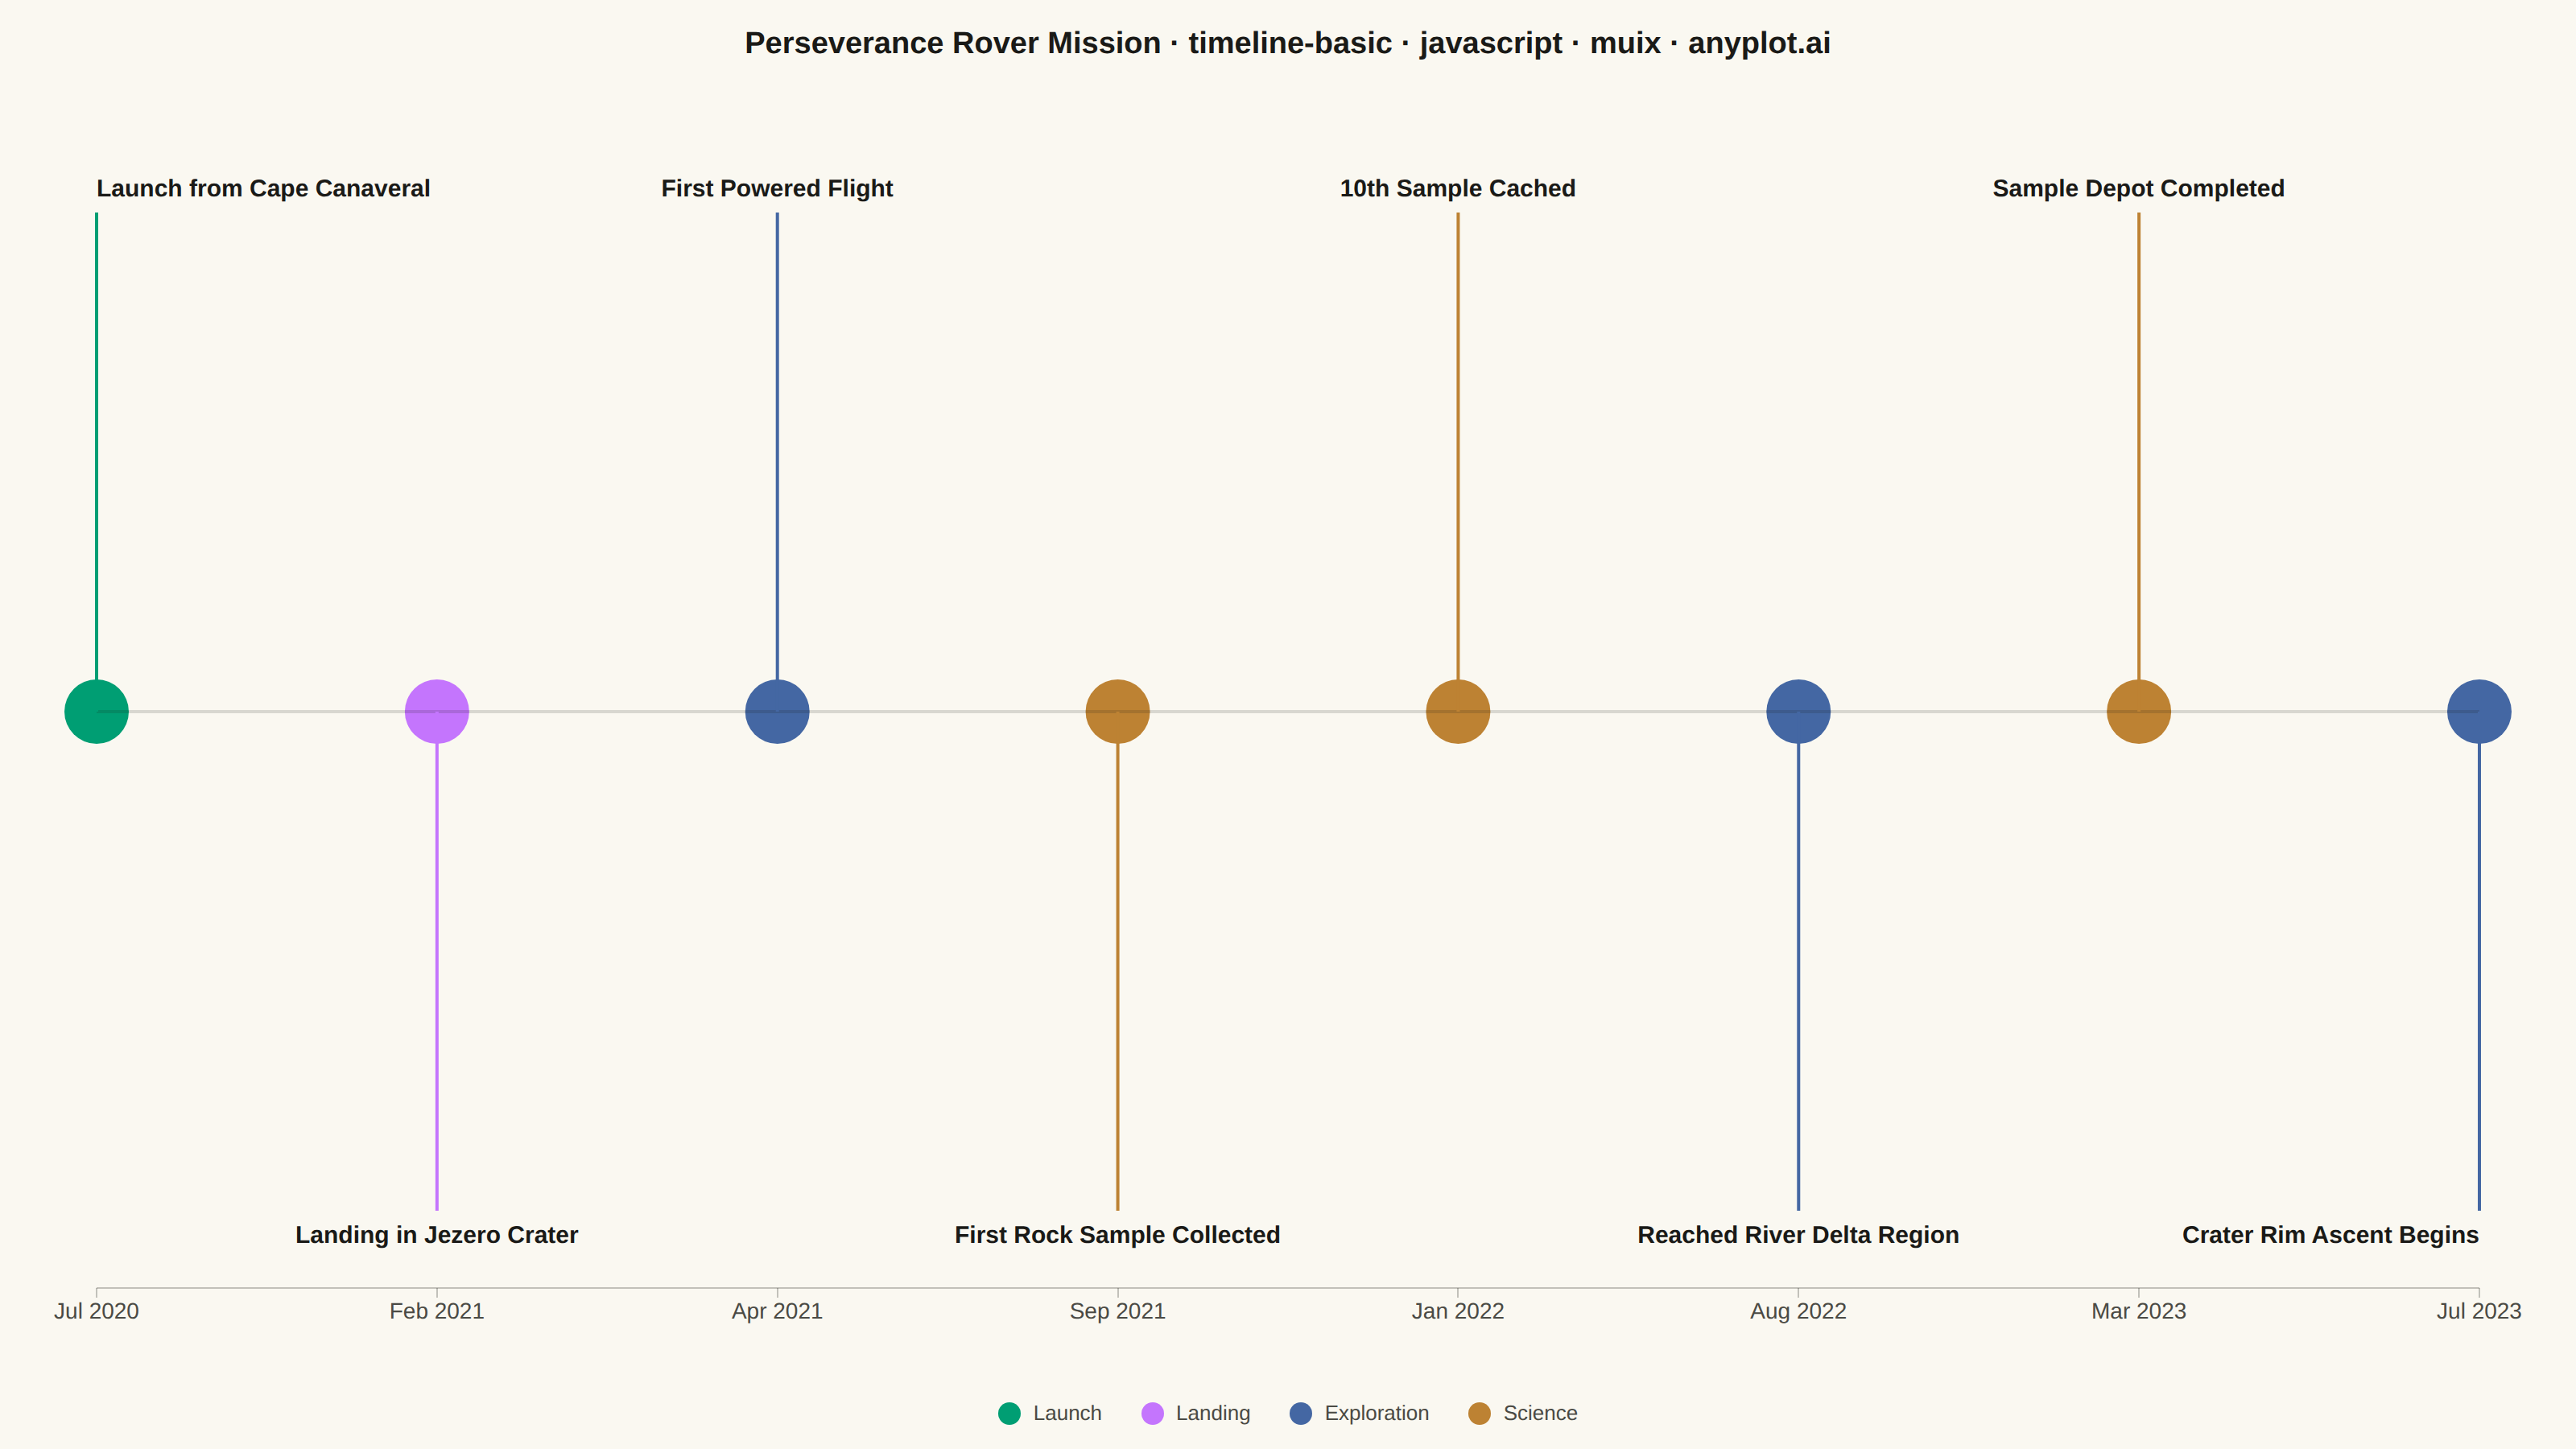
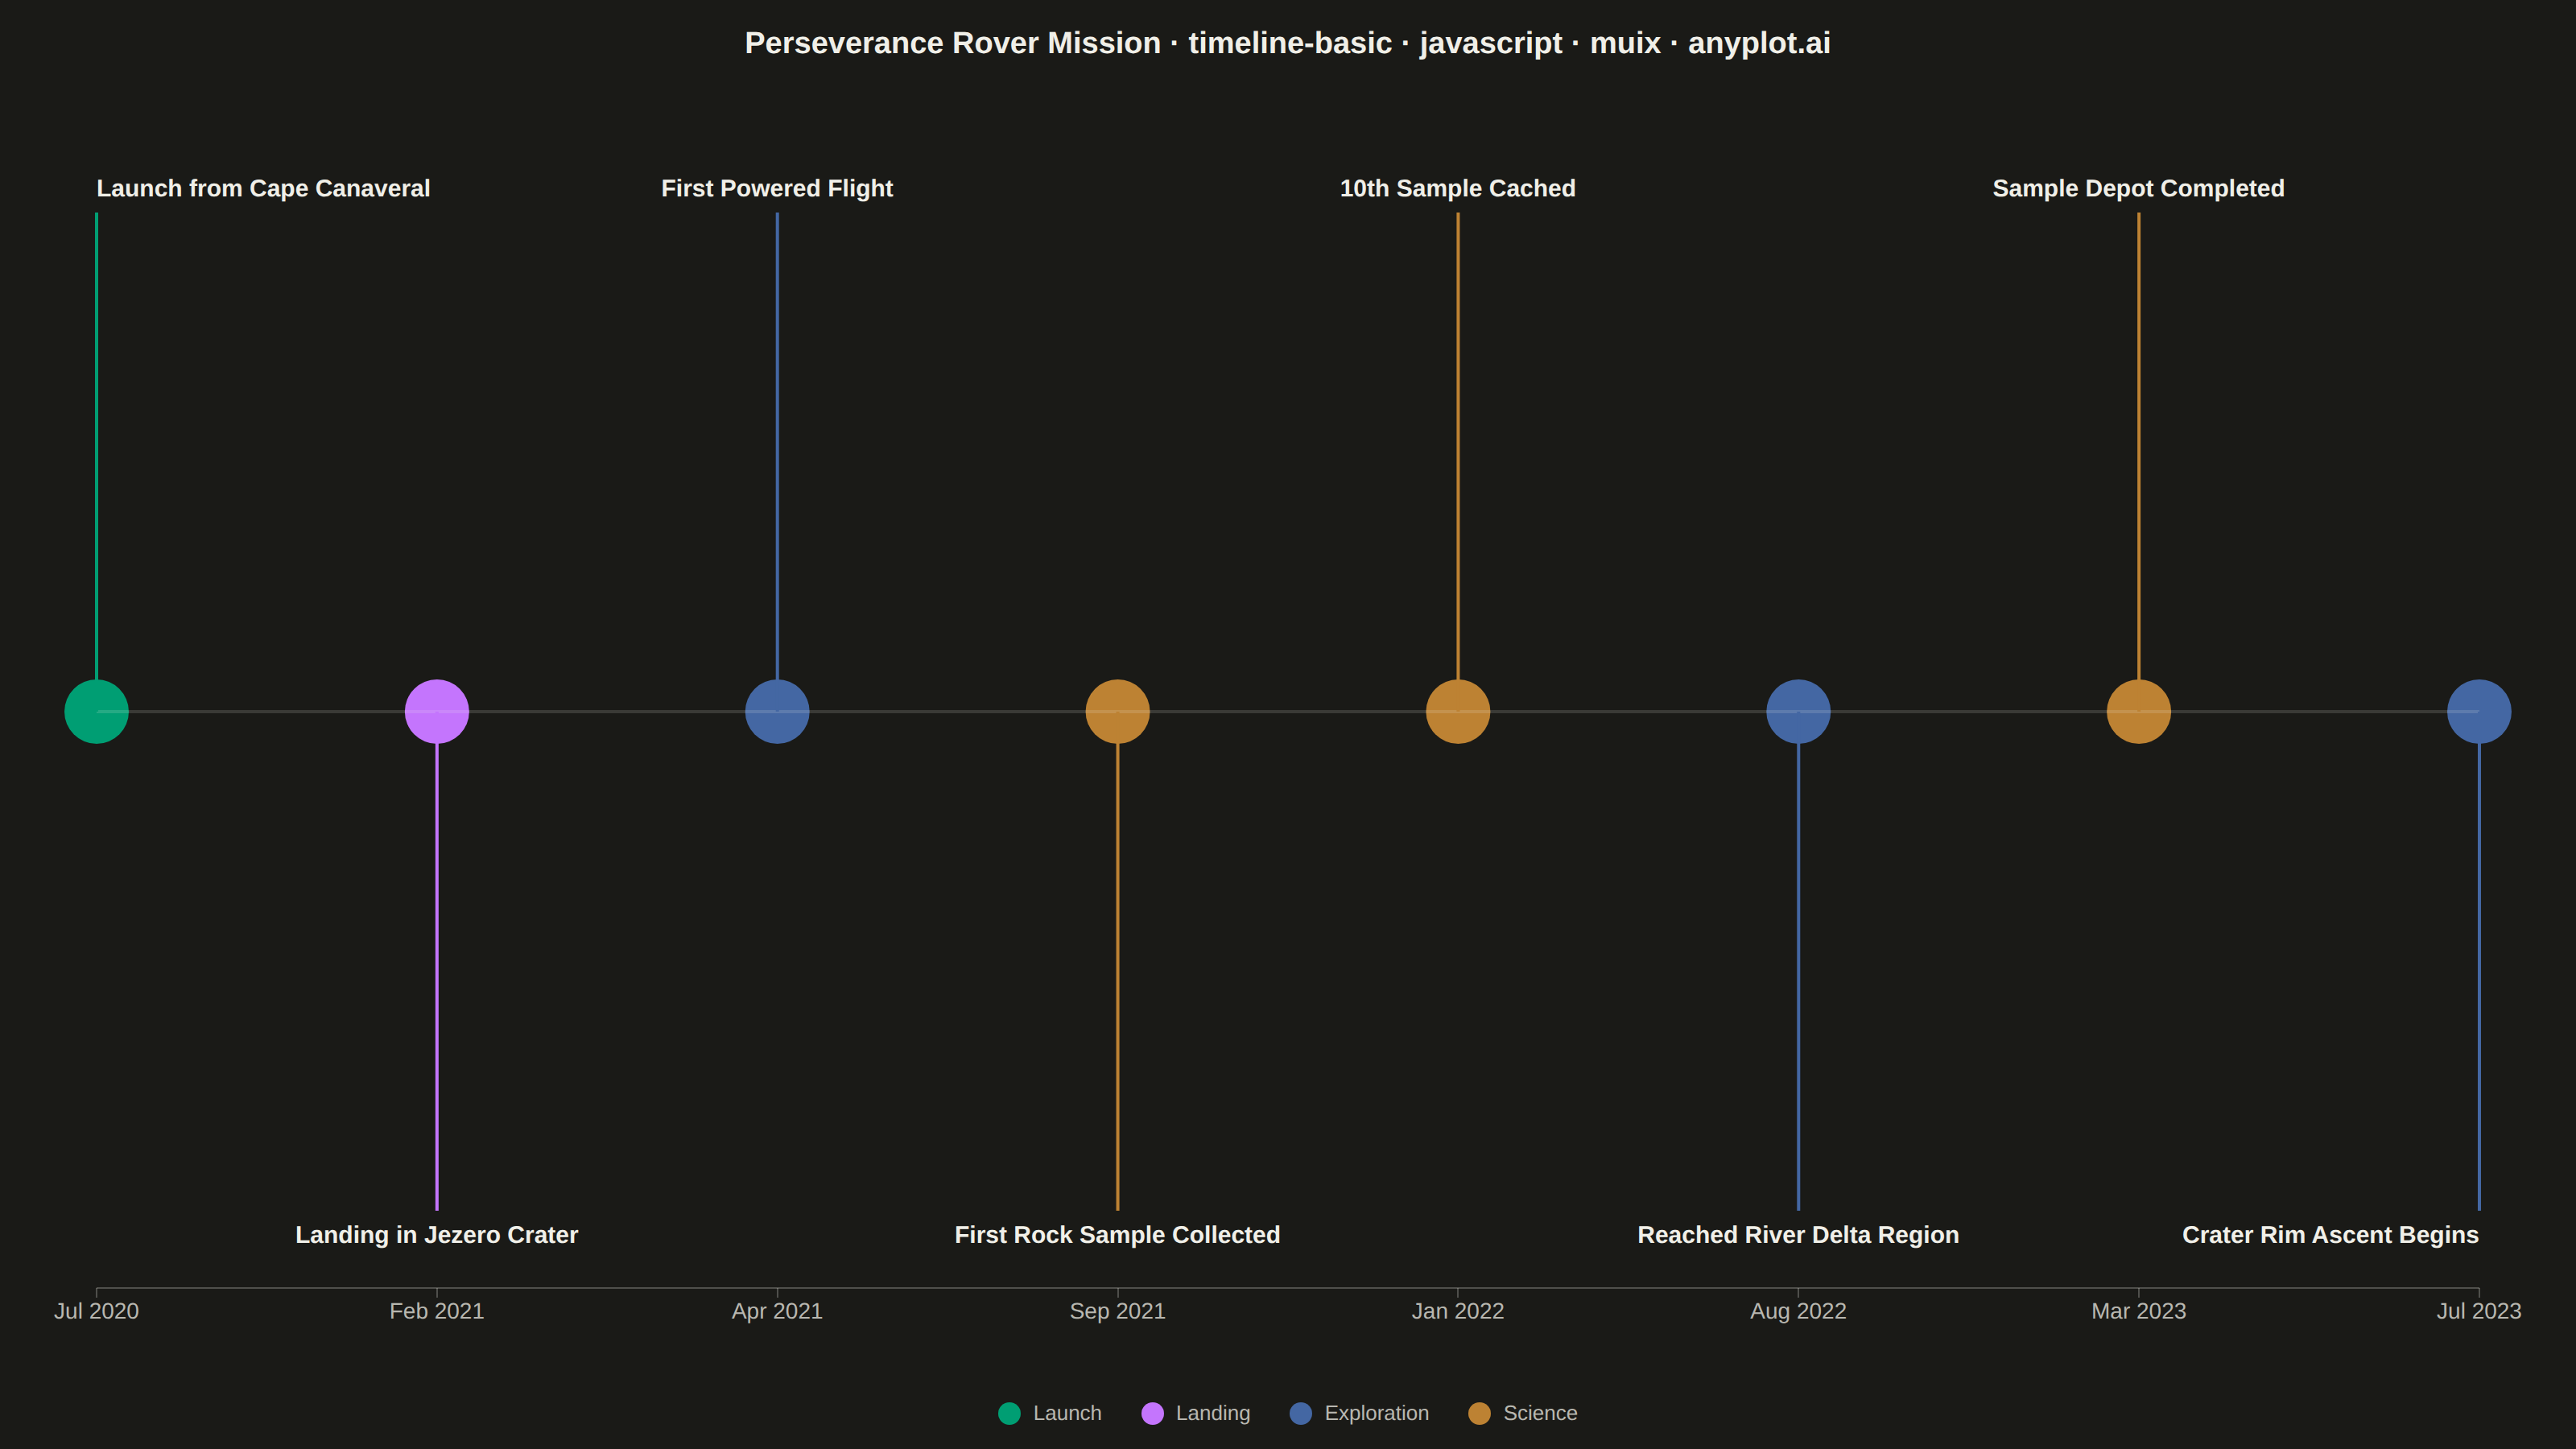
The same plot in 14 other libraries — JavaScript: Chart.js, D3.js, Apache ECharts, Highcharts; Python: Altair, Bokeh, lets-plot, Matplotlib, Plotly, plotnine, Pygal, Seaborn; R: ggplot2; Julia: Makie.jl. Compare all 15 side by side: Event Timeline in Python, R, Julia and JavaScript.
A timeline visualization that displays events and milestones along a temporal axis. Events are represented as points or markers with accompanying labels, making it easy to understand the sequence and timing of events. This plot type excels at showing chronological progressions and is particularly effective for communicating project phases, historical events, or any time-ordered sequence of occurrences.
// anyplot.ai
// timeline-basic: Event Timeline
// Library: muix 7.29.1 | JavaScript 22.23.2
// Quality: 91/100 | Created: 2026-09-09
import { ScatterChart } from "@mui/x-charts/ScatterChart";
import { ChartsReferenceLine } from "@mui/x-charts/ChartsReferenceLine";
import { ChartsText } from "@mui/x-charts/ChartsText";
import { useXScale, useYScale } from "@mui/x-charts/hooks";
import Box from "@mui/material/Box";
import Typography from "@mui/material/Typography";

const t = window.ANYPLOT_TOKENS;

// --- Data (in-memory, deterministic — real public mission dates) -----------
// A science/exploration timeline rather than a project-management one: dates
// double as historical record, which is one of the spec's named applications.
const MILESTONES = [
  { date: new Date(2020, 6, 30), event: "Launch from Cape Canaveral", category: "Launch" },
  { date: new Date(2021, 1, 18), event: "Landing in Jezero Crater", category: "Landing" },
  { date: new Date(2021, 3, 19), event: "First Powered Flight", category: "Exploration" },
  { date: new Date(2021, 8, 6), event: "First Rock Sample Collected", category: "Science" },
  { date: new Date(2022, 0, 27), event: "10th Sample Cached", category: "Science" },
  { date: new Date(2022, 7, 8), event: "Reached River Delta Region", category: "Exploration" },
  { date: new Date(2023, 2, 22), event: "Sample Depot Completed", category: "Science" },
  { date: new Date(2023, 6, 18), event: "Crater Rim Ascent Begins", category: "Exploration" },
];

// First-appearance order fixes the brand-green anchor on "Launch" — the
// canonical Imprint order, not cherry-picked for aesthetics.
const CATEGORY_ORDER = ["Launch", "Landing", "Exploration", "Science"];
const categoryColor: Record<string, string> = {
  Launch: t.palette[0],
  Landing: t.palette[1],
  Exploration: t.palette[2],
  Science: t.palette[3],
};

// --- Event labels: MUI X community has no per-point label primitive for
// scatter series — draw them against the shared xAxis/yAxis scale via
// useXScale/useYScale, the documented composition pattern for marks outside
// the plain chart surface. Labels alternate above/below the spine so
// adjacent events never collide.
function EventLabels({ stemLength }: { stemLength: number }) {
  const xScale = useXScale() as any;
  const yScale = useYScale() as any;
  if (!xScale || !yScale) return null;

  const textGap = 10;

  return (
    <g>
      {MILESTONES.map((m, i) => {
        const x = xScale(m.date);
        const spineY = yScale(0);
        const above = i % 2 === 0;
        const stemEnd = above ? spineY - stemLength : spineY + stemLength;
        const color = categoryColor[m.category];
        // Center labels by default, but anchor the first/last event's text
        // inward so it can't run off the canvas edge.
        const textAnchor = i === 0 ? "start" : i === MILESTONES.length - 1 ? "end" : "middle";

        return (
          <g key={m.event}>
            <line x1={x} y1={spineY} x2={x} y2={stemEnd} stroke={color} strokeWidth={2} />
            <ChartsText
              x={x}
              y={above ? stemEnd - textGap : stemEnd + textGap}
              text={m.event}
              style={{
                fontSize: 15,
                fontWeight: 600,
                fill: t.ink,
                textAnchor,
                dominantBaseline: above ? "auto" : "hanging",
              }}
            />
          </g>
        );
      })}
    </g>
  );
}

const TITLE = "Perseverance Rover Mission · timeline-basic · javascript · muix · anyplot.ai";

// --- Chart (default-exported component — the harness mounts it) -----------
export default function Chart() {
  const W = window.ANYPLOT_SIZE.width;
  const H = window.ANYPLOT_SIZE.height;
  const titleSize = TITLE.length > 67 ? Math.max(14, Math.round((22 * 67) / TITLE.length)) : 22;

  // Tightened bands: the chart plot area (spine + labels) should dominate
  // the canvas rather than leaving large blank margins above/below the
  // label rows (prior attempt left ~38%/~31% of the height empty).
  const TITLE_H = 56;
  const LEGEND_H = 44;
  const chartH = H - TITLE_H - LEGEND_H;
  const MARGIN_TOP = 28;
  const MARGIN_BOTTOM = 56;

  // Derive the stem length from the actual plot area so the label rows sit
  // close to the title/axis edges instead of clustering in a thin strip at
  // the vertical center — LABEL_CLEARANCE reserves room for the label text
  // itself plus a small breathing gap from the title/axis.
  const plotH = chartH - MARGIN_TOP - MARGIN_BOTTOM;
  const LABEL_CLEARANCE = 48;
  const stemLength = Math.max(40, plotH / 2 - LABEL_CLEARANCE);

  const series = CATEGORY_ORDER.map((cat) => ({
    id: cat,
    label: cat,
    color: categoryColor[cat],
    markerSize: 20,
    data: MILESTONES.filter((m) => m.category === cat).map((m, i) => ({
      x: m.date,
      y: 0,
      id: `${cat}-${i}`,
    })),
  }));

  return (
    <Box
      sx={{
        width: W,
        height: H,
        bgcolor: t.pageBg,
        display: "flex",
        flexDirection: "column",
        fontFamily: "'Roboto', 'Helvetica Neue', Arial, sans-serif",
        boxSizing: "border-box",
      }}
    >
      <Box sx={{ height: TITLE_H, display: "flex", alignItems: "center", justifyContent: "center" }}>
        <Typography sx={{ color: t.ink, fontSize: titleSize, fontWeight: 600 }}>{TITLE}</Typography>
      </Box>

      <ScatterChart
        width={W}
        height={chartH}
        skipAnimation
        series={series}
        xAxis={[
          {
            scaleType: "point",
            data: MILESTONES.map((m) => m.date),
            valueFormatter: (d: Date) => d.toLocaleDateString("en-US", { month: "short", year: "numeric" }),
            tickLabelStyle: { fontSize: 14, fill: t.inkSoft },
          },
        ]}
        yAxis={[{ min: -1, max: 1, domainLimit: "strict" }]}
        leftAxis={null}
        grid={{ horizontal: false, vertical: false }}
        margin={{ top: MARGIN_TOP, right: 60, bottom: MARGIN_BOTTOM, left: 60 }}
        slotProps={{ legend: { hidden: true } }}
        sx={{
          "& .MuiChartsAxis-line": { stroke: t.inkSoft, strokeOpacity: 0.25 },
          "& .MuiChartsAxis-tick": { stroke: t.inkSoft, strokeOpacity: 0.25 },
        }}
      >
        <ChartsReferenceLine y={0} lineStyle={{ stroke: t.grid, strokeWidth: 2 }} />
        <EventLabels stemLength={stemLength} />
      </ScatterChart>

      <Box sx={{ height: LEGEND_H, display: "flex", alignItems: "center", justifyContent: "center", gap: "24px" }}>
        {CATEGORY_ORDER.map((cat) => (
          <Box key={cat} sx={{ display: "flex", alignItems: "center", gap: "8px" }}>
            <svg width={14} height={14}>
              <circle cx={7} cy={7} r={7} fill={categoryColor[cat]} />
            </svg>
            <Typography sx={{ color: t.inkSoft, fontSize: 13, fontWeight: 500 }}>{cat}</Typography>
          </Box>
        ))}
      </Box>
    </Box>
  );
}
Runnable source as JSON, for any HTTP client: https://api.anyplot.ai/specs/timeline-basic/muix/code. Any spec id and library id listed in llms-full.txt fit the same URL shape; every URL below is complete and callable.
{
  "spec_id": "timeline-basic",
  "language": "javascript",
  "library": "muix",
  "page": "https://anyplot.ai/timeline-basic/javascript/muix",
  "hub": "https://anyplot.ai/timeline-basic",
  "code_json": "https://api.anyplot.ai/specs/timeline-basic/muix/code",
  "spec_json": "https://api.anyplot.ai/specs/timeline-basic",
  "render_light_png": "https://storage.googleapis.com/anyplot-images/plots/timeline-basic/javascript/muix/plot-light.png",
  "render_dark_png": "https://storage.googleapis.com/anyplot-images/plots/timeline-basic/javascript/muix/plot-dark.png",
  "interactive_light_html": "https://storage.googleapis.com/anyplot-images/plots/timeline-basic/javascript/muix/plot-light.html",
  "interactive_dark_html": "https://storage.googleapis.com/anyplot-images/plots/timeline-basic/javascript/muix/plot-dark.html",
  "quality_score": 91.0,
  "license": "MIT",
  "guide": "https://anyplot.ai/llms.txt"
}
Part of Event Timeline on anyplot.ai.