The same plot in 14 other libraries — JavaScript: Chart.js, D3.js, Apache ECharts, MUI X Charts; Python: Altair, Bokeh, lets-plot, Matplotlib, Plotly, plotnine, Pygal, Seaborn; R: ggplot2; Julia: Makie.jl. Compare all 15 side by side: Event Timeline in Python, R, Julia and JavaScript.
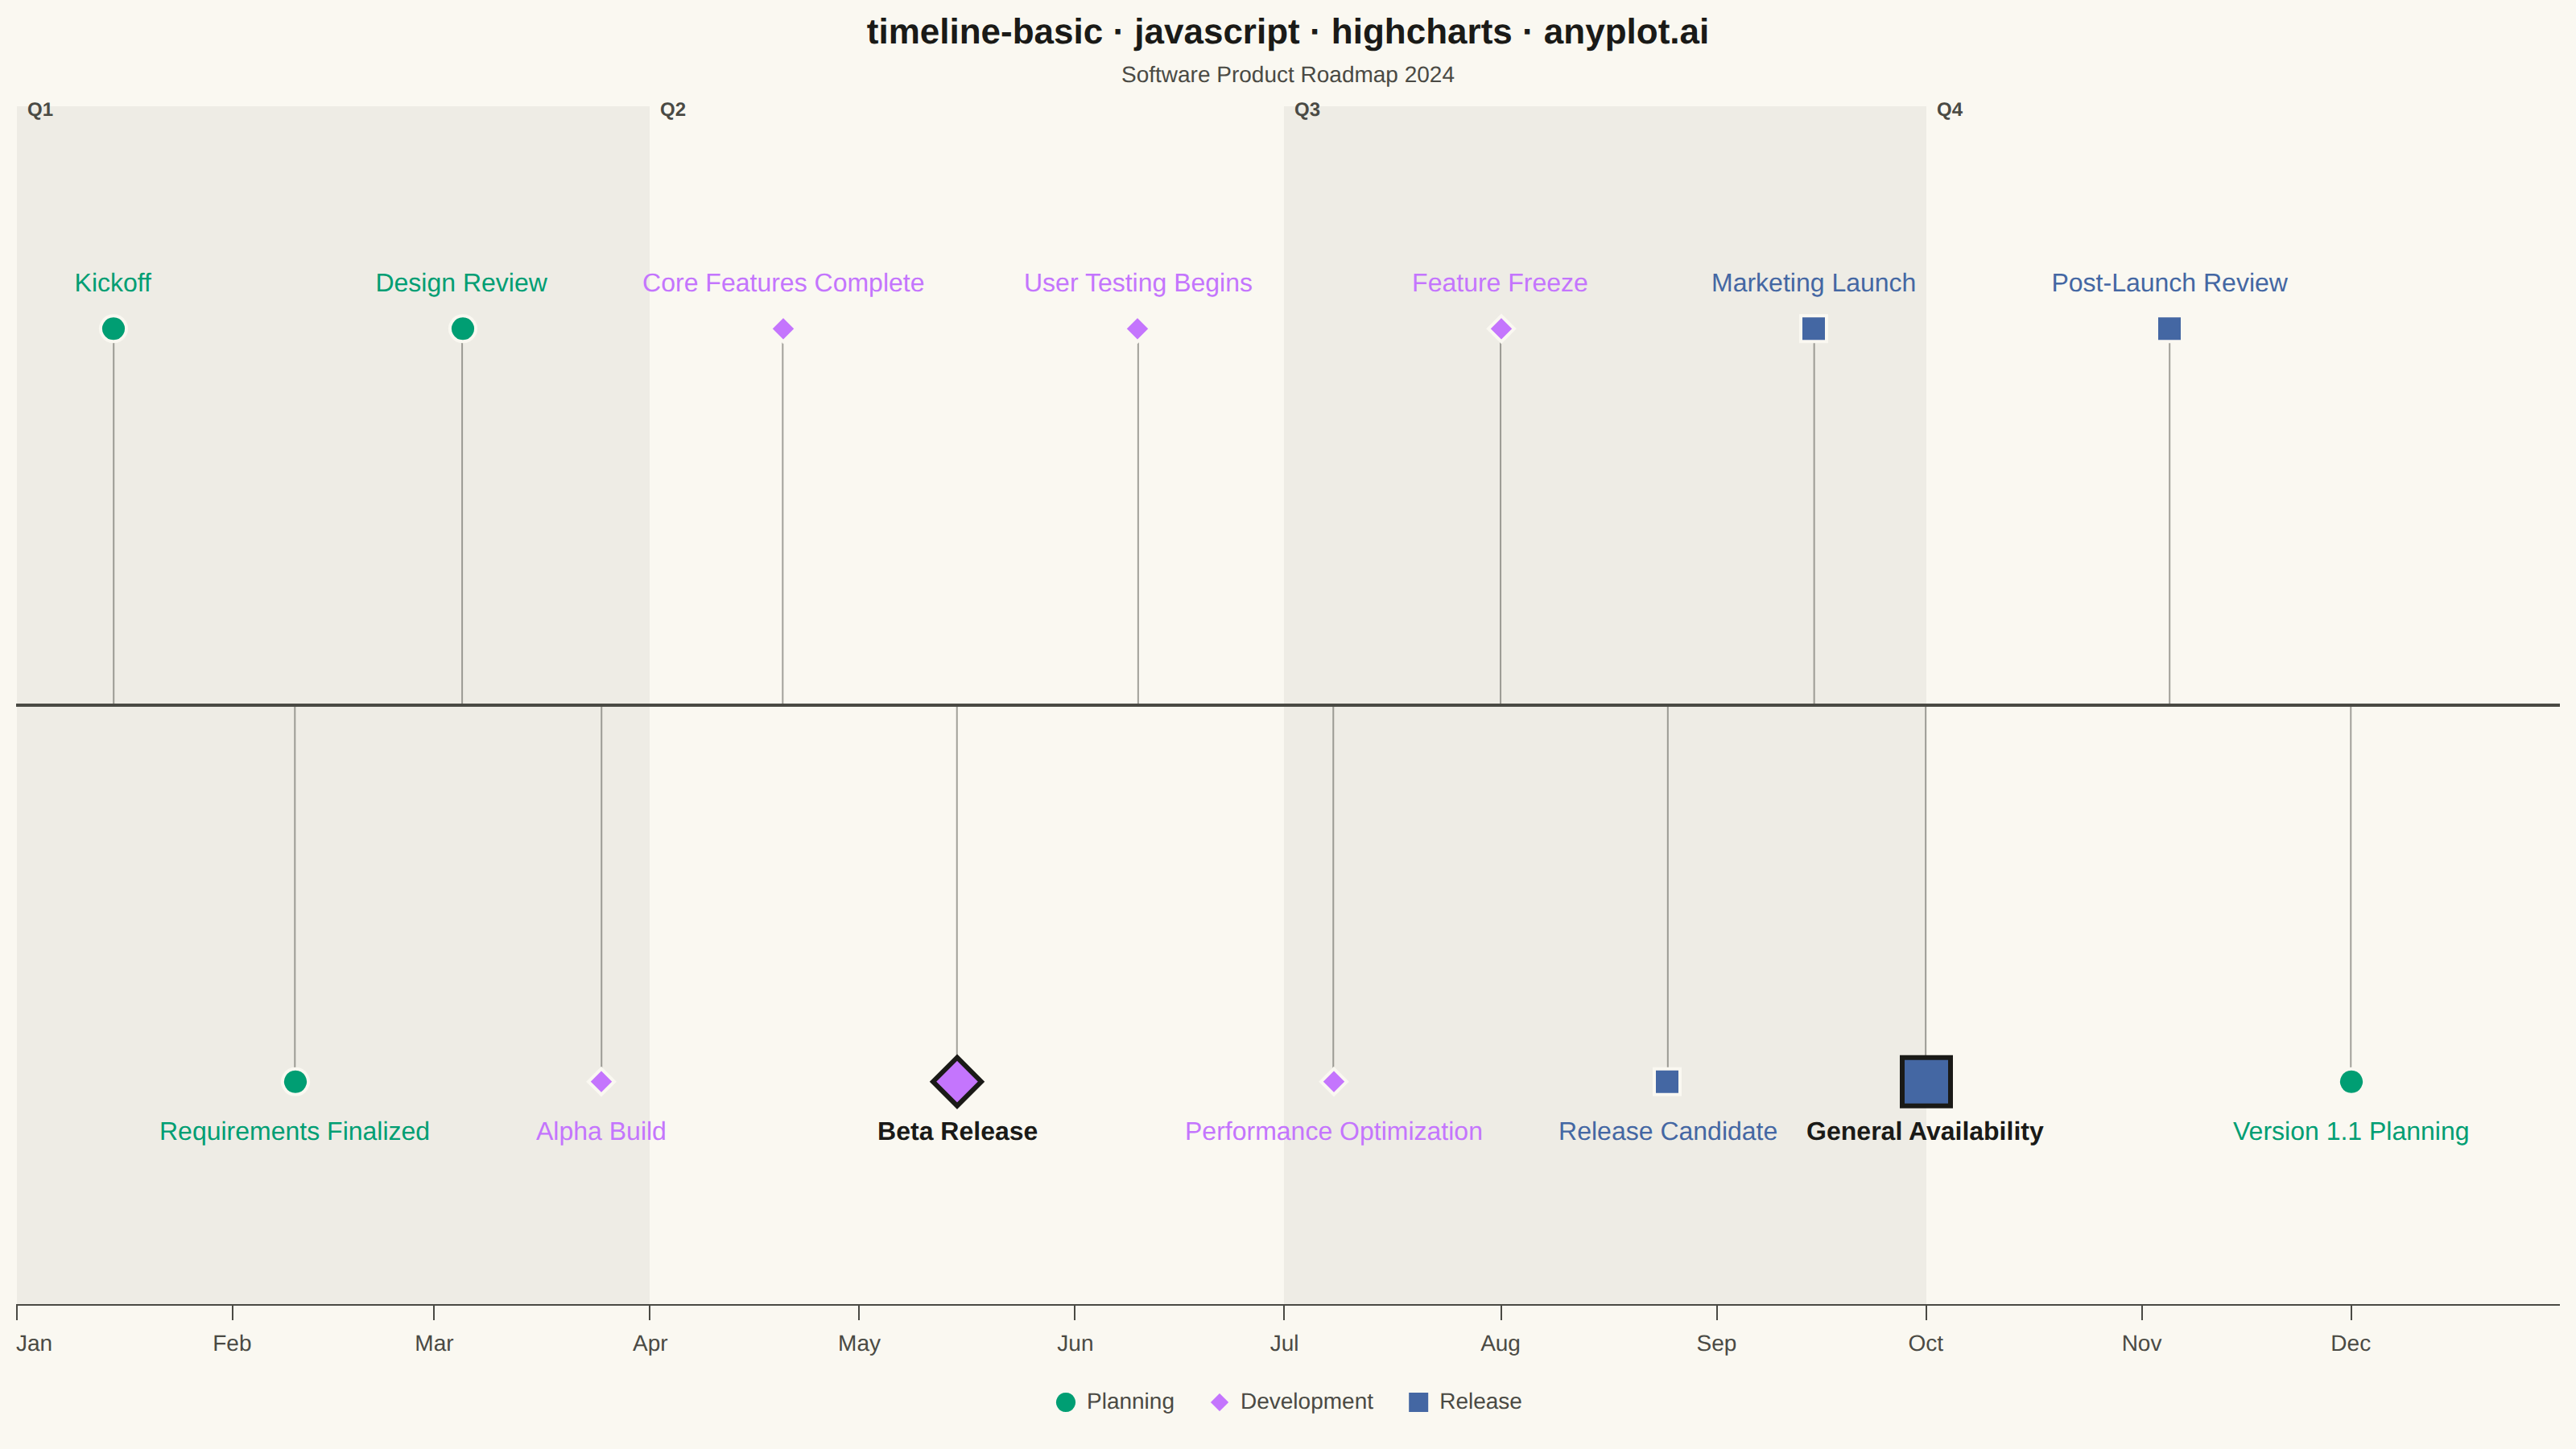
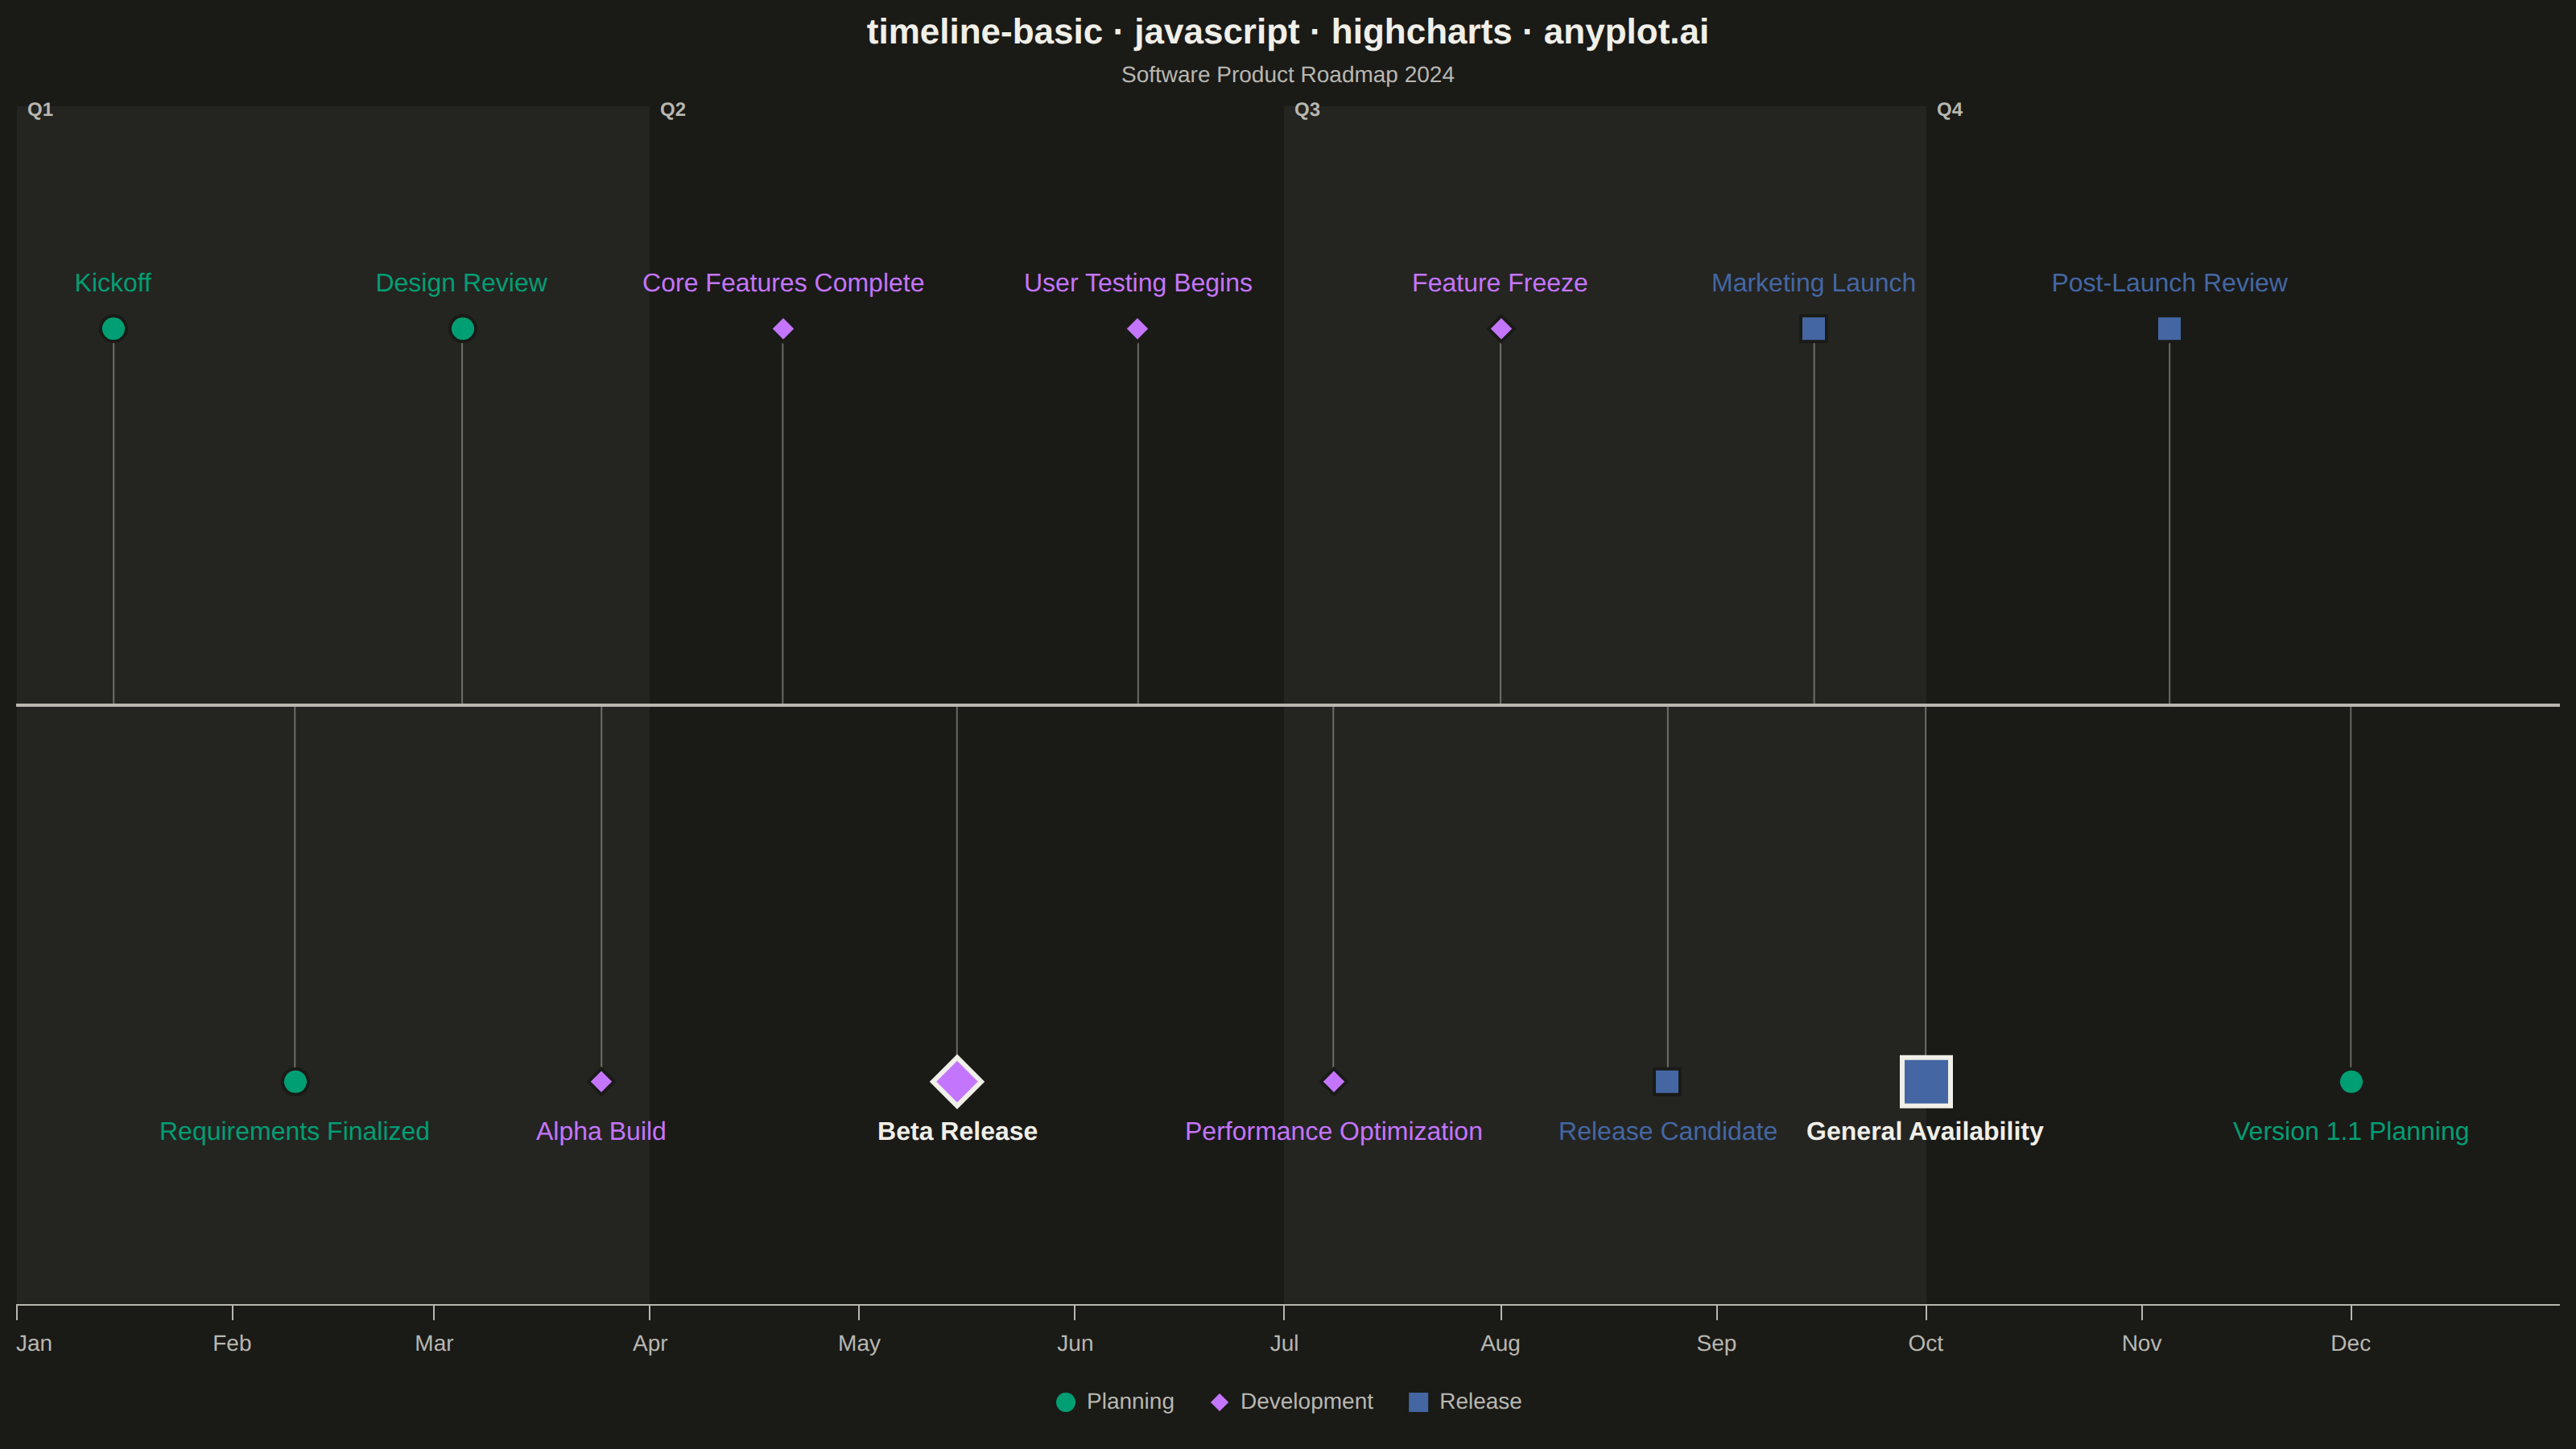
A timeline visualization that displays events and milestones along a temporal axis. Events are represented as points or markers with accompanying labels, making it easy to understand the sequence and timing of events. This plot type excels at showing chronological progressions and is particularly effective for communicating project phases, historical events, or any time-ordered sequence of occurrences.
// anyplot.ai
// timeline-basic: Event Timeline
// Library: highcharts 12.6.0 | JavaScript 22.23.2
// Quality: 92/100 | Created: 2026-09-09

const t = window.ANYPLOT_TOKENS;

// --- Data (in-memory, deterministic) ---------------------------------------
// Software product roadmap for 2024, grouped by phase category.
const events = [
  { date: Date.UTC(2024, 0, 15), name: "Kickoff", category: "Planning" },
  { date: Date.UTC(2024, 1, 10), name: "Requirements Finalized", category: "Planning" },
  { date: Date.UTC(2024, 2, 5), name: "Design Review", category: "Planning" },
  { date: Date.UTC(2024, 2, 25), name: "Alpha Build", category: "Development" },
  { date: Date.UTC(2024, 3, 20), name: "Core Features Complete", category: "Development" },
  { date: Date.UTC(2024, 4, 15), name: "Beta Release", category: "Development" },
  { date: Date.UTC(2024, 5, 10), name: "User Testing Begins", category: "Development" },
  { date: Date.UTC(2024, 6, 8), name: "Performance Optimization", category: "Development" },
  { date: Date.UTC(2024, 7, 1), name: "Feature Freeze", category: "Development" },
  { date: Date.UTC(2024, 7, 25), name: "Release Candidate", category: "Release" },
  { date: Date.UTC(2024, 8, 15), name: "Marketing Launch", category: "Release" },
  { date: Date.UTC(2024, 9, 1), name: "General Availability", category: "Release" },
  { date: Date.UTC(2024, 10, 5), name: "Post-Launch Review", category: "Release" },
  { date: Date.UTC(2024, 11, 1), name: "Version 1.1 Planning", category: "Planning" },
];

// The two pivotal milestones get a larger, ink-outlined marker and a bolder
// label so the timeline has a focal point instead of reading as 14 uniform dots.
const EMPHASIZED = new Set(["Beta Release", "General Availability"]);

// Alternate marker/label sides in chronological order so neighboring events
// never compete for the same vertical space, regardless of category. Markers
// sit off the axis line (not on it) and a thin connector stem bridges the gap
// so the timeline band uses the full canvas height instead of a thin strip.
const ABOVE = { markerY: 1.1, labelY: -16, verticalAlign: "bottom" };
const BELOW = { markerY: -1.1, labelY: 16, verticalAlign: "top" };
events.forEach((event, index) => {
  event.side = index % 2 === 0 ? ABOVE : BELOW;
});

// Quarterly plot bands give the timeline a Highcharts-distinctive backdrop
// (instead of a generic scatter+line) and fill the vertical whitespace with
// intentional structure rather than empty margins.
const quarterBg = Highcharts.color(t.ink).setOpacity(0.05).get();
const plotBands = [
  { from: Date.UTC(2024, 0, 1), to: Date.UTC(2024, 3, 1), label: "Q1" },
  { from: Date.UTC(2024, 3, 1), to: Date.UTC(2024, 6, 1), label: "Q2" },
  { from: Date.UTC(2024, 6, 1), to: Date.UTC(2024, 9, 1), label: "Q3" },
  { from: Date.UTC(2024, 9, 1), to: Date.UTC(2024, 11, 31), label: "Q4" },
].map((quarter, index) => ({
  from: quarter.from,
  to: quarter.to,
  color: index % 2 === 0 ? quarterBg : "transparent",
  label: {
    text: quarter.label,
    verticalAlign: "top",
    align: "left",
    x: 6,
    y: 6,
    style: { color: t.inkSoft, fontSize: "12px", fontWeight: "600" },
  },
}));

// Thin stems connecting the axis to each marker — the visual weight that
// fills the band instead of leaving markers floating in blank space.
const stems = events.map((event) => ({
  type: "line",
  data: [
    [event.date, 0],
    [event.date, event.side.markerY],
  ],
  color: t.inkSoft,
  opacity: 0.5,
  lineWidth: 1,
  marker: { enabled: false },
  enableMouseTracking: false,
  showInLegend: false,
  dataLabels: { enabled: false },
}));

const categories = ["Planning", "Development", "Release"];
const categoryColors = { Planning: t.palette[0], Development: t.palette[1], Release: t.palette[2] };
const series = categories.map((category) => ({
  name: category,
  type: "scatter",
  color: categoryColors[category],
  marker: { radius: 8, lineColor: t.pageBg, lineWidth: 2 },
  data: events
    .filter((event) => event.category === category)
    .map((event) => ({
      x: event.date,
      y: event.side.markerY,
      name: event.name,
      marker: EMPHASIZED.has(event.name)
        ? { radius: 15, lineColor: t.ink, lineWidth: 3 }
        : undefined,
      dataLabels: {
        y: event.side.labelY,
        verticalAlign: event.side.verticalAlign,
        style: EMPHASIZED.has(event.name) ? { fontSize: "16px", fontWeight: "700" } : undefined,
      },
    })),
  dataLabels: {
    enabled: true,
    format: "{point.name}",
    align: "center",
    style: { color: t.ink, fontSize: "14px", fontWeight: "600", textOutline: "none" },
  },
}));

// --- Chart -----------------------------------------------------------------
Highcharts.chart("container", {
  chart: { type: "scatter", backgroundColor: "transparent", animation: false,
           style: { fontFamily: "inherit" } },
  credits: { enabled: false },
  colors: t.palette,
  title: { text: "timeline-basic · javascript · highcharts · anyplot.ai",
           style: { color: t.ink, fontSize: "22px", fontWeight: "600" } },
  subtitle: { text: "Software Product Roadmap 2024",
              style: { color: t.inkSoft, fontSize: "14px" } },
  xAxis: {
    type: "datetime",
    min: Date.UTC(2024, 0, 1),
    max: Date.UTC(2024, 11, 31),
    lineColor: t.inkSoft,
    tickColor: t.inkSoft,
    gridLineWidth: 0,
    dateTimeLabelFormats: { month: "%b" },
    labels: { style: { color: t.inkSoft, fontSize: "14px" } },
    plotBands,
  },
  yAxis: {
    visible: false,
    min: -1.75,
    max: 1.75,
  },
  legend: {
    align: "center",
    verticalAlign: "bottom",
    itemStyle: { color: t.inkSoft, fontSize: "14px" },
    itemHoverStyle: { color: t.ink },
  },
  tooltip: {
    formatter() {
      return `<b>${this.point.name}</b><br>${Highcharts.dateFormat("%b %e, %Y", this.point.x)}`;
    },
  },
  plotOptions: { series: { animation: false } },
  series: [
    {
      name: "Timeline",
      type: "line",
      data: [
        [Date.UTC(2024, 0, 1), 0],
        [Date.UTC(2024, 11, 31), 0],
      ],
      color: t.inkSoft,
      lineWidth: 2,
      marker: { enabled: false },
      enableMouseTracking: false,
      showInLegend: false,
      dataLabels: { enabled: false },
    },
    ...stems,
    ...series,
  ],
});
Runnable source as JSON, for any HTTP client: https://api.anyplot.ai/specs/timeline-basic/highcharts/code. Any spec id and library id listed in llms-full.txt fit the same URL shape; every URL below is complete and callable.
{
  "spec_id": "timeline-basic",
  "language": "javascript",
  "library": "highcharts",
  "page": "https://anyplot.ai/timeline-basic/javascript/highcharts",
  "hub": "https://anyplot.ai/timeline-basic",
  "code_json": "https://api.anyplot.ai/specs/timeline-basic/highcharts/code",
  "spec_json": "https://api.anyplot.ai/specs/timeline-basic",
  "render_light_png": "https://storage.googleapis.com/anyplot-images/plots/timeline-basic/javascript/highcharts/plot-light.png",
  "render_dark_png": "https://storage.googleapis.com/anyplot-images/plots/timeline-basic/javascript/highcharts/plot-dark.png",
  "interactive_light_html": "https://storage.googleapis.com/anyplot-images/plots/timeline-basic/javascript/highcharts/plot-light.html",
  "interactive_dark_html": "https://storage.googleapis.com/anyplot-images/plots/timeline-basic/javascript/highcharts/plot-dark.html",
  "quality_score": 92.0,
  "license": "MIT",
  "guide": "https://anyplot.ai/llms.txt"
}
Part of Event Timeline on anyplot.ai.