The same plot in 14 other libraries — JavaScript: D3.js, Apache ECharts, Highcharts, MUI X Charts; Python: Altair, Bokeh, lets-plot, Matplotlib, Plotly, plotnine, Pygal, Seaborn; R: ggplot2; Julia: Makie.jl. Compare all 15 side by side: Acid-Base Titration Curve in Python, R, Julia and JavaScript.
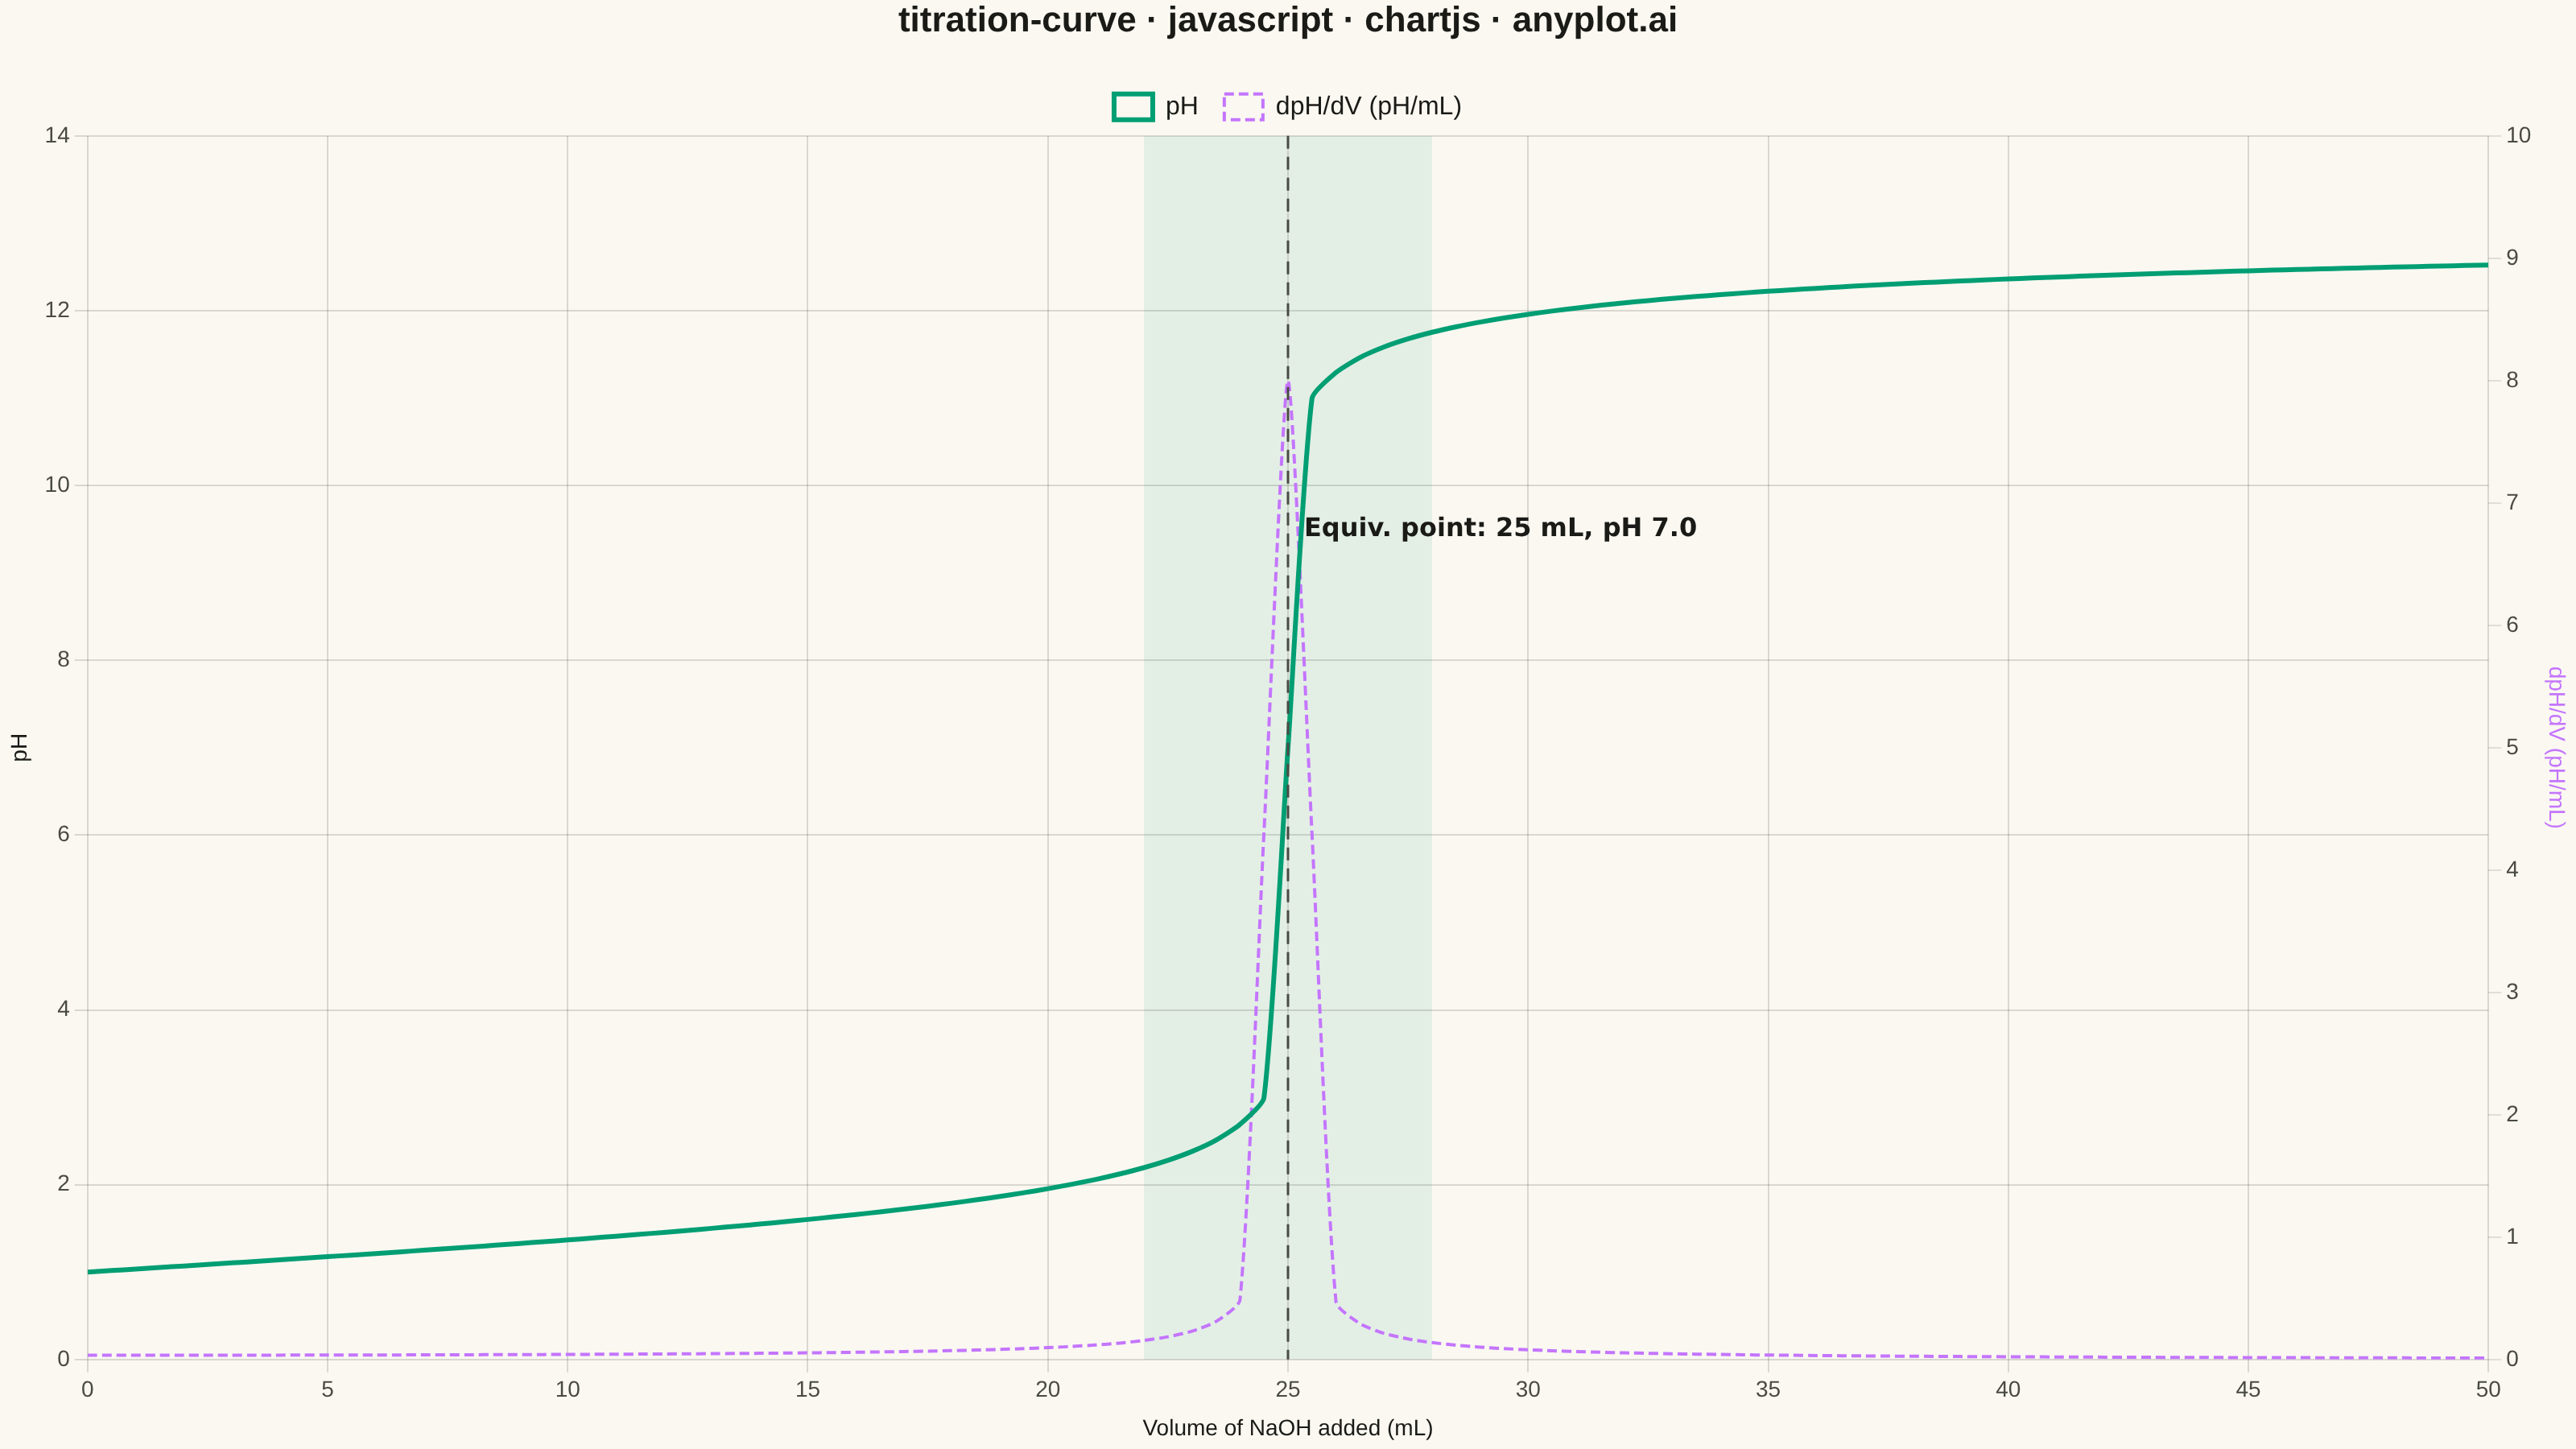
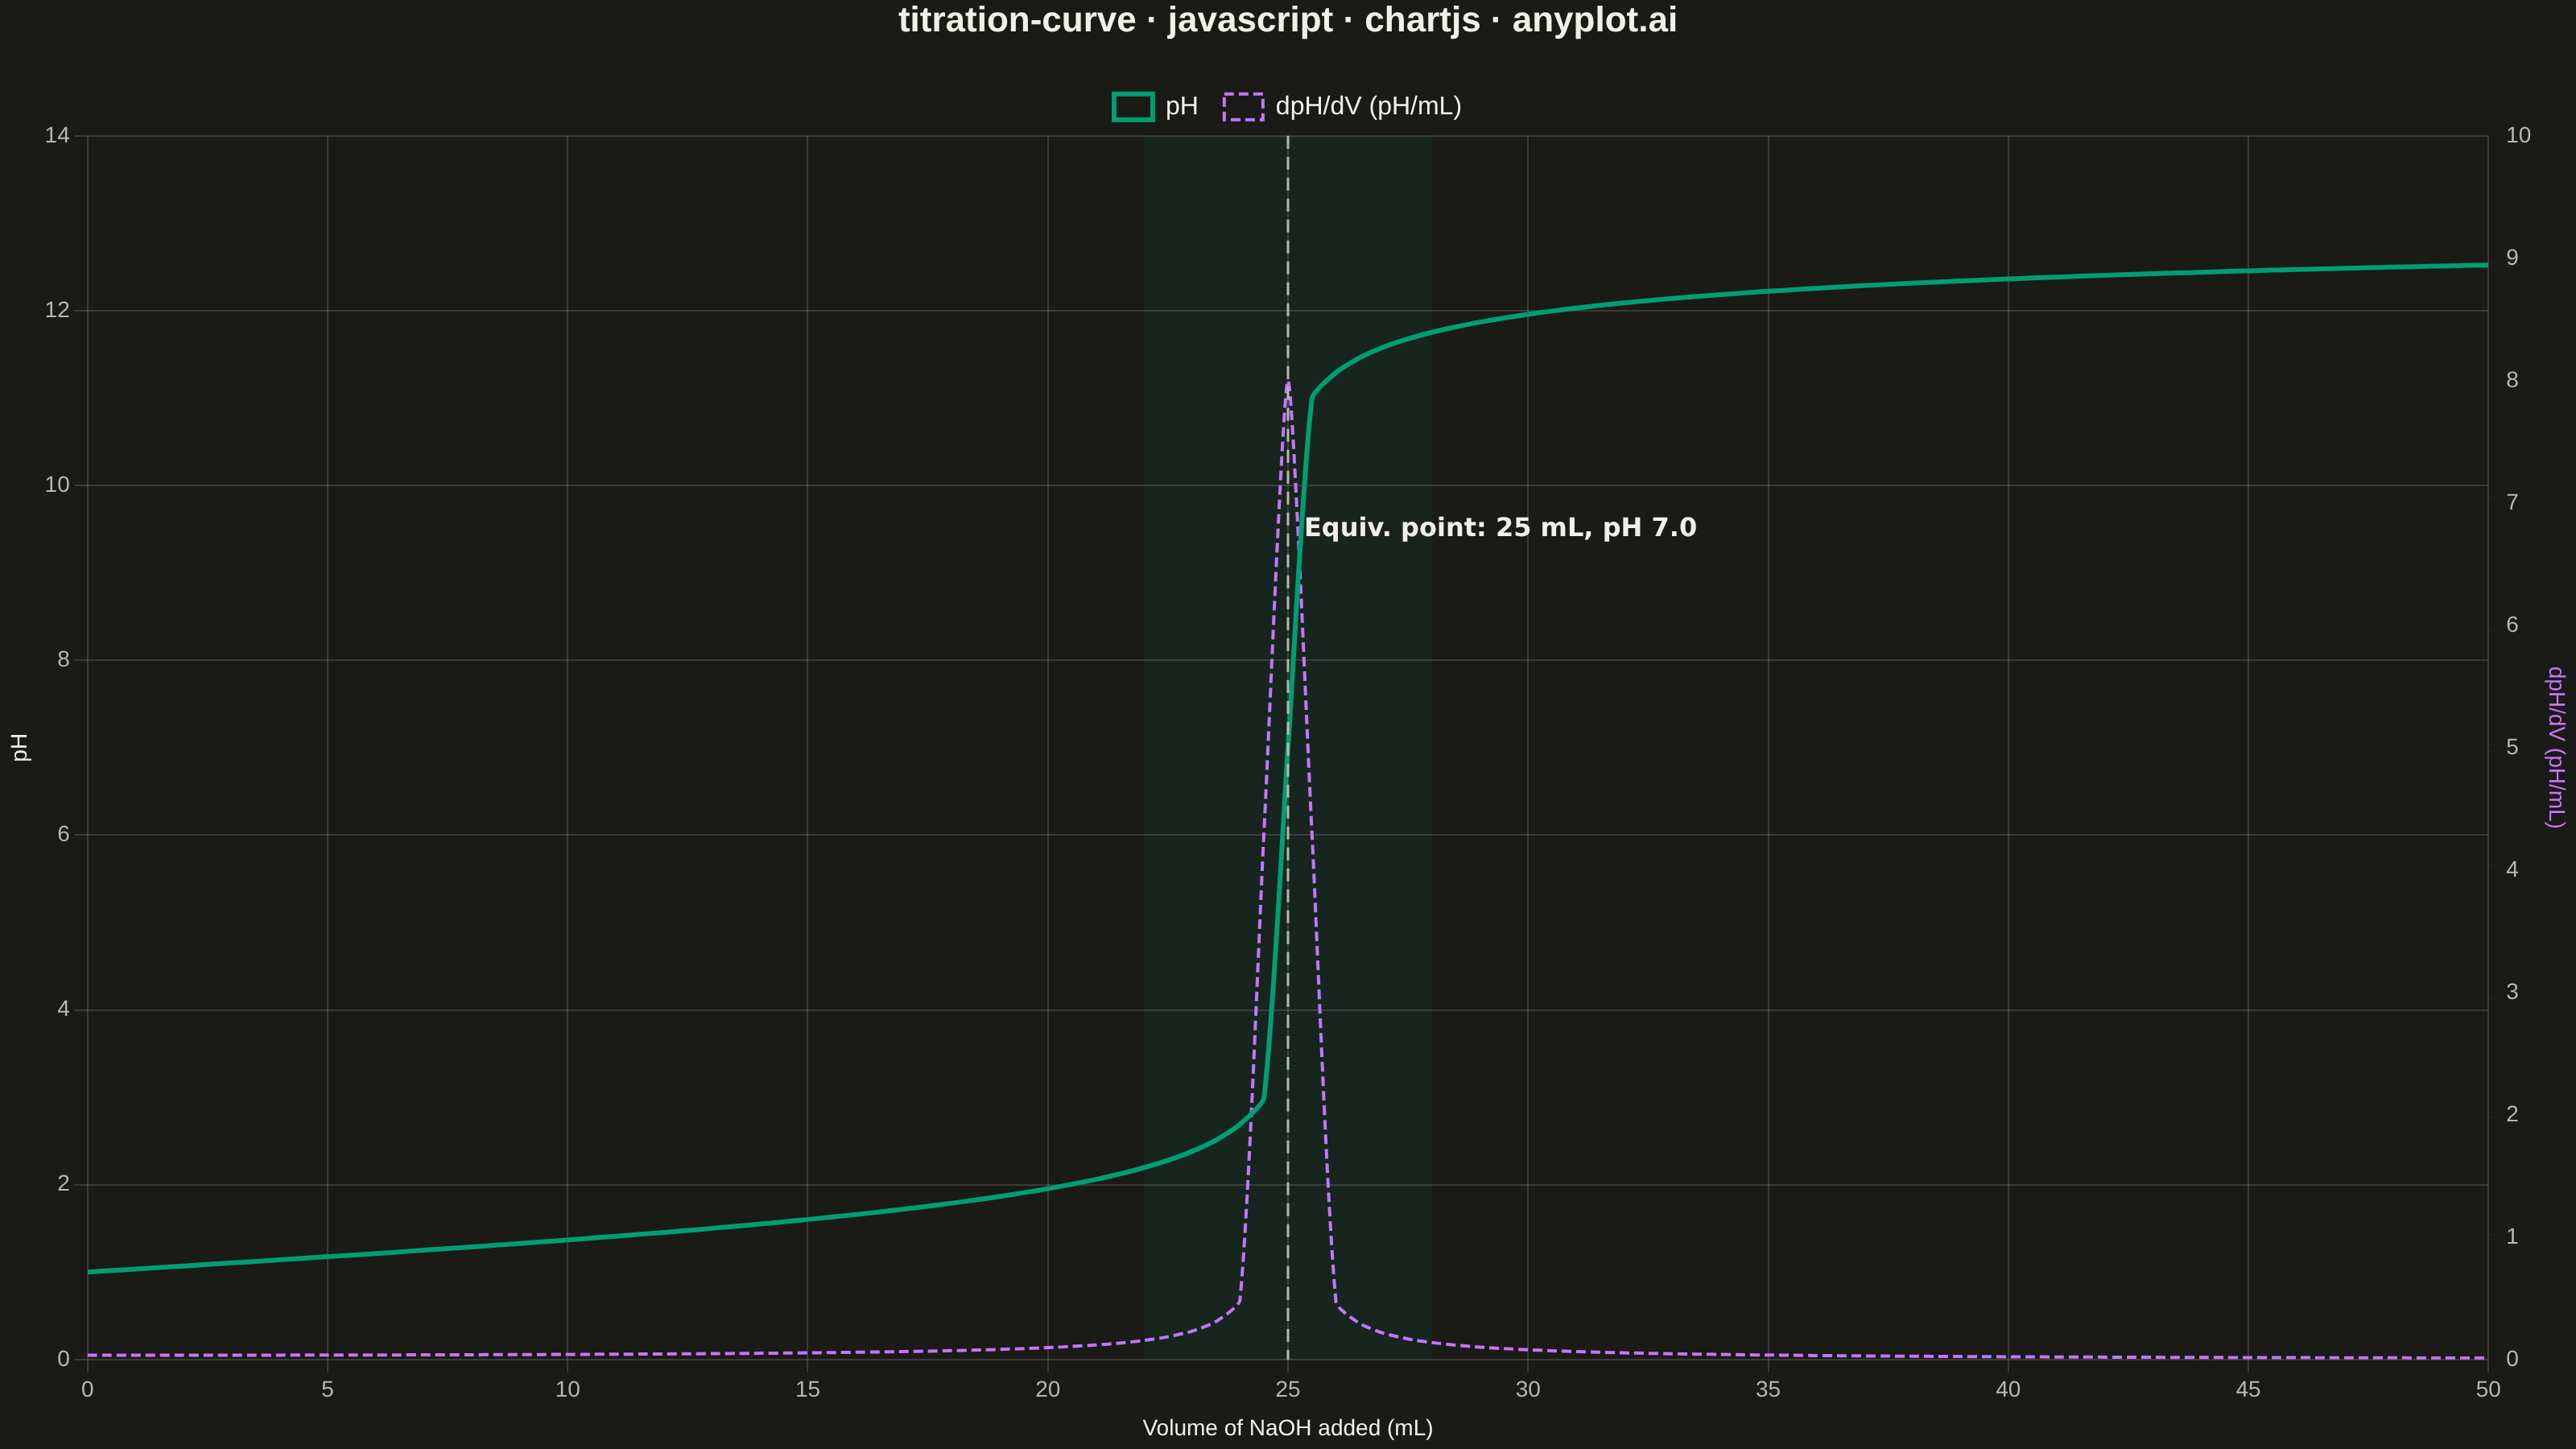
A titration curve plotting pH against volume of titrant added, producing the characteristic S-shaped (sigmoidal) curve used in analytical chemistry. The plot reveals buffer regions, equivalence points, and acid/base strength at a glance. Essential for chemistry education and laboratory analysis, it helps identify when a reaction reaches completion and which indicators are appropriate.
// anyplot.ai
// titration-curve: Acid-Base Titration Curve
// Library: chartjs 4.4.7 | JavaScript 22.22.3
// Quality: 89/100 | Created: 2026-06-24

const t = window.ANYPLOT_TOKENS;

// 25 mL of 0.1 M HCl titrated with 0.1 M NaOH (strong acid / strong base)
const Va = 25;   // initial HCl volume (mL)
const Ca = 0.1;  // HCl concentration (mol/L)
const Cb = 0.1;  // NaOH concentration (mol/L)

const volumes = Array.from({ length: 101 }, (_, i) => i * 0.5);

const pHValues = volumes.map(v => {
    const molesAcid = (Ca * Va) / 1000;
    const molesBase = (Cb * v) / 1000;
    const totalVol = (Va + v) / 1000;
    const netAcid = molesAcid - molesBase;
    let ph;
    if (Math.abs(netAcid) < 1e-8) {
        ph = 7.0;
    } else if (netAcid > 0) {
        ph = -Math.log10(netAcid / totalVol);
    } else {
        ph = 14 + Math.log10((-netAcid) / totalVol);
    }
    return Math.max(0, Math.min(14, ph));
});

// Central-difference derivative dpH/dV
const STEP = 0.5;
const derivatives = volumes.map((v, i) => {
    if (i === 0) return (pHValues[1] - pHValues[0]) / STEP;
    if (i === volumes.length - 1) return (pHValues[i] - pHValues[i - 1]) / STEP;
    return (pHValues[i + 1] - pHValues[i - 1]) / (2 * STEP);
});

// Equivalence point: volume at peak of derivative
let equivIdx = 0;
derivatives.forEach((d, i) => { if (d > derivatives[equivIdx]) equivIdx = i; });
const equivVol = volumes[equivIdx];
const equivPH = pHValues[equivIdx];

// Transition zone ±3 mL around equivalence point (steep pH-change region)
const shadeStart = equivVol - 3;
const shadeEnd = equivVol + 3;

// Inline Chart.js plugin for dashed equivalence line and zone shading
const annotationPlugin = {
    id: 'titrationAnnotations',
    beforeDraw(chart) {
        const { ctx, scales: { x, y } } = chart;
        const x1 = x.getPixelForValue(shadeStart);
        const x2 = x.getPixelForValue(shadeEnd);
        ctx.save();
        ctx.fillStyle = 'rgba(0, 158, 115, 0.09)';
        ctx.fillRect(x1, y.top, x2 - x1, y.bottom - y.top);
        ctx.restore();
    },
    afterDraw(chart) {
        const { ctx, scales: { x, y } } = chart;
        const xPixel = x.getPixelForValue(equivVol);

        // Vertical dashed line at equivalence point
        ctx.save();
        ctx.setLineDash([8, 5]);
        ctx.strokeStyle = t.inkSoft;
        ctx.lineWidth = 1.5;
        ctx.beginPath();
        ctx.moveTo(xPixel, y.top);
        ctx.lineTo(xPixel, y.bottom);
        ctx.stroke();

        // Equivalence point label
        ctx.setLineDash([]);
        ctx.fillStyle = t.ink;
        ctx.font = 'bold 16px system-ui, sans-serif';
        ctx.textAlign = 'left';
        ctx.textBaseline = 'middle';
        ctx.fillText(
            `Equiv. point: ${equivVol} mL, pH ${equivPH.toFixed(1)}`,
            xPixel + 10,
            y.getPixelForValue(9.5)
        );
        ctx.restore();
    },
};

// Mount canvas into the harness container
const canvas = document.createElement('canvas');
document.getElementById('container').appendChild(canvas);

new Chart(canvas, {
    type: 'line',
    data: {
        datasets: [
            {
                label: 'pH',
                data: volumes.map((v, i) => ({ x: v, y: pHValues[i] })),
                borderColor: t.palette[0],
                backgroundColor: 'transparent',
                borderWidth: 3,
                pointRadius: 0,
                tension: 0.2,
                yAxisID: 'y',
            },
            {
                label: 'dpH/dV (pH/mL)',
                data: volumes.map((v, i) => ({ x: v, y: derivatives[i] })),
                borderColor: t.palette[1],
                backgroundColor: 'transparent',
                borderWidth: 2,
                borderDash: [6, 3],
                pointRadius: 0,
                tension: 0.2,
                yAxisID: 'y2',
            },
        ],
    },
    options: {
        responsive: true,
        maintainAspectRatio: false,
        animation: false,
        plugins: {
            title: {
                display: true,
                text: 'titration-curve · javascript · chartjs · anyplot.ai',
                color: t.ink,
                font: { size: 22 },
                padding: { bottom: 16 },
            },
            legend: {
                labels: {
                    color: t.ink,
                    font: { size: 16 },
                    boxWidth: 24,
                    padding: 16,
                },
            },
        },
        scales: {
            x: {
                type: 'linear',
                title: {
                    display: true,
                    text: 'Volume of NaOH added (mL)',
                    color: t.ink,
                    font: { size: 14 },
                },
                ticks: { color: t.inkSoft, font: { size: 14 } },
                grid: { color: t.grid },
                border: { display: false },
                min: 0,
                max: 50,
            },
            y: {
                title: {
                    display: true,
                    text: 'pH',
                    color: t.ink,
                    font: { size: 14 },
                },
                ticks: { color: t.inkSoft, font: { size: 14 } },
                grid: { color: t.grid },
                border: { display: false },
                min: 0,
                max: 14,
            },
            y2: {
                type: 'linear',
                position: 'right',
                title: {
                    display: true,
                    text: 'dpH/dV (pH/mL)',
                    color: t.palette[1],
                    font: { size: 14 },
                },
                ticks: { color: t.inkSoft, font: { size: 14 } },
                grid: { drawOnChartArea: false },
                border: { display: false },
                min: 0,
                max: 10,
            },
        },
    },
    plugins: [annotationPlugin],
});
Runnable source as JSON, for any HTTP client: https://api.anyplot.ai/specs/titration-curve/chartjs/code. Any spec id and library id listed in llms-full.txt fit the same URL shape; every URL below is complete and callable.
{
  "spec_id": "titration-curve",
  "language": "javascript",
  "library": "chartjs",
  "page": "https://anyplot.ai/titration-curve/javascript/chartjs",
  "hub": "https://anyplot.ai/titration-curve",
  "code_json": "https://api.anyplot.ai/specs/titration-curve/chartjs/code",
  "spec_json": "https://api.anyplot.ai/specs/titration-curve",
  "render_light_png": "https://storage.googleapis.com/anyplot-images/plots/titration-curve/javascript/chartjs/plot-light.png",
  "render_dark_png": "https://storage.googleapis.com/anyplot-images/plots/titration-curve/javascript/chartjs/plot-dark.png",
  "interactive_light_html": "https://storage.googleapis.com/anyplot-images/plots/titration-curve/javascript/chartjs/plot-light.html",
  "interactive_dark_html": "https://storage.googleapis.com/anyplot-images/plots/titration-curve/javascript/chartjs/plot-dark.html",
  "quality_score": 89.0,
  "license": "MIT",
  "guide": "https://anyplot.ai/llms.txt"
}
Part of Acid-Base Titration Curve on anyplot.ai.