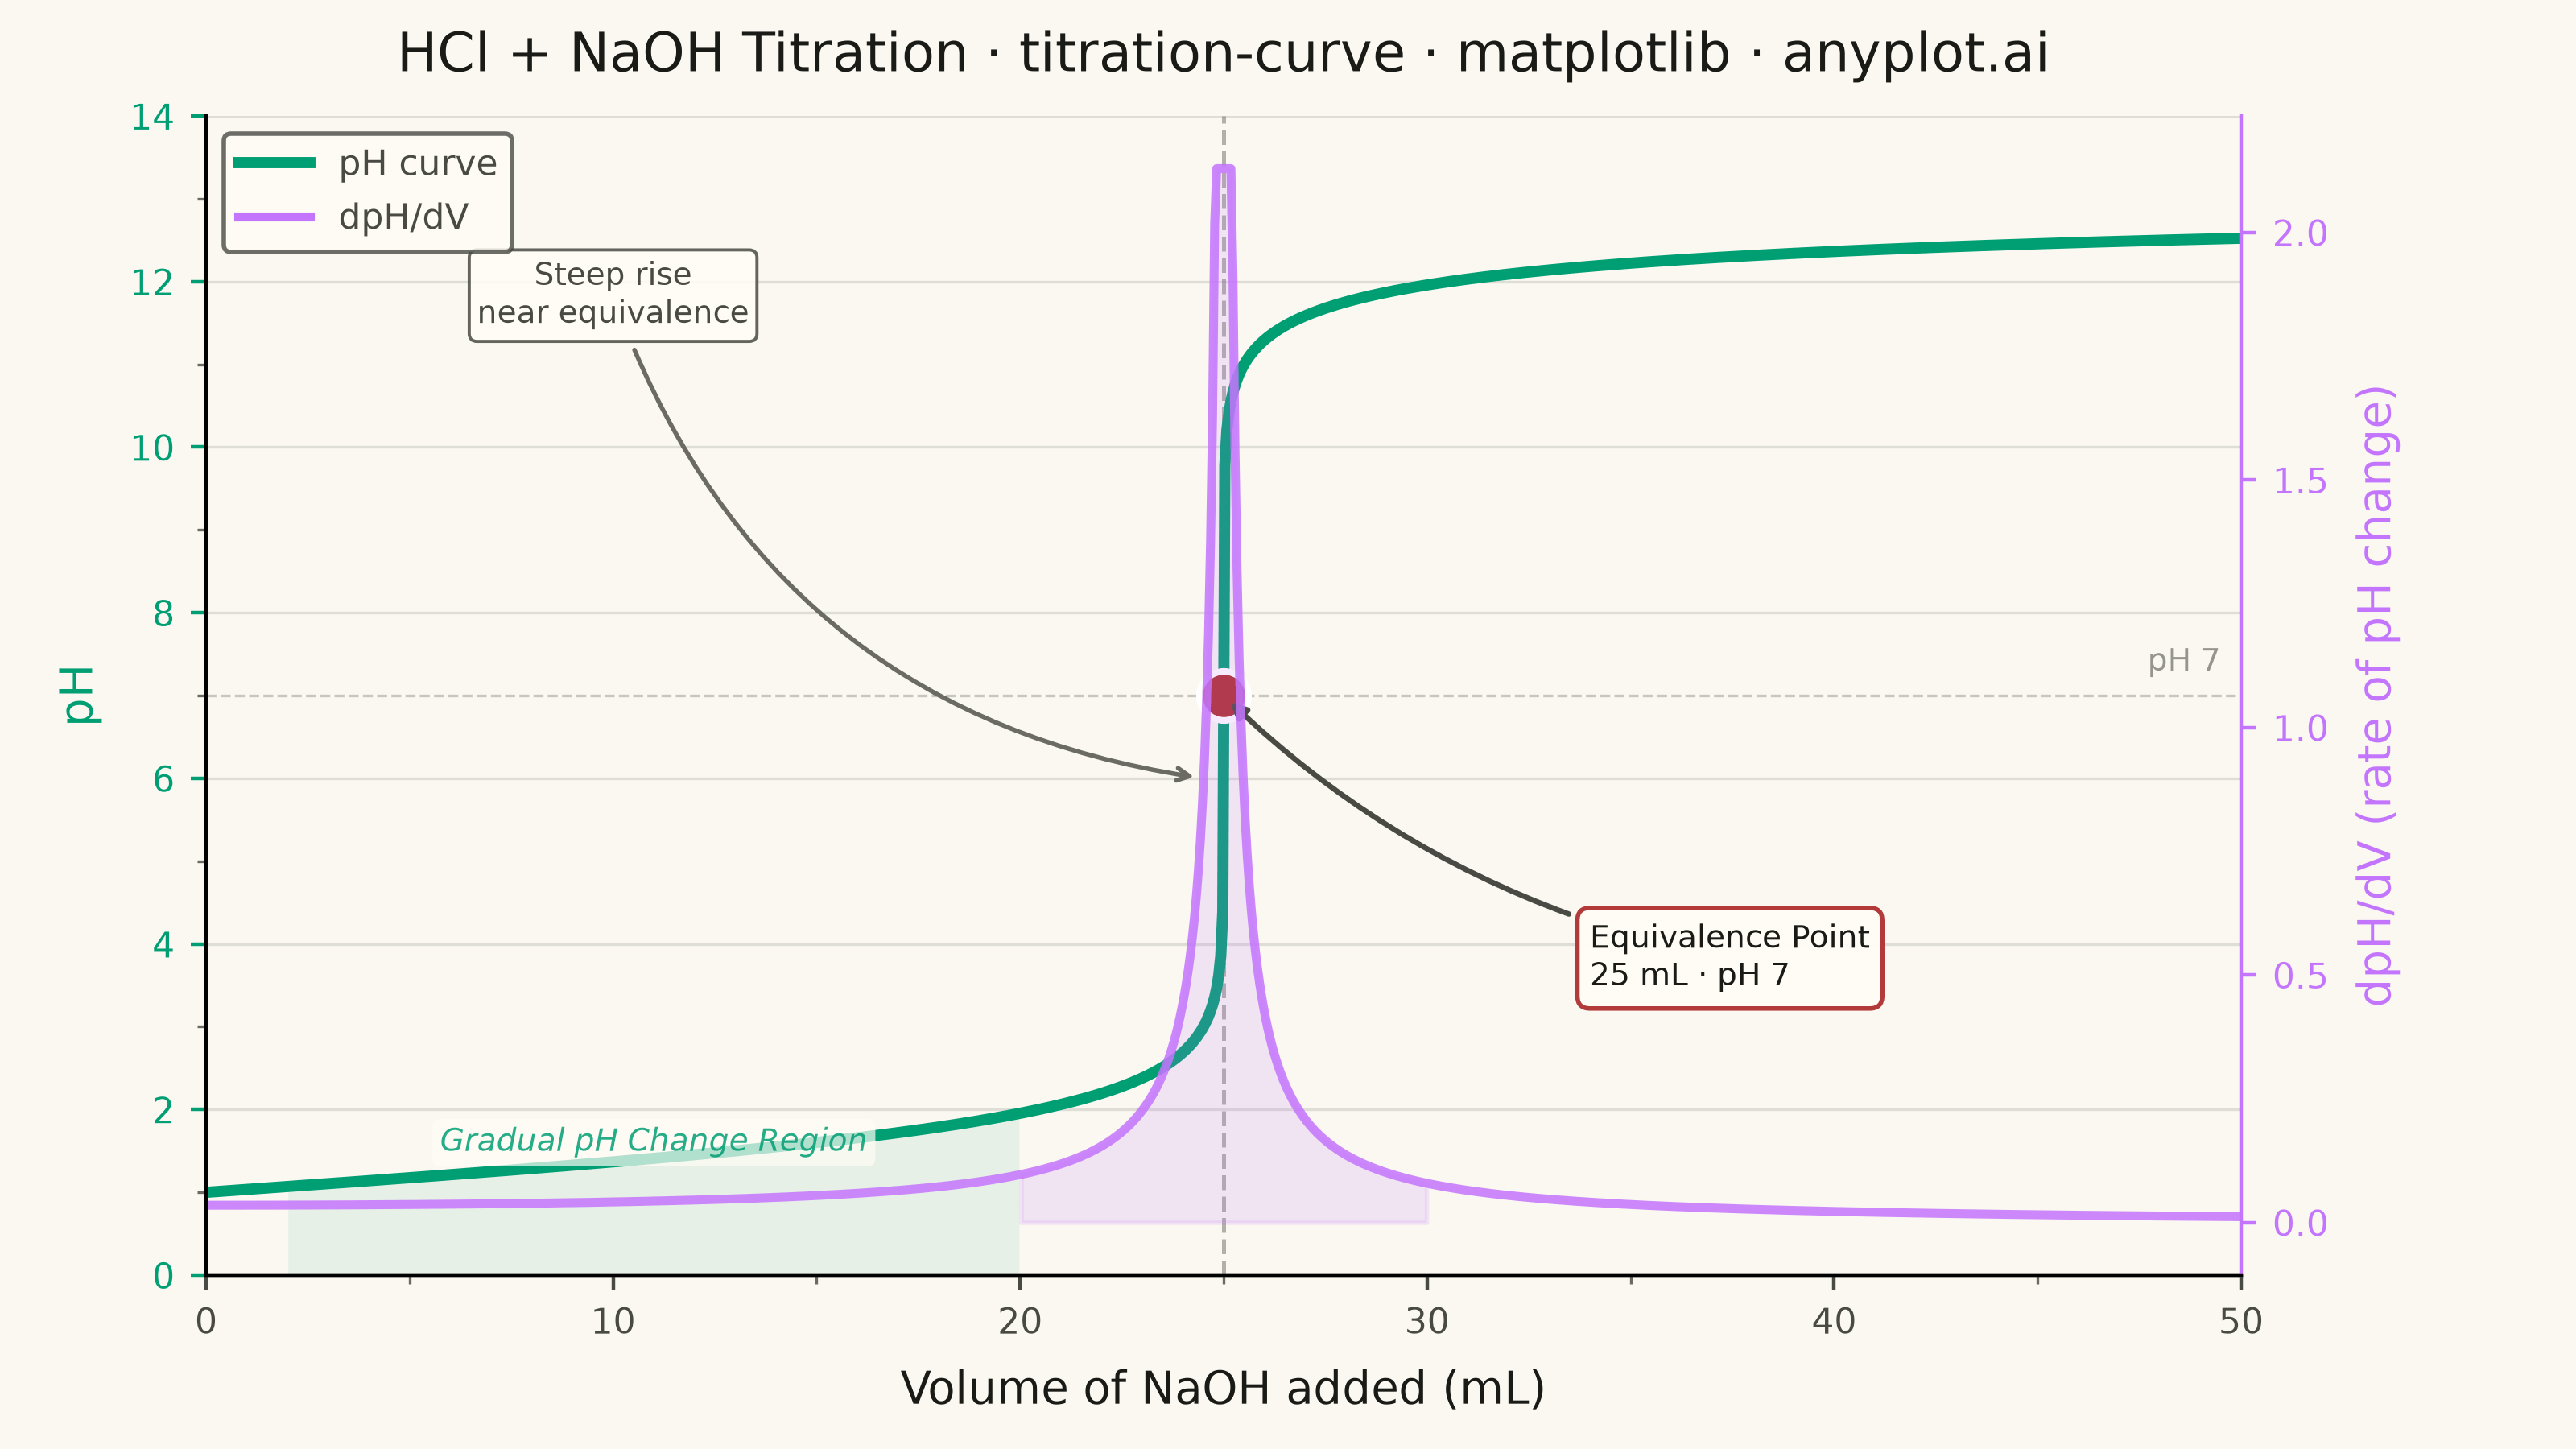
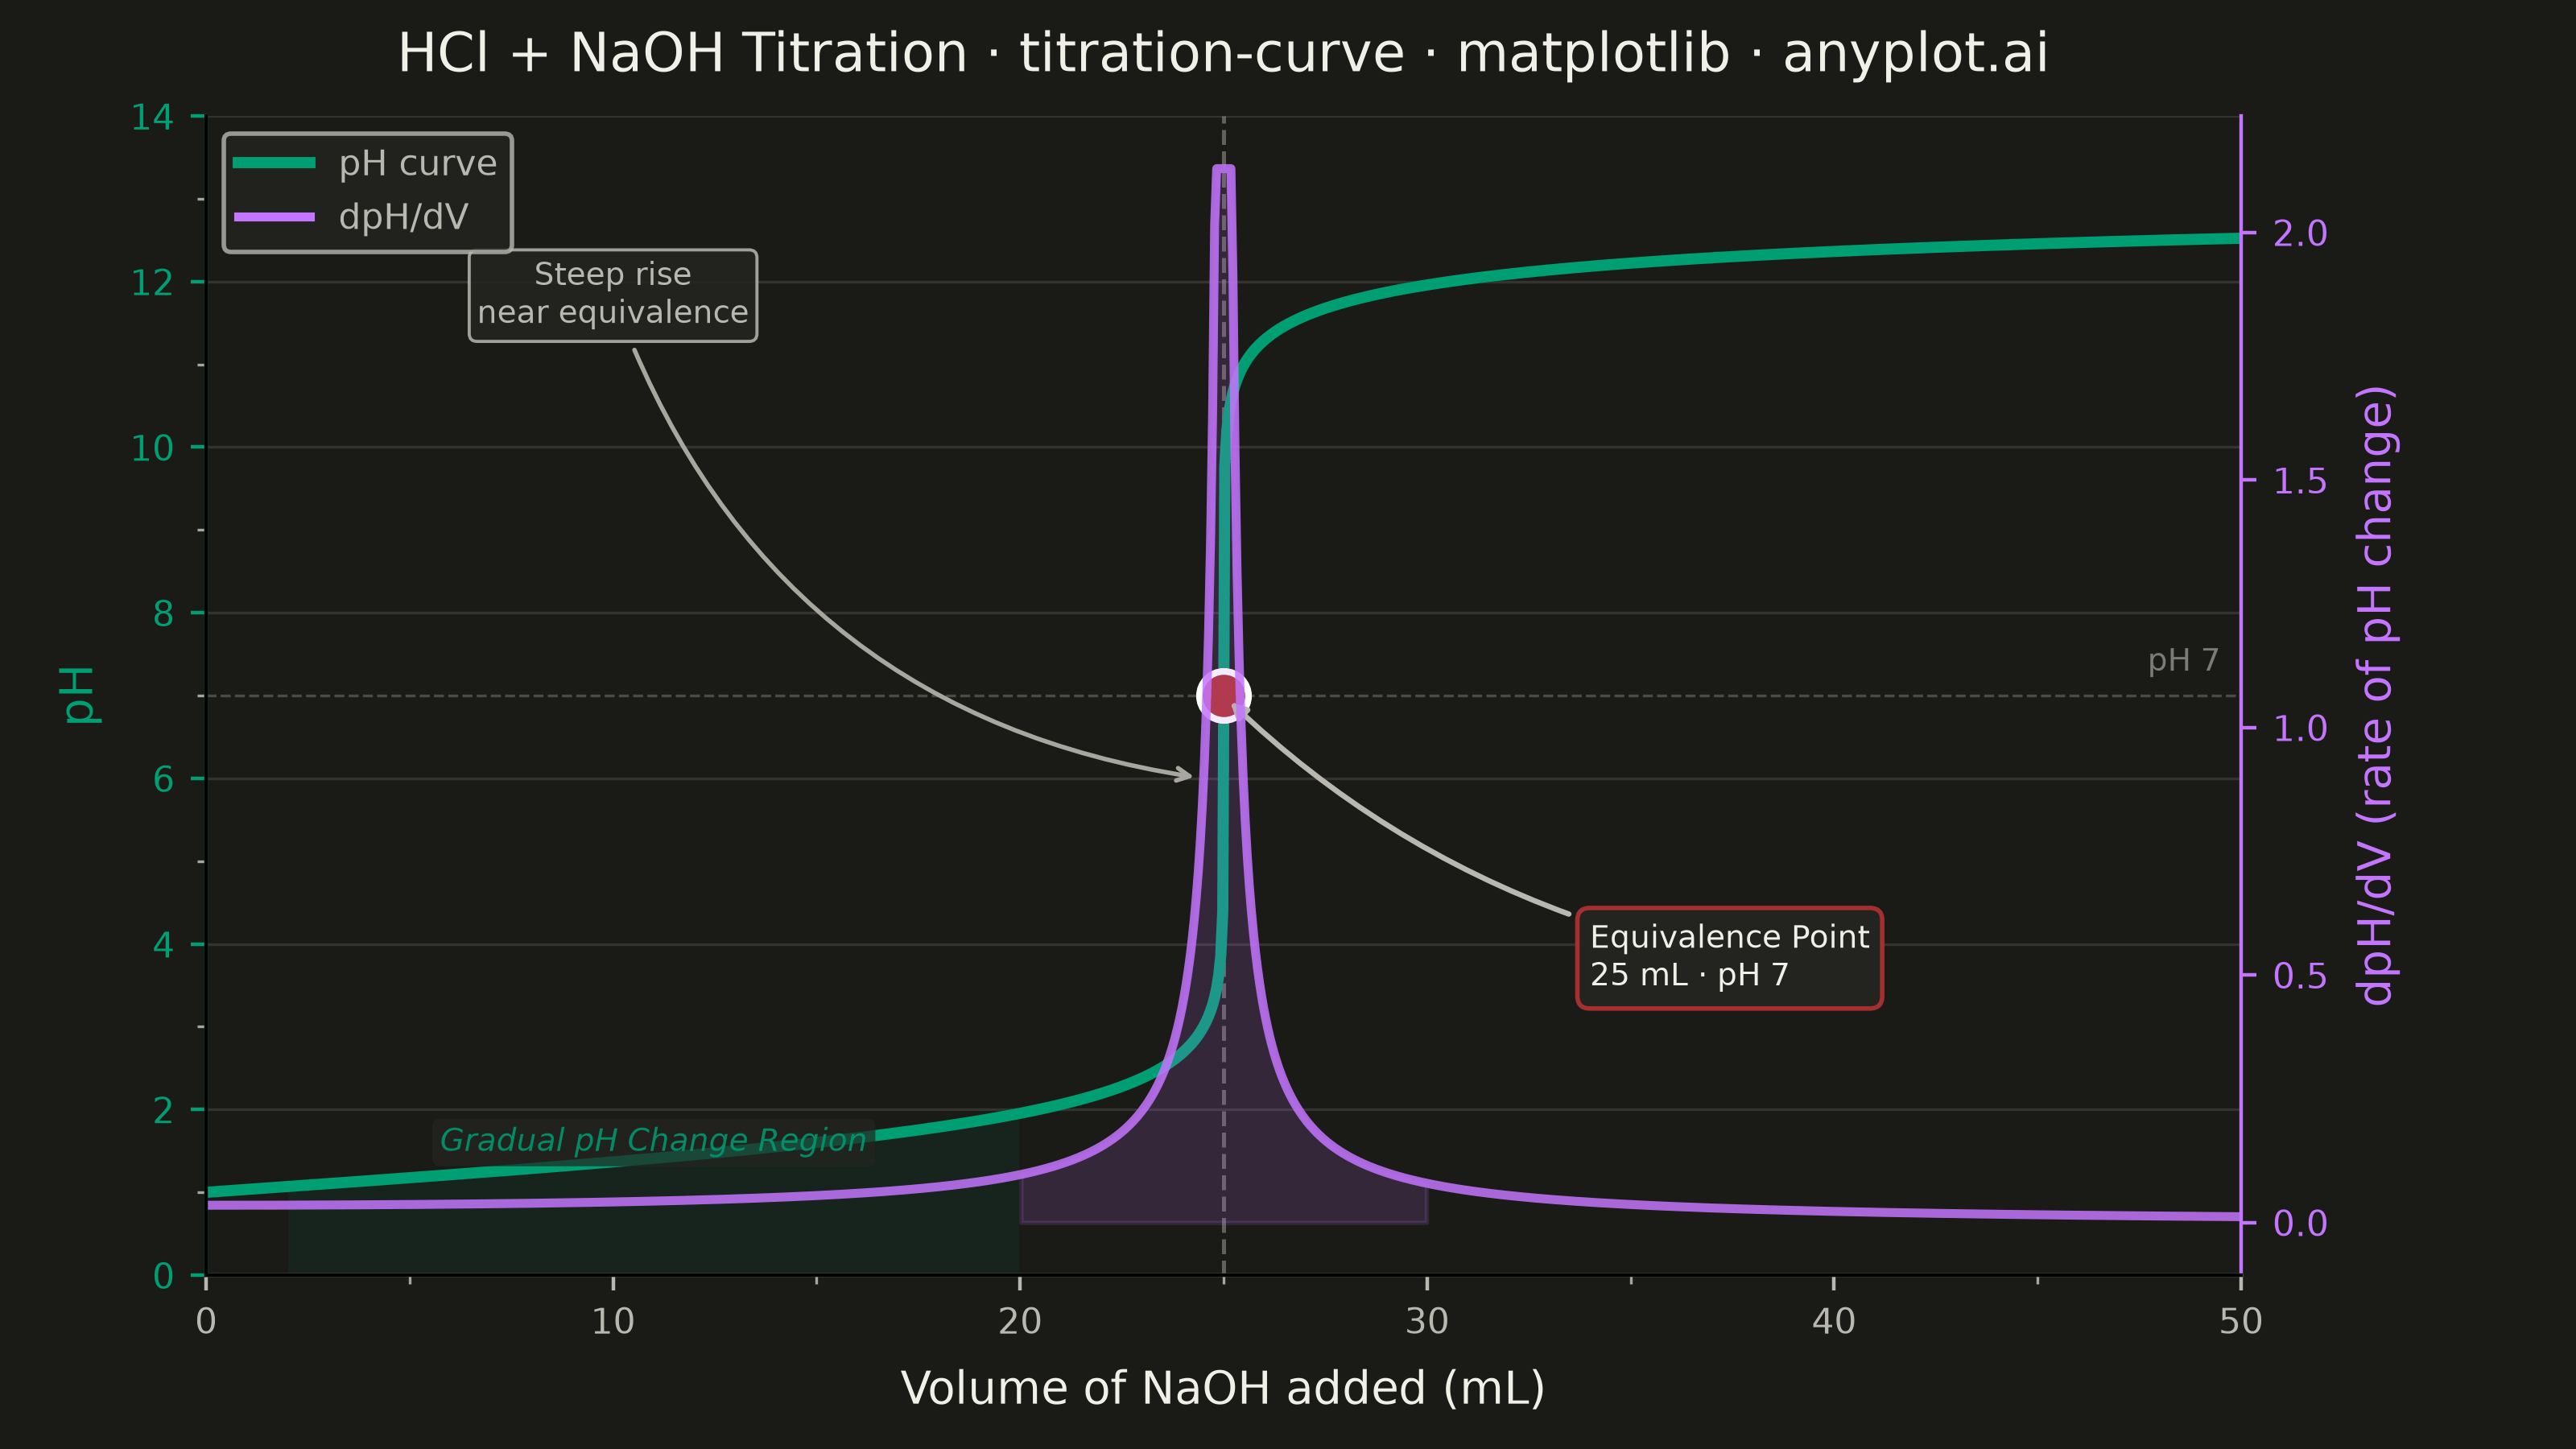
A titration curve plotting pH against volume of titrant added, producing the characteristic S-shaped (sigmoidal) curve used in analytical chemistry. The plot reveals buffer regions, equivalence points, and acid/base strength at a glance. Essential for chemistry education and laboratory analysis, it helps identify when a reaction reaches completion and which indicators are appropriate.
""" anyplot.ai
titration-curve: Acid-Base Titration Curve
Library: matplotlib 3.11.0 | Python 3.13.14
Quality: 90/100 | Updated: 2026-06-24
"""

import os
import sys


# Prevent this file from shadowing the installed matplotlib package on sys.path
_sd = os.path.dirname(os.path.abspath(__file__))
sys.path = [p for p in sys.path if os.path.abspath(p or ".") != _sd]
del _sd

import matplotlib.pyplot as plt
import matplotlib.ticker as ticker
import numpy as np
from matplotlib.lines import Line2D


# --- Theme ---
THEME = os.getenv("ANYPLOT_THEME", "light")
PAGE_BG = "#FAF8F1" if THEME == "light" else "#1A1A17"
ELEVATED_BG = "#FFFDF6" if THEME == "light" else "#242420"
INK = "#1A1A17" if THEME == "light" else "#F0EFE8"
INK_SOFT = "#4A4A44" if THEME == "light" else "#B8B7B0"
INK_MUTED = "#6B6A63" if THEME == "light" else "#A8A79F"

# Imprint palette
IMPRINT = ["#009E73", "#C475FD", "#4467A3", "#BD8233", "#AE3030", "#2ABCCD", "#954477", "#99B314"]

# --- Data: 25 mL of 0.1 M HCl titrated with 0.1 M NaOH ---
c_acid, v_acid, c_base = 0.1, 25.0, 0.1
volume_ml = np.linspace(0.01, 50, 1000)
moles_acid = c_acid * v_acid / 1000
moles_base = c_base * volume_ml / 1000
total_volume = (v_acid + volume_ml) / 1000

excess_acid = moles_acid - moles_base
excess_base = moles_base - moles_acid
ph = np.where(
    excess_acid > 1e-10,
    -np.log10(excess_acid / total_volume),
    np.where(excess_base > 1e-10, 14.0 + np.log10(excess_base / total_volume), 7.0),
)

dph_dv = np.gradient(ph, volume_ml)
eq_volume = v_acid * c_acid / c_base  # 25 mL
eq_ph = 7.0

dph_cap = np.percentile(dph_dv, 99) * 1.3
dph_dv_display = np.clip(dph_dv, 0, dph_cap)

# --- Canvas: 3200×1800 px (landscape 16:9) ---
fig, ax1 = plt.subplots(figsize=(8, 4.5), dpi=400, facecolor=PAGE_BG)
ax1.set_facecolor(PAGE_BG)
ax2 = ax1.twinx()
ax2.patch.set_alpha(0)

ph_color = IMPRINT[0]  # #009E73 — Imprint position 1 (brand green)
dphdv_color = IMPRINT[1]  # #C475FD — Imprint position 2 (lavender)

# --- pH curve (primary) ---
ax1.plot(volume_ml, ph, color=ph_color, linewidth=2.5, zorder=3, solid_capstyle="round")

# --- Derivative curve (secondary) ---
ax2.plot(volume_ml, dph_dv_display, color=dphdv_color, linewidth=2.0, alpha=0.85, zorder=2)
peak_mask = (volume_ml >= 20) & (volume_ml <= 30)
ax2.fill_between(volume_ml[peak_mask], 0, dph_dv_display[peak_mask], color=dphdv_color, alpha=0.15, zorder=1)

# --- Equivalence point — dashed vertical line (spec requirement) ---
ax1.axvline(x=eq_volume, color=INK_MUTED, linestyle="--", linewidth=0.9, alpha=0.5, zorder=2)
ax1.scatter([eq_volume], [eq_ph], color=IMPRINT[4], s=120, edgecolors="white", linewidth=1.5, zorder=5)
ax1.annotate(
    f"Equivalence Point\n{eq_volume:.0f} mL · pH {eq_ph:.0f}",
    xy=(eq_volume, eq_ph),
    xytext=(eq_volume + 9, eq_ph - 3.5),
    fontsize=7,
    fontweight="medium",
    color=INK,
    arrowprops={"arrowstyle": "-|>", "color": INK_SOFT, "lw": 1.2, "connectionstyle": "arc3,rad=-0.15"},
    bbox={
        "boxstyle": "round,pad=0.4",
        "facecolor": ELEVATED_BG,
        "edgecolor": IMPRINT[4],
        "alpha": 0.95,
        "linewidth": 1.0,
    },
    zorder=6,
)

# --- Buffer region shading (lighter alpha) ---
buf_mask = (volume_ml >= 2) & (volume_ml <= 20)
ax1.fill_between(volume_ml[buf_mask], 0, ph[buf_mask], alpha=0.08, color=ph_color, zorder=1, linewidth=0)
ax1.text(
    11,
    1.5,
    "Gradual pH Change Region",
    fontsize=7,
    color=ph_color,
    alpha=0.85,
    ha="center",
    style="italic",
    bbox={"boxstyle": "round,pad=0.25", "facecolor": ELEVATED_BG, "edgecolor": "none", "alpha": 0.7},
)

# --- Steep rise annotation ---
ax1.annotate(
    "Steep rise\nnear equivalence",
    xy=(24.5, 6),
    xytext=(10, 11.5),
    fontsize=7,
    color=INK_SOFT,
    ha="center",
    arrowprops={"arrowstyle": "->", "color": INK_MUTED, "lw": 1.0, "connectionstyle": "arc3,rad=0.3"},
    bbox={
        "boxstyle": "round,pad=0.25",
        "facecolor": ELEVATED_BG,
        "edgecolor": INK_SOFT,
        "alpha": 0.85,
        "linewidth": 0.7,
    },
)

# --- Neutral pH reference line ---
ax1.axhline(y=7, color=INK_MUTED, linestyle="--", linewidth=0.6, alpha=0.35, zorder=1)
ax1.text(49.5, 7.3, "pH 7", fontsize=7, color=INK_MUTED, ha="right", alpha=0.7)

# --- Primary axis styling ---
ax1.set_xlabel("Volume of NaOH added (mL)", fontsize=10, color=INK, labelpad=6)
ax1.set_ylabel("pH", fontsize=10, color=ph_color, labelpad=6)
ax1.set_ylim(0, 14)
ax1.set_xlim(0, 50)
ax1.tick_params(axis="x", labelsize=8, colors=INK_SOFT)
ax1.tick_params(axis="y", labelsize=8, colors=ph_color, labelcolor=ph_color)
ax1.spines["top"].set_visible(False)
ax1.spines["right"].set_visible(False)
ax1.spines["left"].set_color(ph_color)
ax1.spines["bottom"].set_color(INK_SOFT)
ax1.yaxis.grid(True, alpha=0.12, linewidth=0.6, color=INK)
ax1.xaxis.set_minor_locator(ticker.AutoMinorLocator(2))
ax1.yaxis.set_minor_locator(ticker.AutoMinorLocator(2))
ax1.tick_params(which="minor", length=2, color=INK_MUTED)

# --- Secondary axis styling ---
ax2.set_ylabel("dpH/dV (rate of pH change)", fontsize=10, color=dphdv_color, labelpad=6)
ax2.tick_params(axis="y", labelsize=8, colors=dphdv_color, labelcolor=dphdv_color)
ax2.spines["top"].set_visible(False)
ax2.spines["right"].set_color(dphdv_color)

# --- Legend ---
legend_elements = [
    Line2D([0], [0], color=ph_color, linewidth=2.5, label="pH curve"),
    Line2D([0], [0], color=dphdv_color, linewidth=2.0, label="dpH/dV"),
]
leg = ax1.legend(handles=legend_elements, fontsize=8, loc="upper left")
leg.get_frame().set_facecolor(ELEVATED_BG)
leg.get_frame().set_edgecolor(INK_SOFT)
plt.setp(leg.get_texts(), color=INK_SOFT)

# --- Title (fontsize scaled by length) ---
title = "HCl + NaOH Titration · titration-curve · matplotlib · anyplot.ai"
title_fontsize = max(8, round(12 * 67 / len(title))) if len(title) > 67 else 12
ax1.set_title(title, fontsize=title_fontsize, fontweight="medium", pad=10, color=INK)

fig.subplots_adjust(left=0.08, right=0.87, top=0.92, bottom=0.12)
plt.savefig(f"plot-{THEME}.png", dpi=400, facecolor=PAGE_BG)
Runnable source as JSON, for any HTTP client: https://api.anyplot.ai/specs/titration-curve/matplotlib/code. Any spec id and library id listed in llms-full.txt fit the same URL shape; every URL below is complete and callable.
{
  "spec_id": "titration-curve",
  "language": "python",
  "library": "matplotlib",
  "page": "https://anyplot.ai/titration-curve/python/matplotlib",
  "hub": "https://anyplot.ai/titration-curve",
  "code_json": "https://api.anyplot.ai/specs/titration-curve/matplotlib/code",
  "spec_json": "https://api.anyplot.ai/specs/titration-curve",
  "render_light_png": "https://storage.googleapis.com/anyplot-images/plots/titration-curve/python/matplotlib/plot-light.png",
  "render_dark_png": "https://storage.googleapis.com/anyplot-images/plots/titration-curve/python/matplotlib/plot-dark.png",
  "quality_score": 90.0,
  "license": "MIT",
  "guide": "https://anyplot.ai/llms.txt"
}
Part of Acid-Base Titration Curve on anyplot.ai.