The same plot in 14 other libraries — JavaScript: Chart.js, D3.js, Apache ECharts, MUI X Charts; Python: Altair, Bokeh, lets-plot, Matplotlib, Plotly, plotnine, Pygal, Seaborn; R: ggplot2; Julia: Makie.jl. Compare all 15 side by side: Acid-Base Titration Curve in Python, R, Julia and JavaScript.
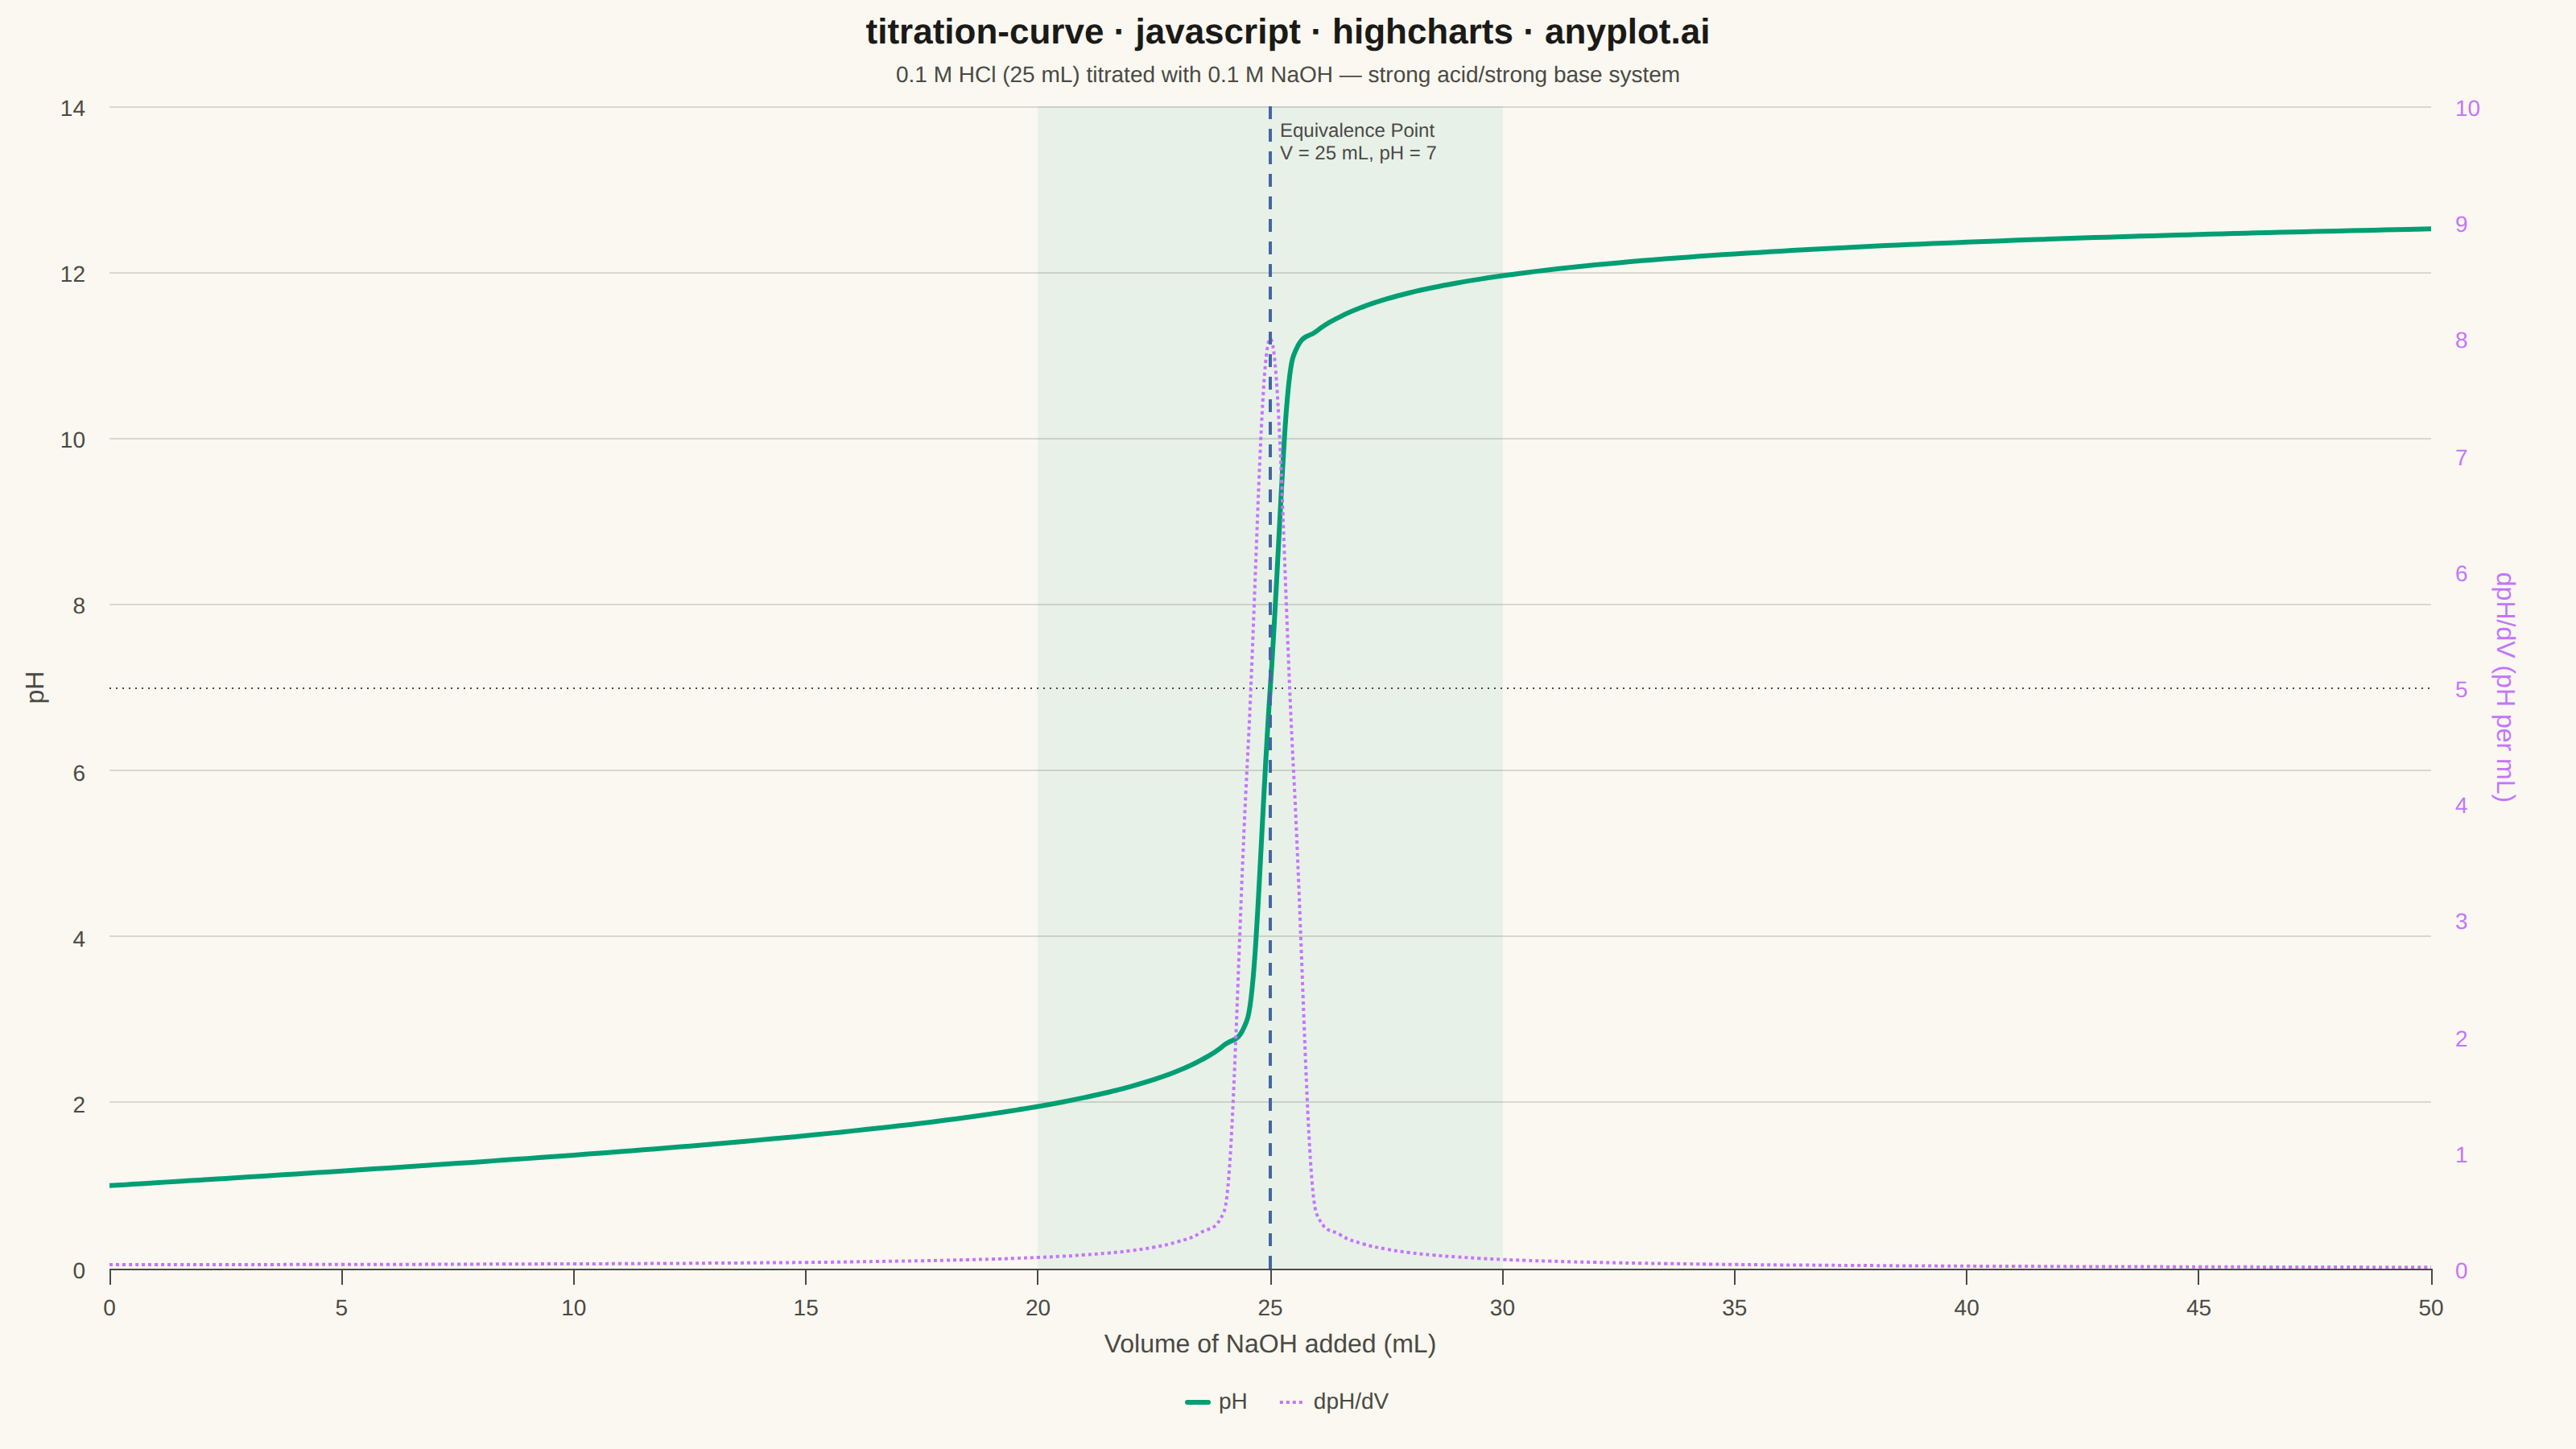
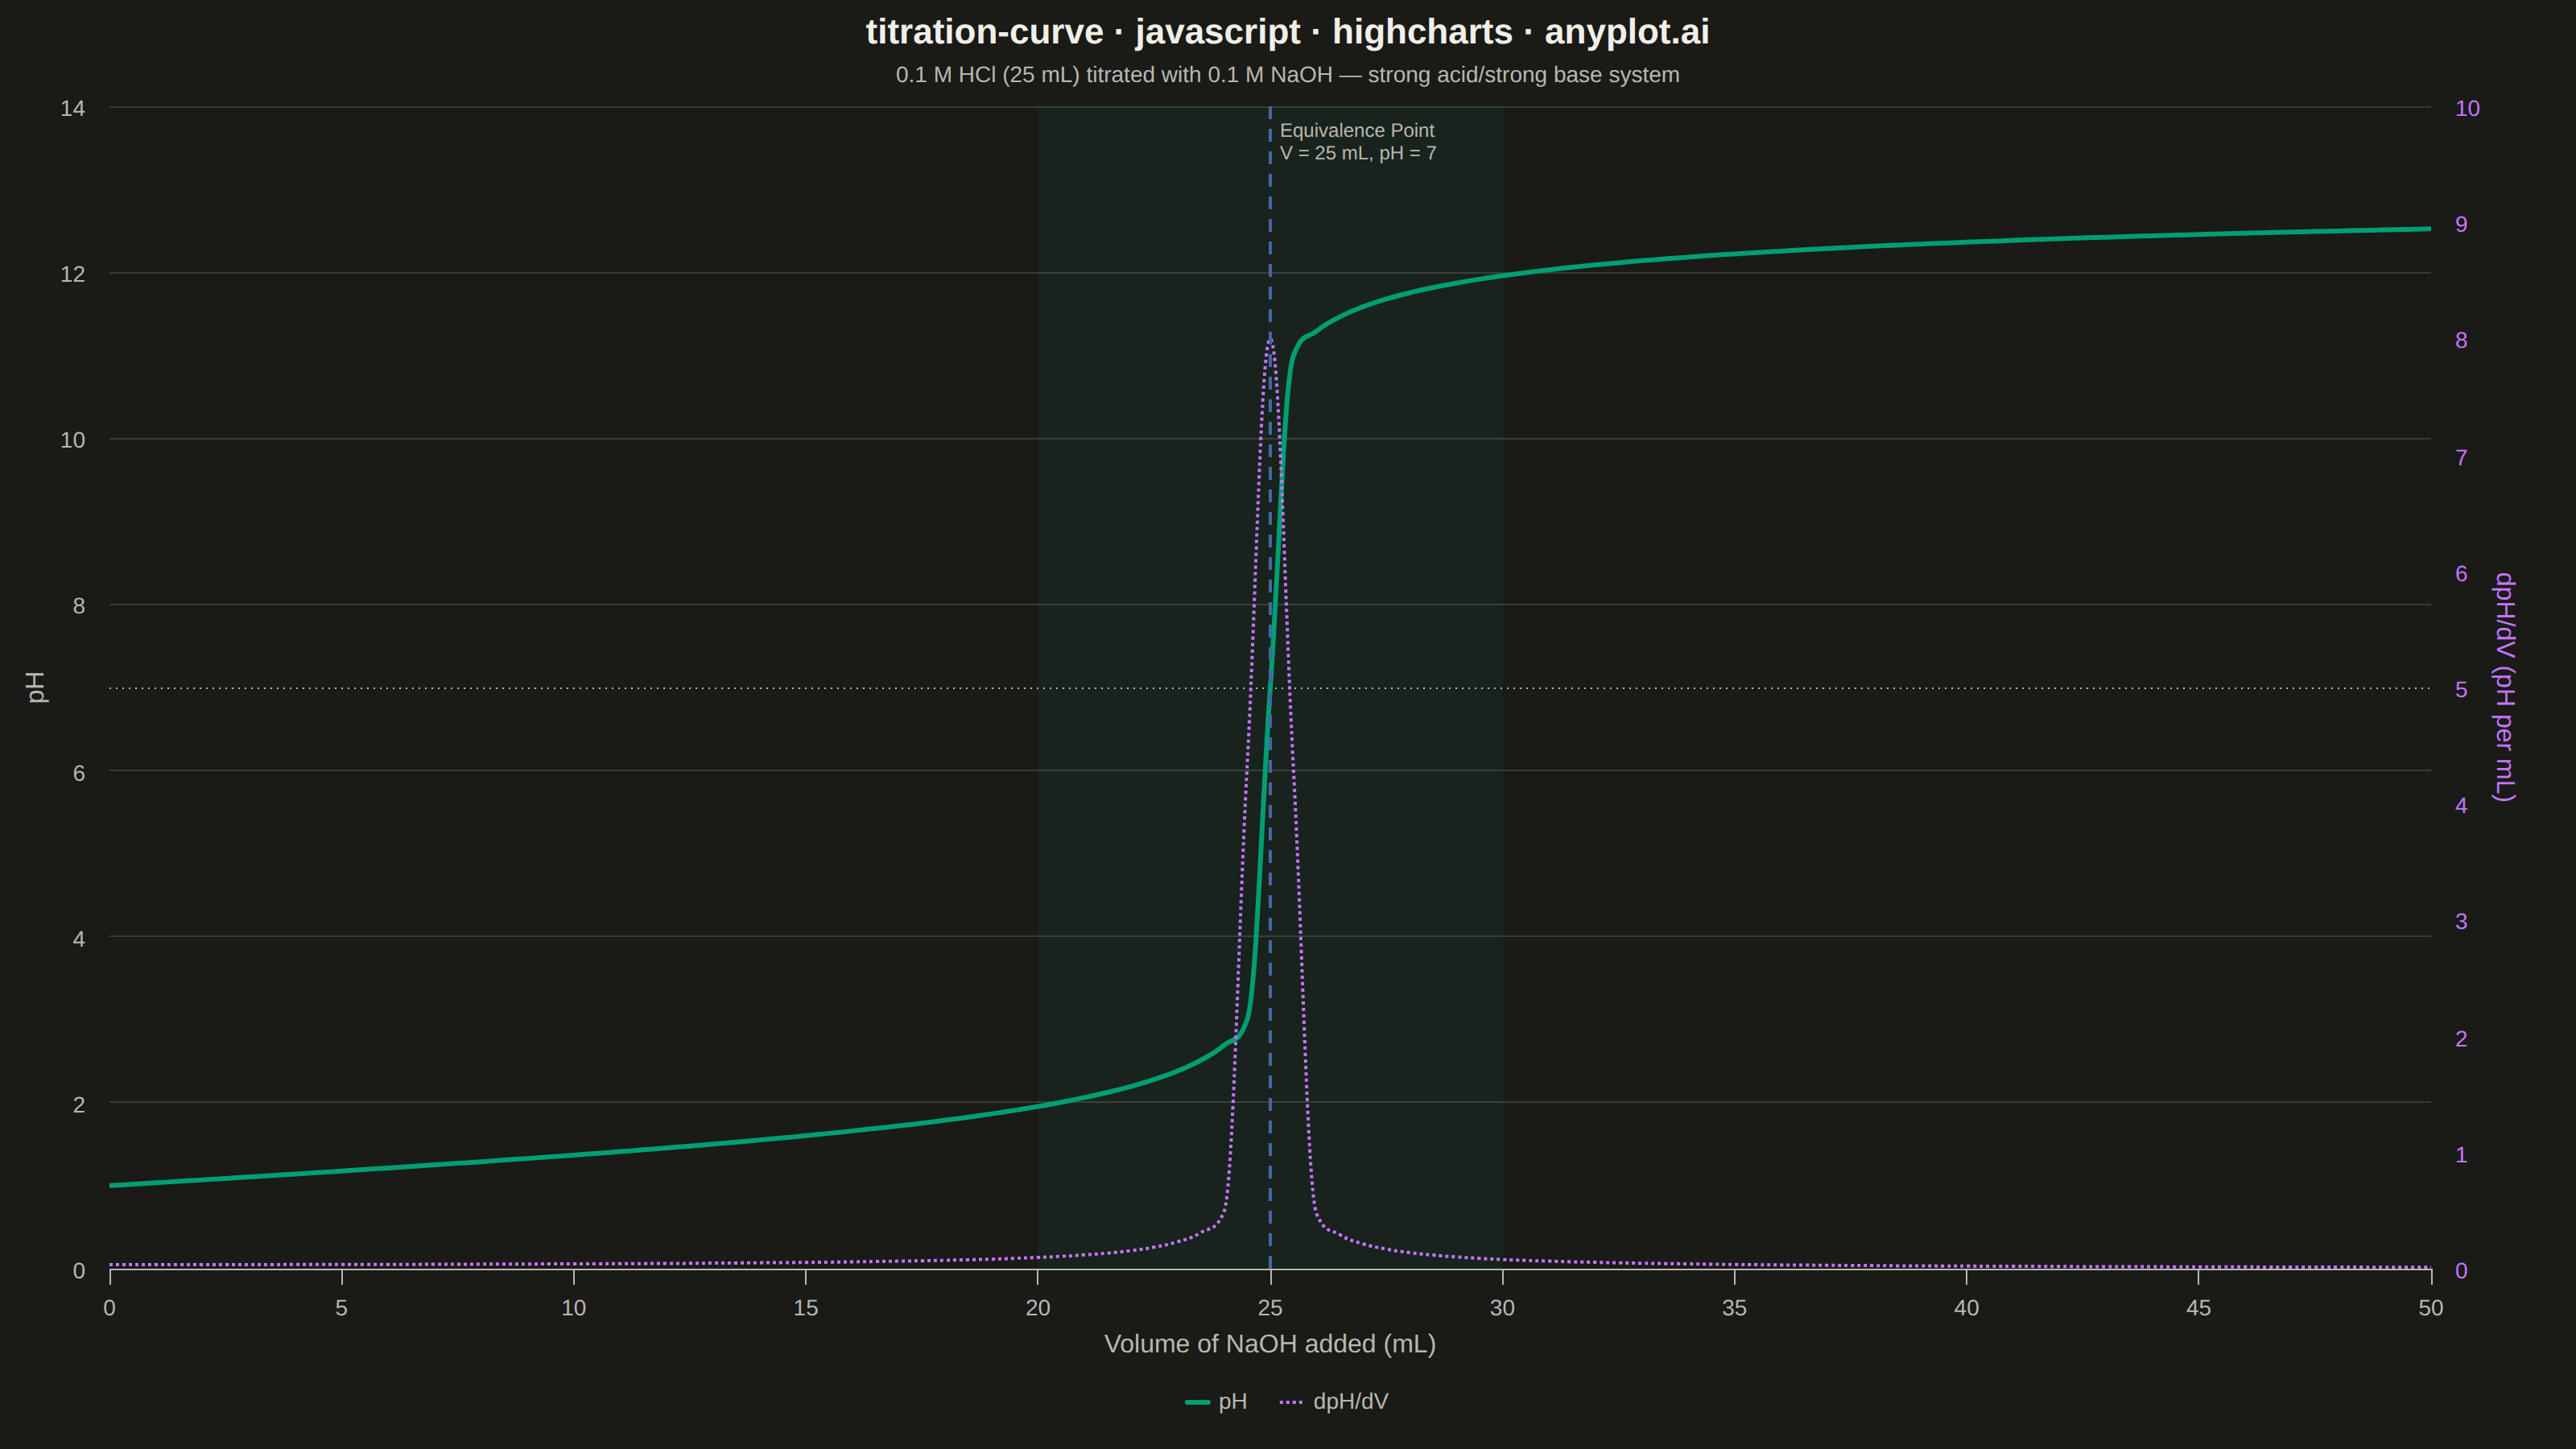
A titration curve plotting pH against volume of titrant added, producing the characteristic S-shaped (sigmoidal) curve used in analytical chemistry. The plot reveals buffer regions, equivalence points, and acid/base strength at a glance. Essential for chemistry education and laboratory analysis, it helps identify when a reaction reaches completion and which indicators are appropriate.
// anyplot.ai
// titration-curve: Acid-Base Titration Curve
// Library: highcharts 12.6.0 | JavaScript 22.23.0
// Quality: 92/100 | Created: 2026-06-24

//# anyplot-orientation: landscape

const t = window.ANYPLOT_TOKENS;

// Strong acid/strong base titration: 25 mL of 0.1 M HCl + 0.1 M NaOH
const C = 0.1;    // molar concentration of both solutions (mol/L)
const V0 = 25.0;  // initial volume of HCl (mL)
const STEP = 0.5; // volume increment (mL)
const N = 101;    // data points: 0 to 50 mL inclusive
const nAcid = (V0 * C) / 1000; // moles of HCl = 0.0025 mol

// Compute pH at each NaOH volume increment
const volumes = [];
const phs = [];

for (let i = 0; i < N; i++) {
    const V = i * STEP;
    const nBase = (V * C) / 1000;
    const totalVol = (V0 + V) / 1000; // total volume in L
    const excess = nBase - nAcid;

    let ph;
    if (Math.abs(excess) < 1e-9) {
        ph = 7.0; // equivalence point: neutral salt solution
    } else if (excess < 0) {
        ph = -Math.log10(-excess / totalVol); // excess HCl
    } else {
        ph = 14 + Math.log10(excess / totalVol); // excess NaOH
    }

    volumes.push(V);
    phs.push(Math.max(0, Math.min(14, ph)));
}

// Build series arrays including dpH/dV derivative via central differences
const phSeriesData = [];
const dphSeriesData = [];

for (let i = 0; i < N; i++) {
    phSeriesData.push([volumes[i], parseFloat(phs[i].toFixed(3))]);

    let d;
    if (i === 0) {
        d = (phs[1] - phs[0]) / STEP;
    } else if (i === N - 1) {
        d = (phs[N - 1] - phs[N - 2]) / STEP;
    } else {
        d = (phs[i + 1] - phs[i - 1]) / (2 * STEP);
    }
    dphSeriesData.push([volumes[i], parseFloat(Math.max(0, d).toFixed(3))]);
}

// Render
Highcharts.chart('container', {
    chart: {
        backgroundColor: 'transparent',
        animation: false,
        alignTicks: false,
        style: { fontFamily: 'inherit' },
        marginRight: 90,
    },
    credits: { enabled: false },
    colors: t.palette,

    title: {
        text: 'titration-curve · javascript · highcharts · anyplot.ai',
        style: { color: t.ink, fontSize: '22px', fontWeight: '600' },
    },
    subtitle: {
        text: '0.1 M HCl (25 mL) titrated with 0.1 M NaOH — strong acid/strong base system',
        style: { color: t.inkSoft, fontSize: '14px' },
    },

    xAxis: {
        title: {
            text: 'Volume of NaOH added (mL)',
            style: { color: t.inkSoft, fontSize: '16px' },
        },
        lineColor: t.inkSoft,
        tickColor: t.inkSoft,
        gridLineColor: t.grid,
        min: 0,
        max: 50,
        tickInterval: 5,
        labels: { style: { color: t.inkSoft, fontSize: '14px' } },
        plotLines: [{
            value: 25,
            color: t.palette[2],
            dashStyle: 'Dash',
            width: 2,
            zIndex: 5,
            label: {
                useHTML: true,
                text: 'Equivalence Point<br>V = 25 mL, pH = 7',
                style: { color: t.inkSoft, fontSize: '12px' },
                align: 'left',
                rotation: 0,
                x: 6,
                y: 20,
            },
        }],
        plotBands: [{
            from: 20,
            to: 30,
            color: 'rgba(0, 158, 115, 0.07)', // Imprint green, low opacity — steep transition zone
        }],
    },

    yAxis: [
        {
            title: { text: 'pH', style: { color: t.inkSoft, fontSize: '16px' } },
            min: 0,
            max: 14,
            tickInterval: 2,
            lineColor: t.inkSoft,
            tickColor: t.inkSoft,
            gridLineColor: t.grid,
            labels: { style: { color: t.inkSoft, fontSize: '14px' } },
            plotLines: [{
                value: 7,
                color: t.inkSoft,
                dashStyle: 'Dot',
                width: 1,
                zIndex: 2,
            }],
        },
        {
            title: {
                text: 'dpH/dV (pH per mL)',
                style: { color: t.palette[1], fontSize: '16px' },
            },
            min: 0,
            max: 10,
            opposite: true,
            gridLineColor: 'transparent',
            lineColor: t.palette[1],
            tickColor: t.palette[1],
            labels: { style: { color: t.palette[1], fontSize: '14px' } },
        },
    ],

    legend: {
        itemStyle: { color: t.inkSoft, fontSize: '14px' },
        itemHoverStyle: { color: t.ink },
    },

    plotOptions: {
        series: { animation: false },
    },

    series: [
        {
            name: 'pH',
            type: 'spline',
            data: phSeriesData,
            color: t.palette[0], // Imprint brand green — first series
            yAxis: 0,
            lineWidth: 3,
            marker: { enabled: false },
        },
        {
            name: 'dpH/dV',
            type: 'spline',
            data: dphSeriesData,
            color: t.palette[1], // Imprint lavender — second series
            yAxis: 1,
            lineWidth: 2,
            dashStyle: 'ShortDot',
            marker: { enabled: false },
        },
    ],
});
Runnable source as JSON, for any HTTP client: https://api.anyplot.ai/specs/titration-curve/highcharts/code. Any spec id and library id listed in llms-full.txt fit the same URL shape; every URL below is complete and callable.
{
  "spec_id": "titration-curve",
  "language": "javascript",
  "library": "highcharts",
  "page": "https://anyplot.ai/titration-curve/javascript/highcharts",
  "hub": "https://anyplot.ai/titration-curve",
  "code_json": "https://api.anyplot.ai/specs/titration-curve/highcharts/code",
  "spec_json": "https://api.anyplot.ai/specs/titration-curve",
  "render_light_png": "https://storage.googleapis.com/anyplot-images/plots/titration-curve/javascript/highcharts/plot-light.png",
  "render_dark_png": "https://storage.googleapis.com/anyplot-images/plots/titration-curve/javascript/highcharts/plot-dark.png",
  "interactive_light_html": "https://storage.googleapis.com/anyplot-images/plots/titration-curve/javascript/highcharts/plot-light.html",
  "interactive_dark_html": "https://storage.googleapis.com/anyplot-images/plots/titration-curve/javascript/highcharts/plot-dark.html",
  "quality_score": 92.0,
  "license": "MIT",
  "guide": "https://anyplot.ai/llms.txt"
}
Part of Acid-Base Titration Curve on anyplot.ai.