The same plot in 14 other libraries — Python: Altair, Bokeh, lets-plot, Matplotlib, Plotly, plotnine, Pygal, Seaborn; R: ggplot2; JavaScript: Chart.js, D3.js, Apache ECharts, Highcharts, MUI X Charts. Compare all 15 side by side: Acid-Base Titration Curve in Python, R, Julia and JavaScript.
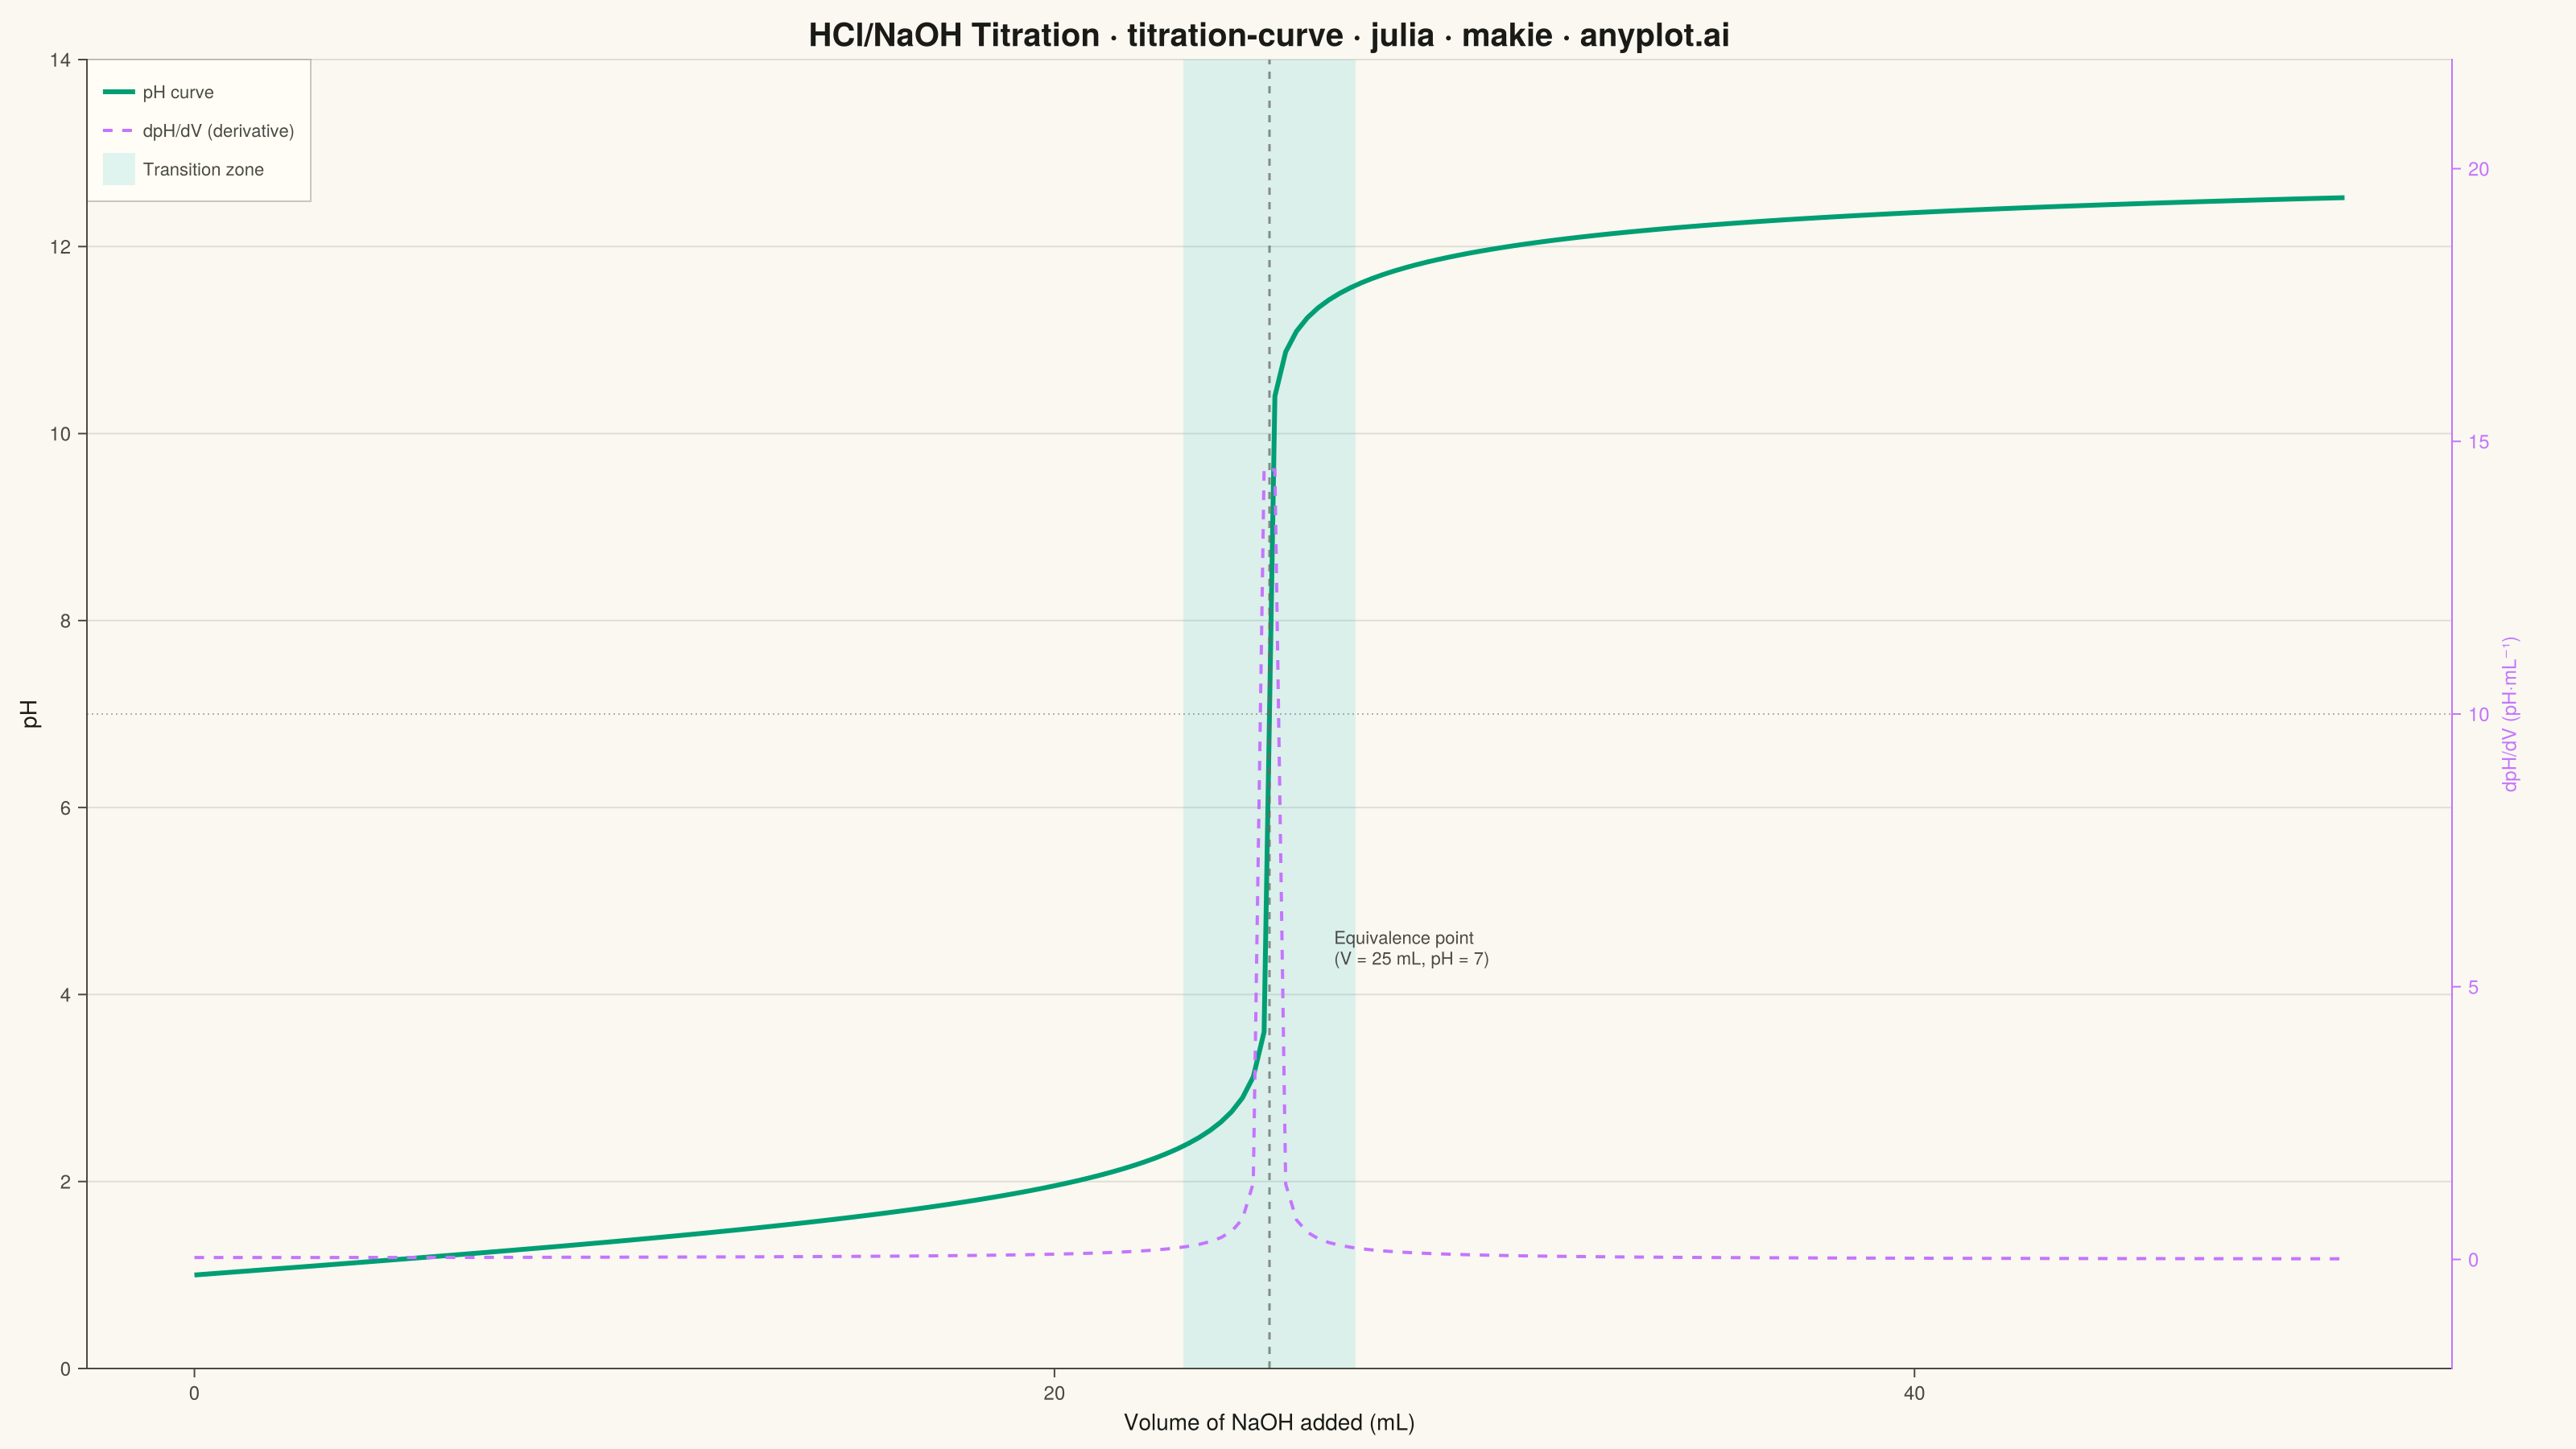
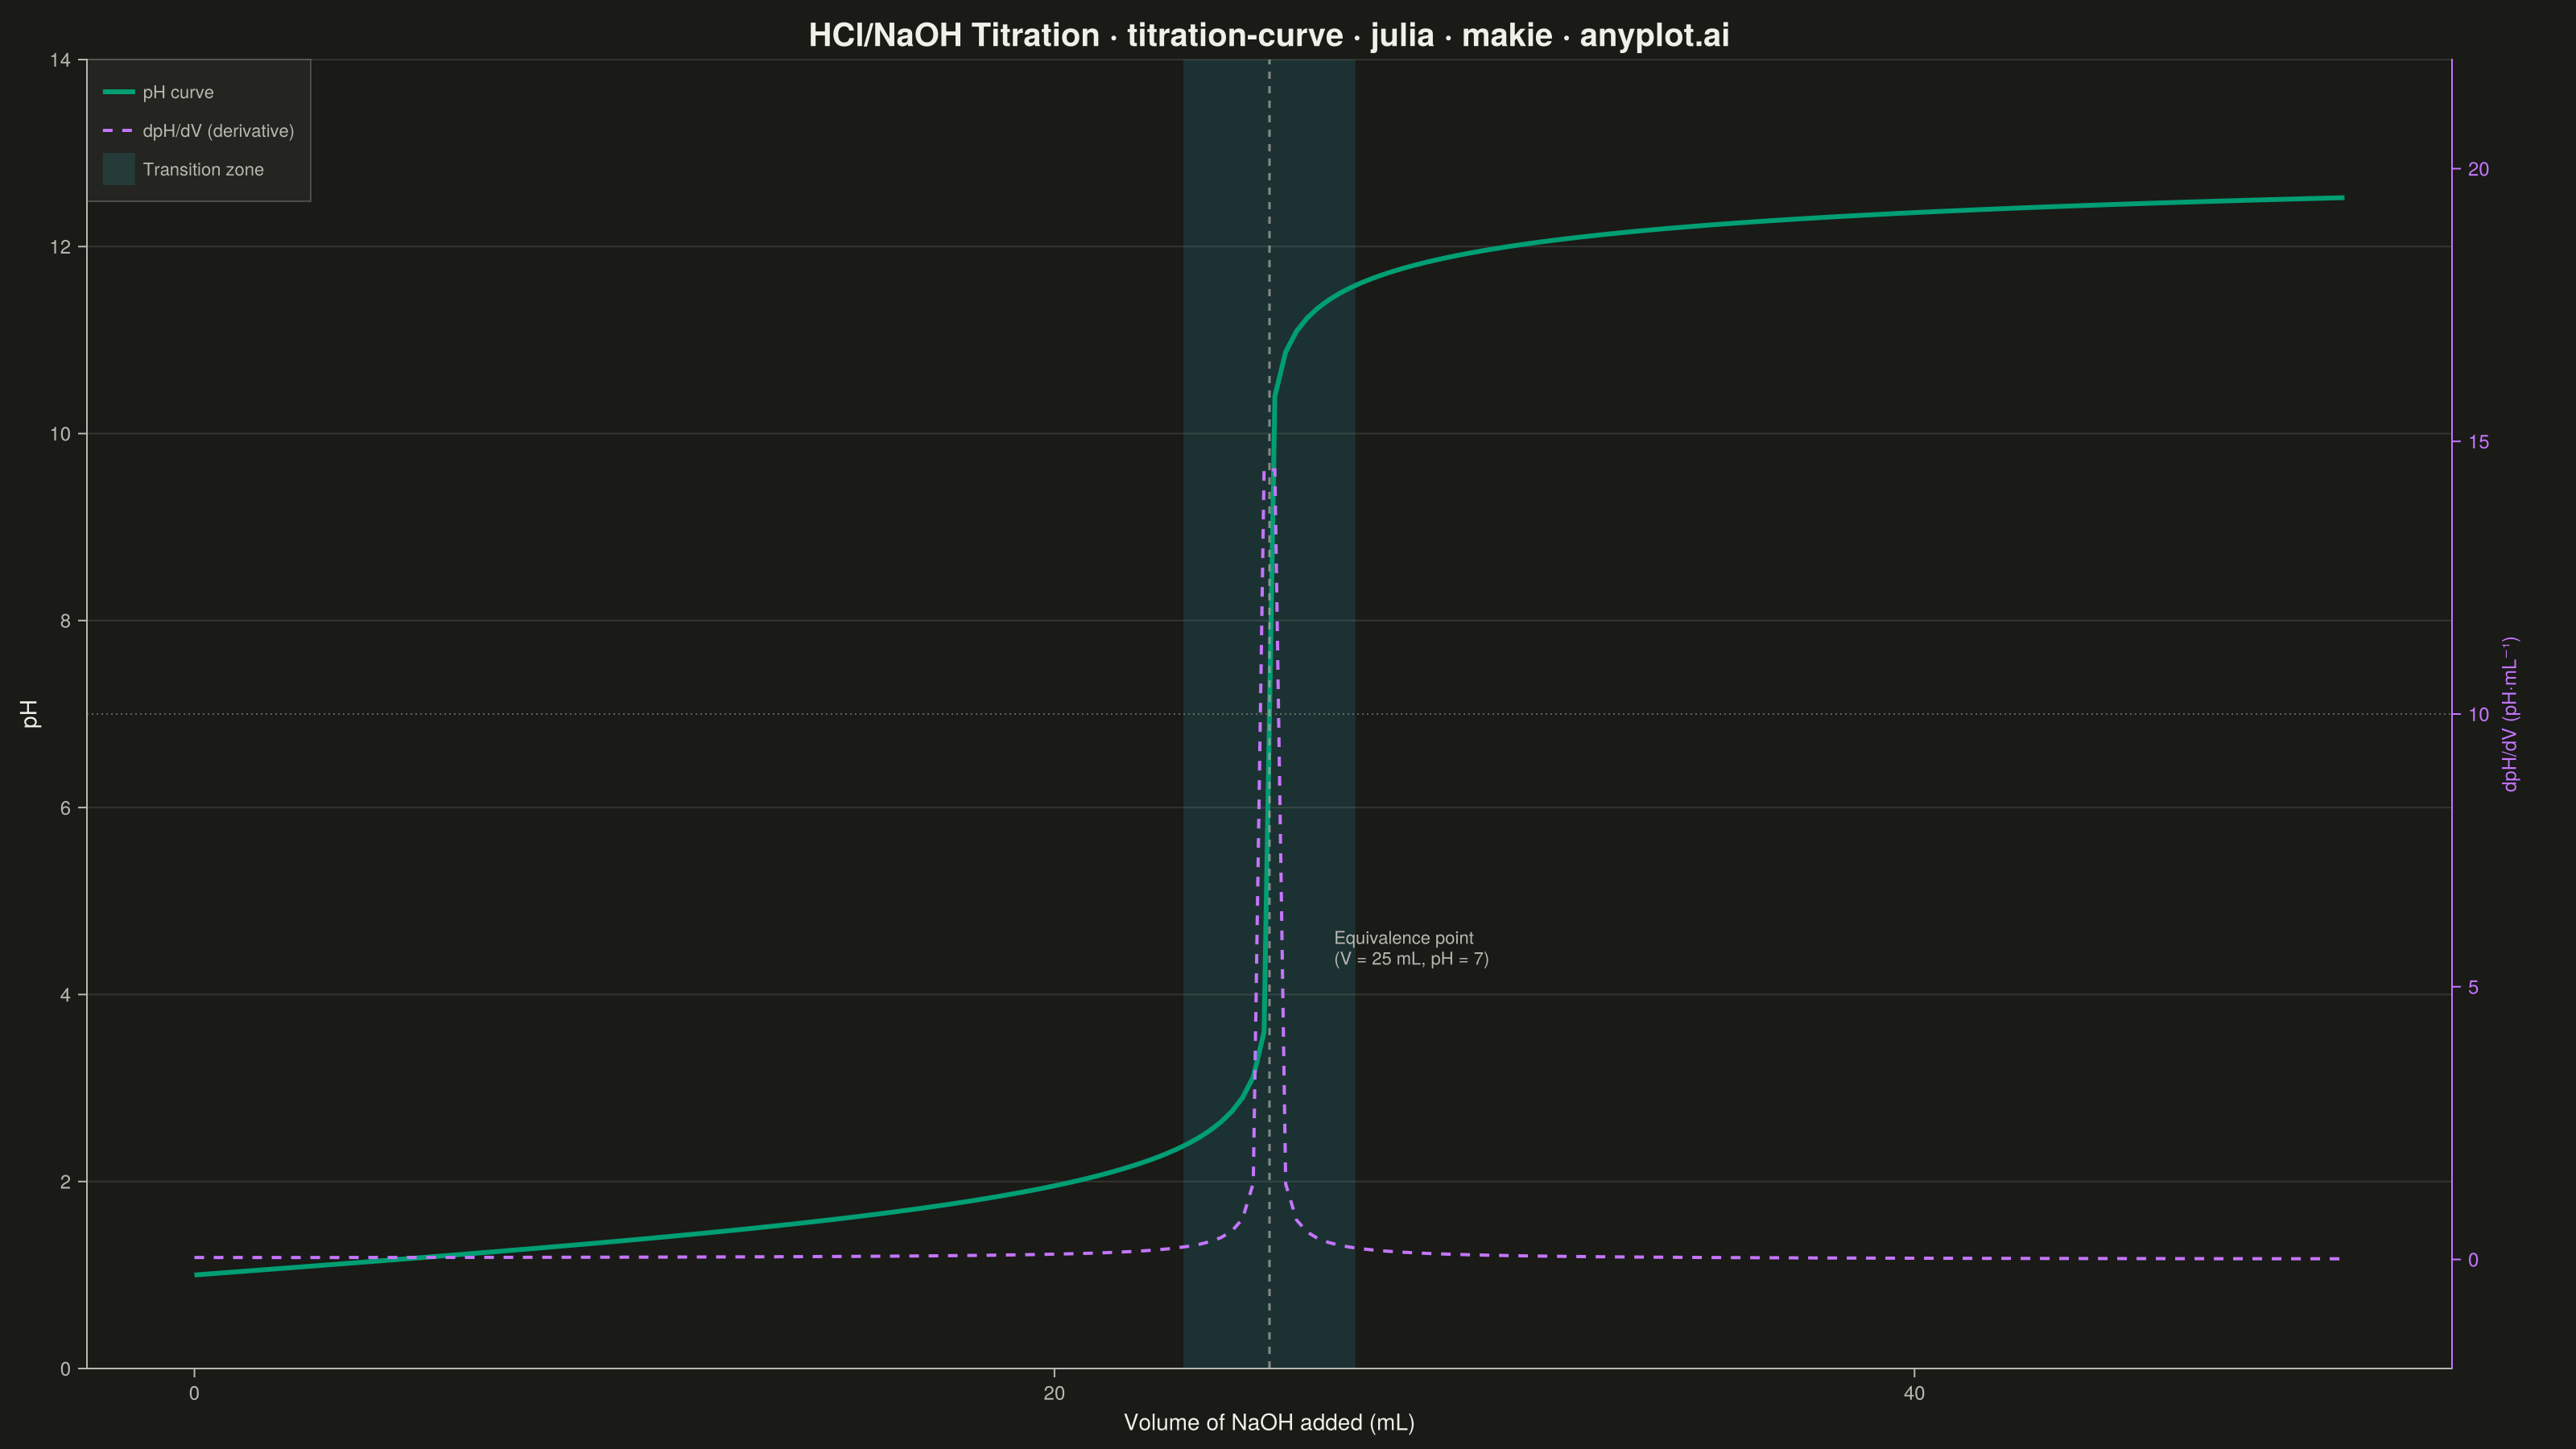
A titration curve plotting pH against volume of titrant added, producing the characteristic S-shaped (sigmoidal) curve used in analytical chemistry. The plot reveals buffer regions, equivalence points, and acid/base strength at a glance. Essential for chemistry education and laboratory analysis, it helps identify when a reaction reaches completion and which indicators are appropriate.
# anyplot.ai
# titration-curve: Acid-Base Titration Curve
# Library: makie 0.22.10 | Julia 1.11.9
# Quality: 91/100 | Created: 2026-06-24

using CairoMakie
using Colors
using Random

Random.seed!(42)

const THEME       = get(ENV, "ANYPLOT_THEME", "light")
const PAGE_BG     = THEME == "light" ? colorant"#FAF8F1" : colorant"#1A1A17"
const ELEVATED_BG = THEME == "light" ? colorant"#FFFDF6" : colorant"#242420"
const INK         = THEME == "light" ? colorant"#1A1A17" : colorant"#F0EFE8"
const INK_SOFT    = THEME == "light" ? colorant"#4A4A44" : colorant"#B8B7B0"
const INK_MUTED   = THEME == "light" ? colorant"#6B6A63" : colorant"#A8A79F"
const IMPRINT_PALETTE = [
    colorant"#009E73",
    colorant"#C475FD",
    colorant"#4467A3",
    colorant"#BD8233",
    colorant"#AE3030",
    colorant"#2ABCCD",
    colorant"#954477",
    colorant"#99B314",
]

# Data: 25 mL of 0.1 M HCl titrated with 0.1 M NaOH
const V_EQ  = 25.0
const C     = 0.1
const V_HCL = 25.0

n_points = 200
volumes  = collect(range(0.0, 50.0; length = n_points))

ph = clamp.([
    v < V_EQ - 1e-4 ? -log10((V_EQ - v) * C * 1e-3 / ((V_HCL + v) * 1e-3)) :
    v > V_EQ + 1e-4 ? 14.0 + log10((v - V_EQ) * C * 1e-3 / ((V_HCL + v) * 1e-3)) :
    7.0
    for v in volumes
], 0.0, 14.0)

dph_dv = zeros(n_points)
for i in 2:(n_points - 1)
    dph_dv[i] = (ph[i + 1] - ph[i - 1]) / (volumes[i + 1] - volumes[i - 1])
end
dph_dv[1]   = dph_dv[2]
dph_dv[end] = dph_dv[end - 1]

# Title with length-aware fontsize
title_str = "HCl/NaOH Titration · titration-curve · julia · makie · anyplot.ai"
titlesize = max(16, round(Int, 20.0 * min(1.0, 67.0 / length(title_str))))

# Figure — extra right padding gives the secondary y-axis label room
fig = Figure(
    size            = (1600, 900),
    fontsize        = 14,
    backgroundcolor = PAGE_BG,
    figure_padding  = (10, 35, 10, 10),
)

# Primary axis (pH)
ax = Axis(
    fig[1, 1];
    title              = title_str,
    titlesize          = titlesize,
    titlecolor         = INK,
    xlabel             = "Volume of NaOH added (mL)",
    ylabel             = "pH",
    xlabelsize         = 14,
    ylabelsize         = 14,
    xticklabelsize     = 12,
    yticklabelsize     = 12,
    xlabelcolor        = INK,
    ylabelcolor        = INK,
    xticklabelcolor    = INK_SOFT,
    yticklabelcolor    = INK_SOFT,
    xtickcolor         = INK_SOFT,
    ytickcolor         = INK_SOFT,
    backgroundcolor    = PAGE_BG,
    topspinevisible    = false,
    rightspinevisible  = false,
    leftspinecolor     = INK_SOFT,
    bottomspinecolor   = INK_SOFT,
    xgridvisible       = false,
    ygridvisible       = true,
    ygridcolor         = RGBAf(INK.r, INK.g, INK.b, 0.12f0),
    xminorgridvisible  = false,
    yminorgridvisible  = false,
)

# Secondary axis (dpH/dV derivative, right side)
ax2 = Axis(
    fig[1, 1];
    yaxisposition      = :right,
    ylabel             = "dpH/dV (pH·mL⁻¹)",
    ylabelsize         = 12,
    ylabelcolor        = IMPRINT_PALETTE[2],
    yticklabelsize     = 12,
    yticklabelcolor    = IMPRINT_PALETTE[2],
    ytickcolor         = IMPRINT_PALETTE[2],
    rightspinecolor    = IMPRINT_PALETTE[2],
    backgroundcolor    = :transparent,
    topspinevisible    = false,
    leftspinevisible   = false,
    bottomspinevisible = false,
    xticklabelsvisible = false,
    xticksvisible      = false,
    xgridvisible       = false,
    ygridvisible       = false,
    xminorgridvisible  = false,
    yminorgridvisible  = false,
)

linkxaxes!(ax, ax2)
xlims!(ax, 0, 50)
ylims!(ax, 0, 14)
ylims!(ax2, -2, 22)

# Rapid transition zone highlight (±2 mL around equivalence point)
poly!(
    ax,
    [Point2f(23, 0), Point2f(27, 0), Point2f(27, 14), Point2f(23, 14)];
    color       = (IMPRINT_PALETTE[6], 0.15),
    strokewidth = 0,
)

# pH=7 reference line — marks neutral point at strong acid/base equivalence
hlines!(ax, [7.0];
    color     = (INK_MUTED, 0.5),
    linewidth = 1.0,
    linestyle = :dot,
)

# pH titration curve
ph_line = lines!(ax, volumes, ph;
    color     = IMPRINT_PALETTE[1],
    linewidth = 3.0,
)

# Equivalence point vertical dashed line
vlines!(ax, [V_EQ];
    color     = (INK_MUTED, 0.75),
    linewidth = 1.5,
    linestyle = :dash,
)

# Equivalence point annotation
text!(ax, "Equivalence point\n(V = 25 mL, pH = 7)";
    position = Point2f(V_EQ + 1.5, 4.5),
    fontsize  = 11,
    color     = INK_SOFT,
    align     = (:left, :center),
)

# Derivative curve on secondary axis
deriv_line = lines!(ax2, volumes, dph_dv;
    color     = IMPRINT_PALETTE[2],
    linewidth = 2.0,
    linestyle = :dash,
)

# Legend
poly_elem = PolyElement(color = (IMPRINT_PALETTE[6], 0.15), strokewidth = 0)

Legend(
    fig[1, 1],
    [ph_line, deriv_line, poly_elem],
    ["pH curve", "dpH/dV (derivative)", "Transition zone"];
    tellheight      = false,
    tellwidth       = false,
    halign          = :left,
    valign          = :top,
    framecolor      = (INK_SOFT, 0.3),
    backgroundcolor = ELEVATED_BG,
    labelcolor      = INK_SOFT,
    labelsize       = 11,
    padding         = (10, 10, 10, 10),
    rowgap          = 4,
)

# Save
save("plot-$(THEME).png", fig; px_per_unit = 2)
Runnable source as JSON, for any HTTP client: https://api.anyplot.ai/specs/titration-curve/makie/code. Any spec id and library id listed in llms-full.txt fit the same URL shape; every URL below is complete and callable.
{
  "spec_id": "titration-curve",
  "language": "julia",
  "library": "makie",
  "page": "https://anyplot.ai/titration-curve/julia/makie",
  "hub": "https://anyplot.ai/titration-curve",
  "code_json": "https://api.anyplot.ai/specs/titration-curve/makie/code",
  "spec_json": "https://api.anyplot.ai/specs/titration-curve",
  "render_light_png": "https://storage.googleapis.com/anyplot-images/plots/titration-curve/julia/makie/plot-light.png",
  "render_dark_png": "https://storage.googleapis.com/anyplot-images/plots/titration-curve/julia/makie/plot-dark.png",
  "quality_score": 91.0,
  "license": "MIT",
  "guide": "https://anyplot.ai/llms.txt"
}
Part of Acid-Base Titration Curve on anyplot.ai.