The same plot in 14 other libraries — JavaScript: Chart.js, D3.js, Apache ECharts, Highcharts; Python: Altair, Bokeh, lets-plot, Matplotlib, Plotly, plotnine, Pygal, Seaborn; R: ggplot2; Julia: Makie.jl. Compare all 15 side by side: Acid-Base Titration Curve in Python, R, Julia and JavaScript.
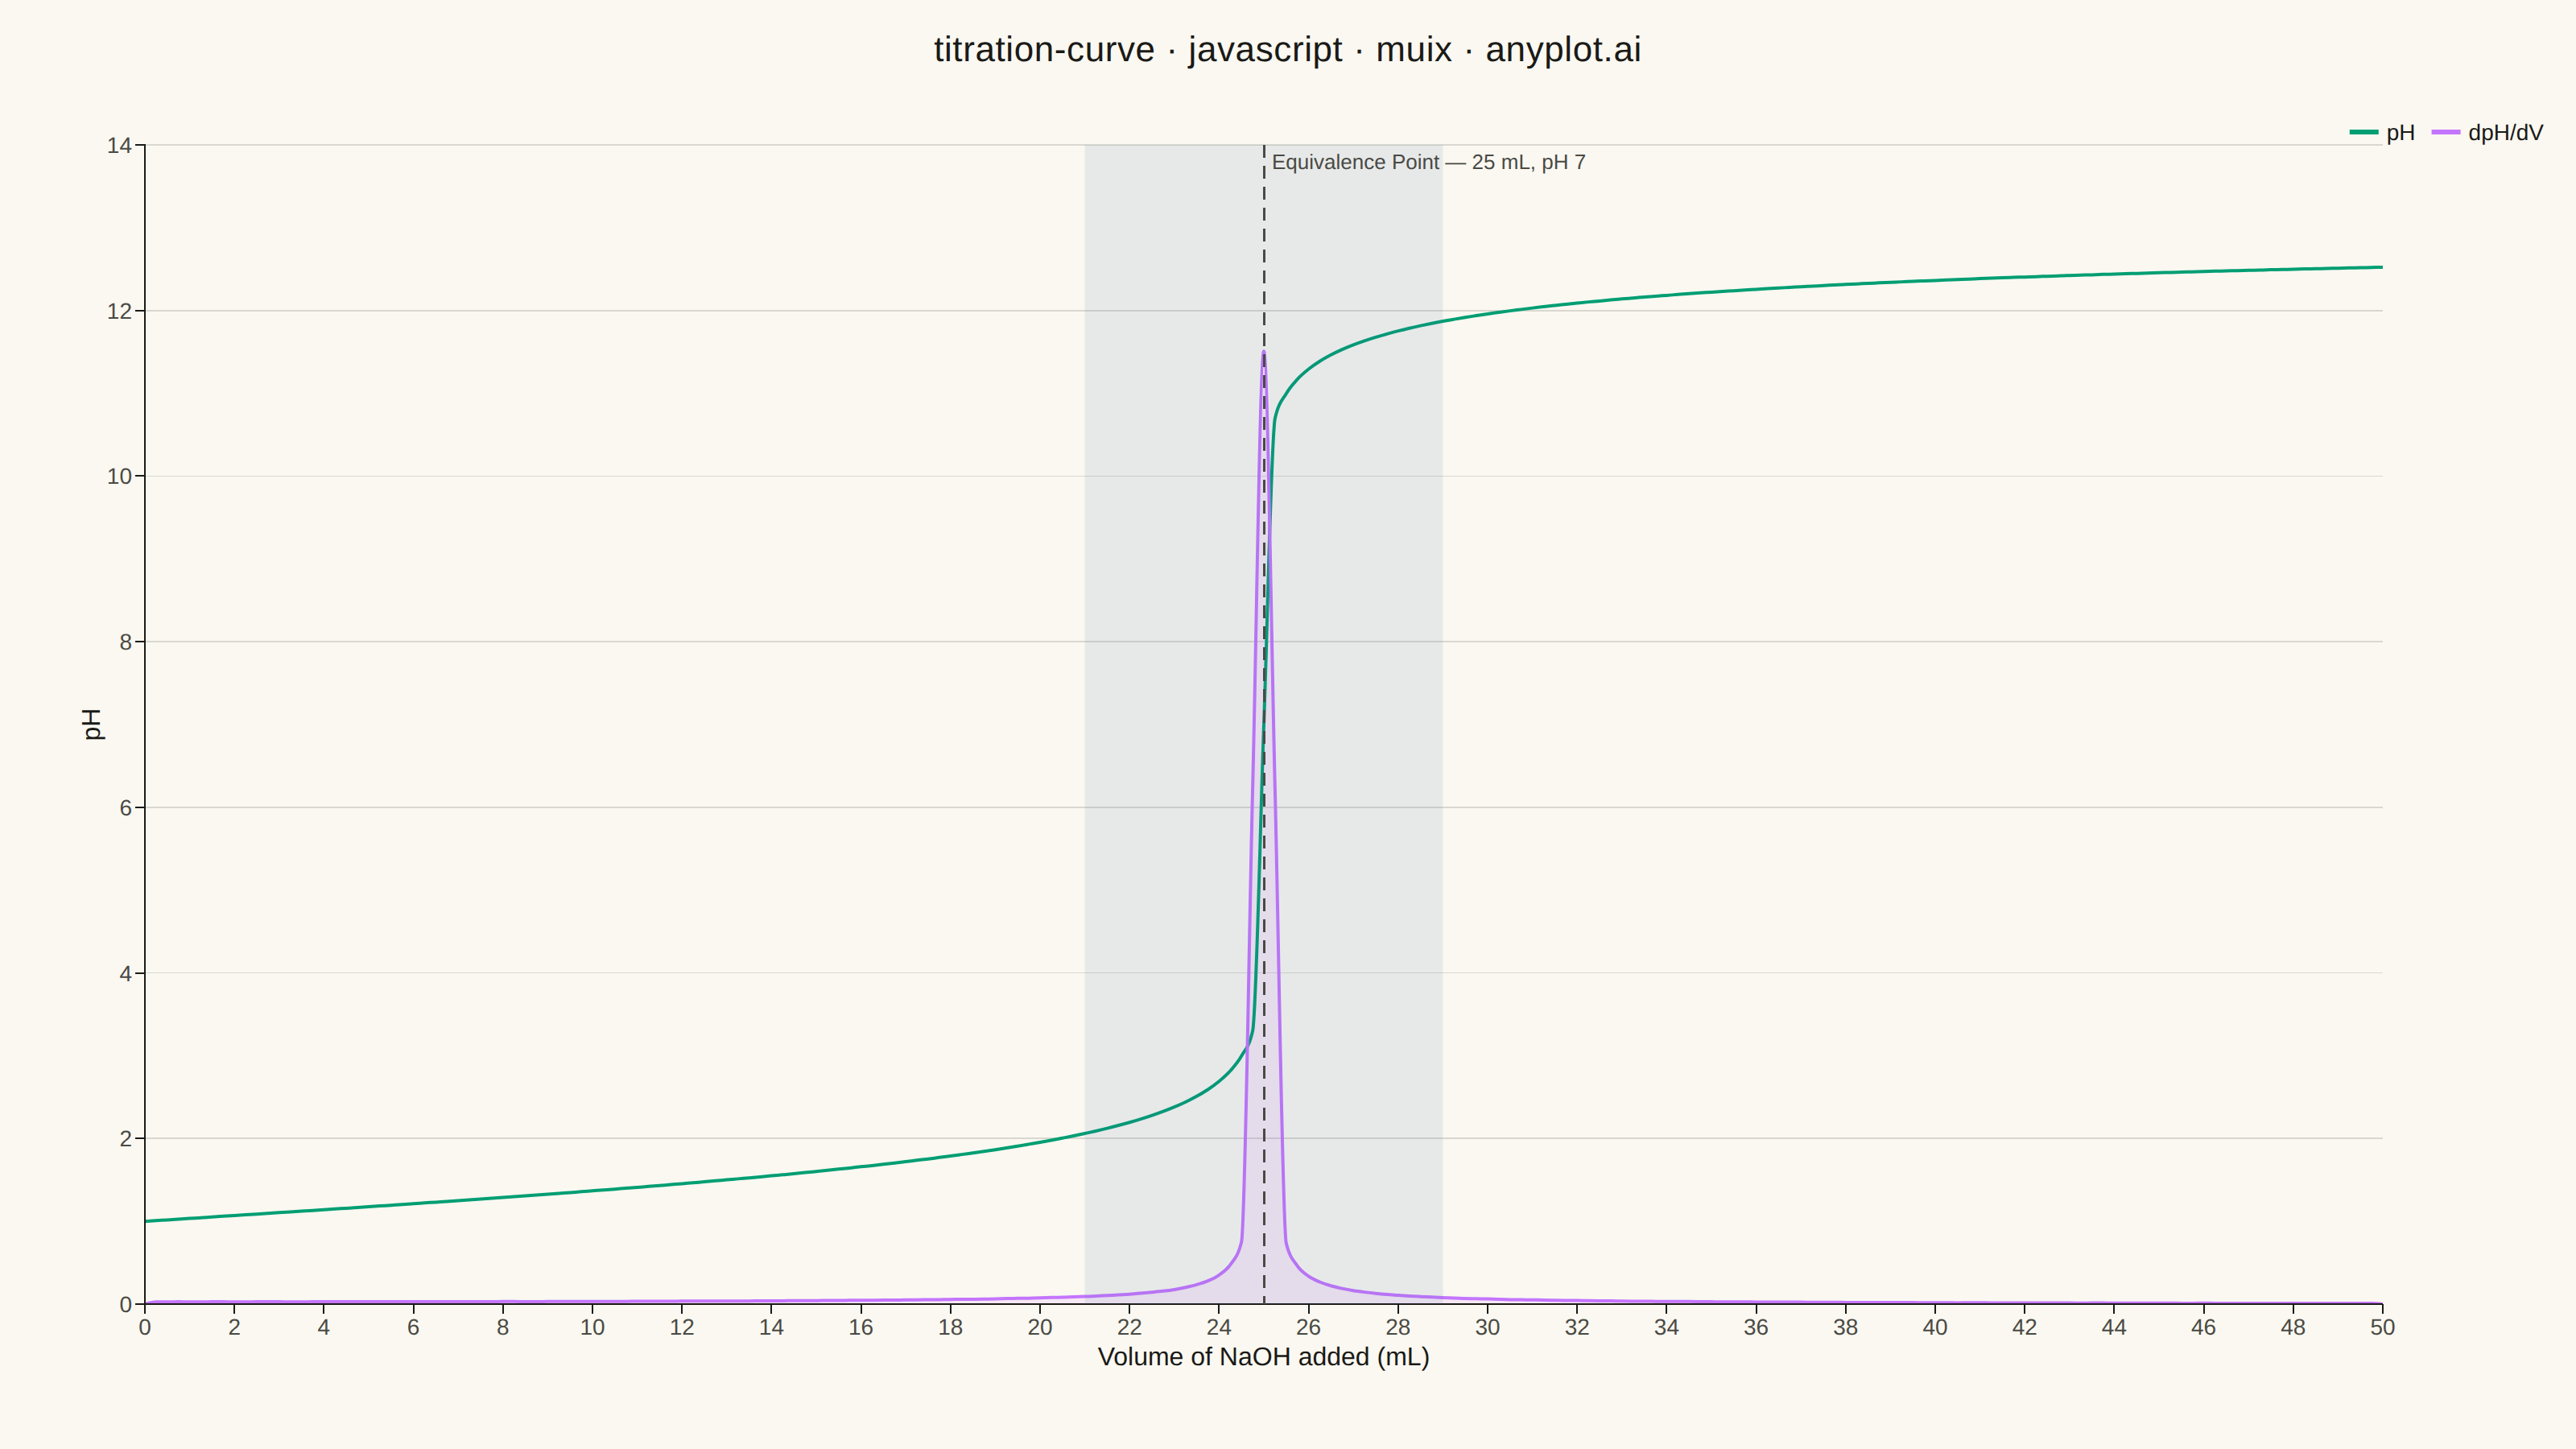
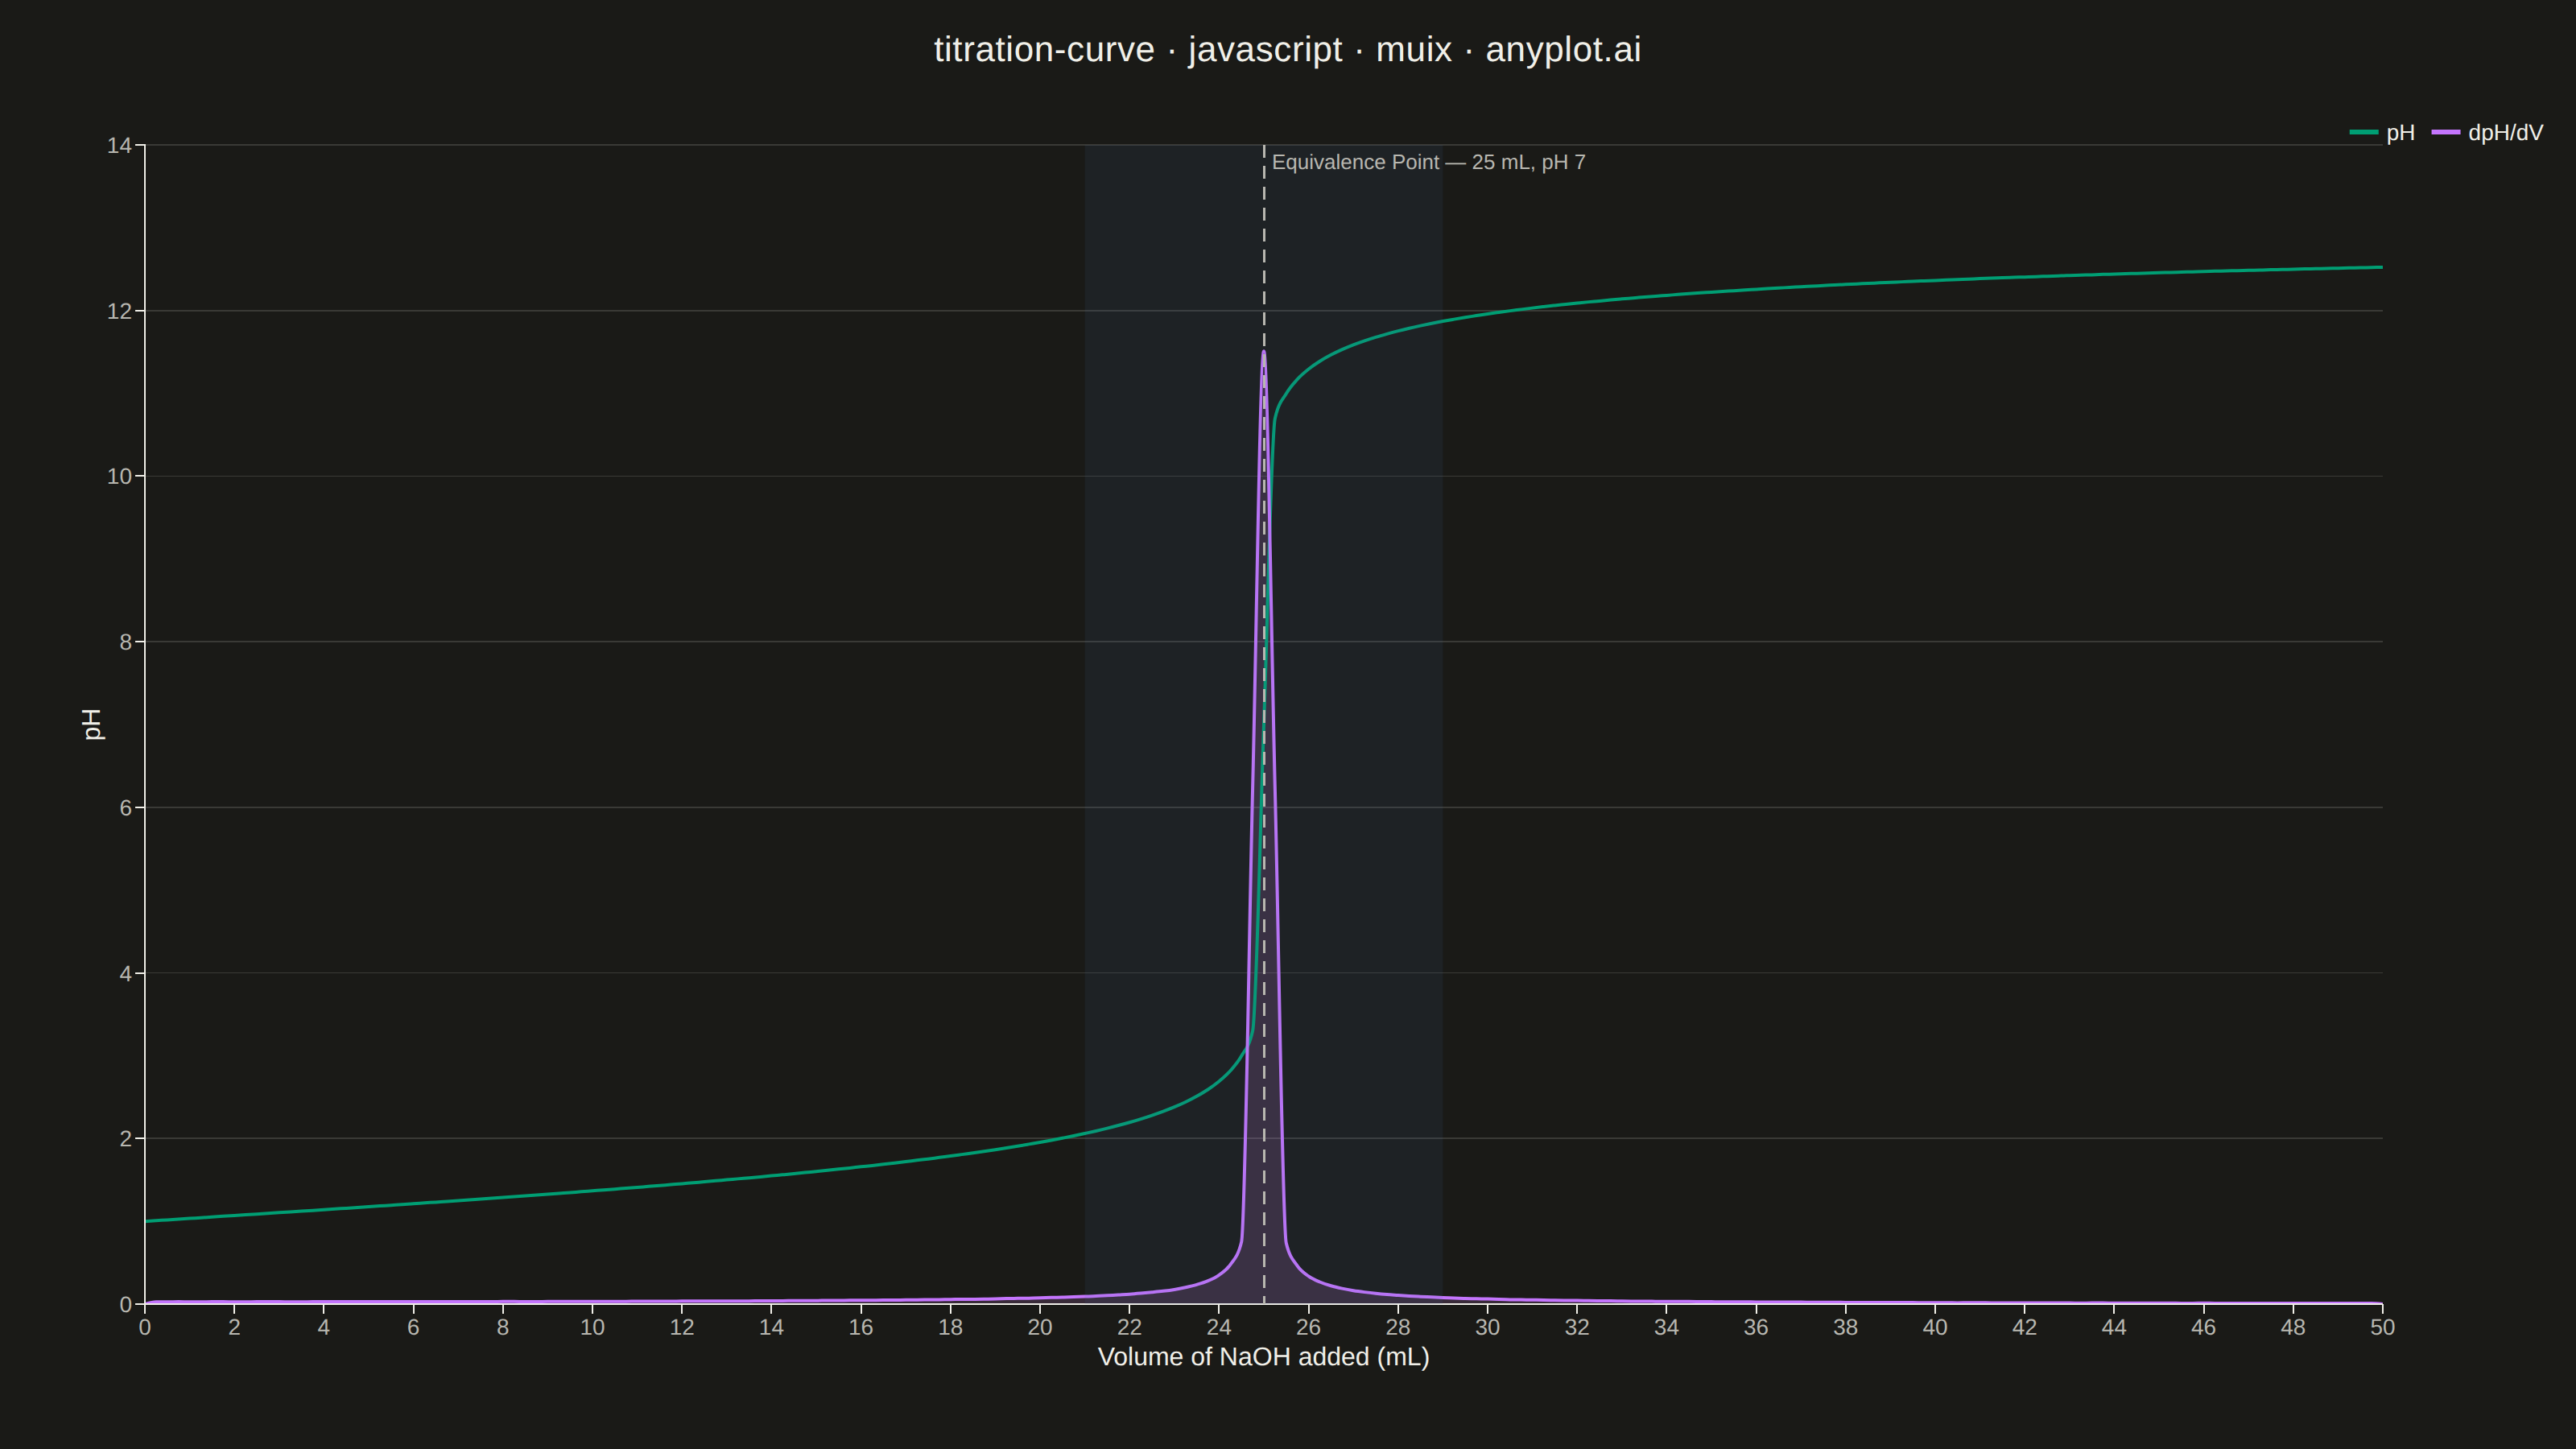
A titration curve plotting pH against volume of titrant added, producing the characteristic S-shaped (sigmoidal) curve used in analytical chemistry. The plot reveals buffer regions, equivalence points, and acid/base strength at a glance. Essential for chemistry education and laboratory analysis, it helps identify when a reaction reaches completion and which indicators are appropriate.
// anyplot.ai
// titration-curve: Acid-Base Titration Curve
// Library: muix 7.29.1 | JavaScript 22.22.3
// Quality: 84/100 | Created: 2026-06-24

import { LineChart } from "@mui/x-charts/LineChart";
import { ChartsReferenceLine } from "@mui/x-charts/ChartsReferenceLine";
import { useDrawingArea, useXScale } from "@mui/x-charts/hooks";
import Box from "@mui/material/Box";
import Typography from "@mui/material/Typography";

const t = window.ANYPLOT_TOKENS;

// --- Data: 25 mL of 0.1 M HCl titrated with 0.1 M NaOH -----------------
const N = 201;
const VOL_MAX = 50;
const EQ_VOL = 25;
// Transition zone: ±4 mL around equivalence — the steep-jump buffer region
const BUFFER_LO = EQ_VOL - 4;
const BUFFER_HI = EQ_VOL + 4;

function phAt(V) {
  if (Math.abs(V - EQ_VOL) < 1e-4) return 7.0;
  if (V < EQ_VOL) {
    const excessH = 0.0025 - V * 1e-4;
    return Math.max(0, -Math.log10(excessH / ((25 + V) / 1000)));
  }
  const excessOH = (V - EQ_VOL) * 1e-4;
  const pOH = -Math.log10(excessOH / ((25 + V) / 1000));
  return Math.min(14, 14 - pOH);
}

// 201 evenly-spaced volume points (0–50 mL); index 100 = 25.00 mL exactly
const volumes = Array.from({ length: N }, (_, i) =>
  parseFloat(((i / (N - 1)) * VOL_MAX).toFixed(2))
);
const phData = volumes.map((v) => parseFloat(phAt(v).toFixed(3)));

// Central-difference derivative dpH/dV — spikes sharply at the equivalence point
const derivData = volumes.map((_, i) => {
  if (i === 0 || i === N - 1) return 0;
  const dv = volumes[i + 1] - volumes[i - 1];
  const dph = phData[i + 1] - phData[i - 1];
  return parseFloat((dph / dv).toFixed(3));
});

const maxDeriv = Math.max(...derivData); // ≈ 14.8 at equivalence

// --- Buffer zone shading component (uses chart context hooks) -------------
function BufferZone() {
  const { top, height } = useDrawingArea();
  const xScale = useXScale("vol");
  if (!xScale) return null;
  const x1 = xScale(BUFFER_LO);
  const x2 = xScale(BUFFER_HI);
  return (
    <rect
      x={x1}
      y={top}
      width={x2 - x1}
      height={height}
      fill={t.palette[2]}
      fillOpacity={0.1}
    />
  );
}

// --- Chart ---------------------------------------------------------------
export default function Chart() {
  const W = window.ANYPLOT_SIZE.width;
  const H = window.ANYPLOT_SIZE.height;
  const TITLE_H = 60;

  return (
    <Box
      sx={{
        width: W,
        height: H,
        bgcolor: t.pageBg,
        display: "flex",
        flexDirection: "column",
        alignItems: "center",
      }}
    >
      {/* Chart title */}
      <Box sx={{ height: TITLE_H, display: "flex", alignItems: "center" }}>
        <Typography
          sx={{
            fontSize: 22,
            fontWeight: 500,
            color: t.ink,
            letterSpacing: 0.3,
          }}
        >
          titration-curve · javascript · muix · anyplot.ai
        </Typography>
      </Box>

      <LineChart
        width={W}
        height={H - TITLE_H}
        skipAnimation
        colors={[t.palette[0], t.palette[1]]}
        grid={{ horizontal: true }}
        xAxis={[
          {
            id: "vol",
            data: volumes,
            scaleType: "linear",
            label: "Volume of NaOH added (mL)",
            min: 0,
            max: VOL_MAX,
            tickLabelStyle: { fontSize: 14, fill: t.inkSoft },
            labelStyle: { fontSize: 16, fill: t.ink },
          },
        ]}
        yAxis={[
          {
            id: "ph",
            min: 0,
            max: 14,
            label: "pH",
            tickNumber: 8,
            tickLabelStyle: { fontSize: 14, fill: t.inkSoft },
            labelStyle: { fontSize: 16, fill: t.ink },
          },
          {
            id: "deriv",
            position: "right",
            min: 0,
            max: Math.ceil(maxDeriv * 1.2),
            label: "dpH/dV (mL⁻¹)",
            tickLabelStyle: { fontSize: 14, fill: t.inkSoft },
            labelStyle: { fontSize: 16, fill: t.ink },
          },
        ]}
        series={[
          {
            data: phData,
            label: "pH",
            yAxisId: "ph",
            showMark: false,
            curve: "monotoneX",
            strokeWidth: 3,
          },
          {
            data: derivData,
            label: "dpH/dV",
            yAxisId: "deriv",
            showMark: false,
            curve: "monotoneX",
            strokeWidth: 2.5,
            area: true,
          },
        ]}
        margin={{ top: 30, bottom: 90, left: 90, right: 120 }}
        sx={{
          // Explicit grid line color and opacity (not relying solely on ThemeProvider)
          "& .MuiChartsGrid-line": {
            stroke: t.grid,
            strokeWidth: 0.8,
          },
          // Explicit axis line and tick styling
          "& .MuiChartsAxis-line": {
            stroke: t.inkSoft,
            strokeWidth: 0.5,
          },
          "& .MuiChartsAxis-tick": {
            stroke: t.inkSoft,
          },
          // Subtle area fill under the dpH/dV spike
          "& .MuiAreaElement-root": {
            fillOpacity: 0.15,
          },
        }}
        slotProps={{
          legend: {
            position: { vertical: "top", horizontal: "right" },
            itemMarkWidth: 18,
            itemMarkHeight: 3,
            labelStyle: { fontSize: 14, fill: t.ink },
          },
        }}
      >
        {/* Buffer / transition zone: semi-transparent shading around equivalence region */}
        <BufferZone />

        {/* Equivalence point dashed marker with annotation */}
        <ChartsReferenceLine
          x={EQ_VOL}
          lineStyle={{
            strokeDasharray: "8 5",
            stroke: t.inkSoft,
            strokeWidth: 1.5,
          }}
          label="Equivalence Point — 25 mL, pH 7"
          labelAlign="start"
          labelStyle={{ fontSize: 13, fill: t.inkSoft }}
        />
      </LineChart>
    </Box>
  );
}
Runnable source as JSON, for any HTTP client: https://api.anyplot.ai/specs/titration-curve/muix/code. Any spec id and library id listed in llms-full.txt fit the same URL shape; every URL below is complete and callable.
{
  "spec_id": "titration-curve",
  "language": "javascript",
  "library": "muix",
  "page": "https://anyplot.ai/titration-curve/javascript/muix",
  "hub": "https://anyplot.ai/titration-curve",
  "code_json": "https://api.anyplot.ai/specs/titration-curve/muix/code",
  "spec_json": "https://api.anyplot.ai/specs/titration-curve",
  "render_light_png": "https://storage.googleapis.com/anyplot-images/plots/titration-curve/javascript/muix/plot-light.png",
  "render_dark_png": "https://storage.googleapis.com/anyplot-images/plots/titration-curve/javascript/muix/plot-dark.png",
  "interactive_light_html": "https://storage.googleapis.com/anyplot-images/plots/titration-curve/javascript/muix/plot-light.html",
  "interactive_dark_html": "https://storage.googleapis.com/anyplot-images/plots/titration-curve/javascript/muix/plot-dark.html",
  "quality_score": 84.0,
  "license": "MIT",
  "guide": "https://anyplot.ai/llms.txt"
}
Part of Acid-Base Titration Curve on anyplot.ai.