The same plot in 14 other libraries — Python: Altair, Bokeh, lets-plot, Matplotlib, Plotly, plotnine, Pygal; R: ggplot2; Julia: Makie.jl; JavaScript: Chart.js, D3.js, Apache ECharts, Highcharts, MUI X Charts. Compare all 15 side by side: Acid-Base Titration Curve in Python, R, Julia and JavaScript.
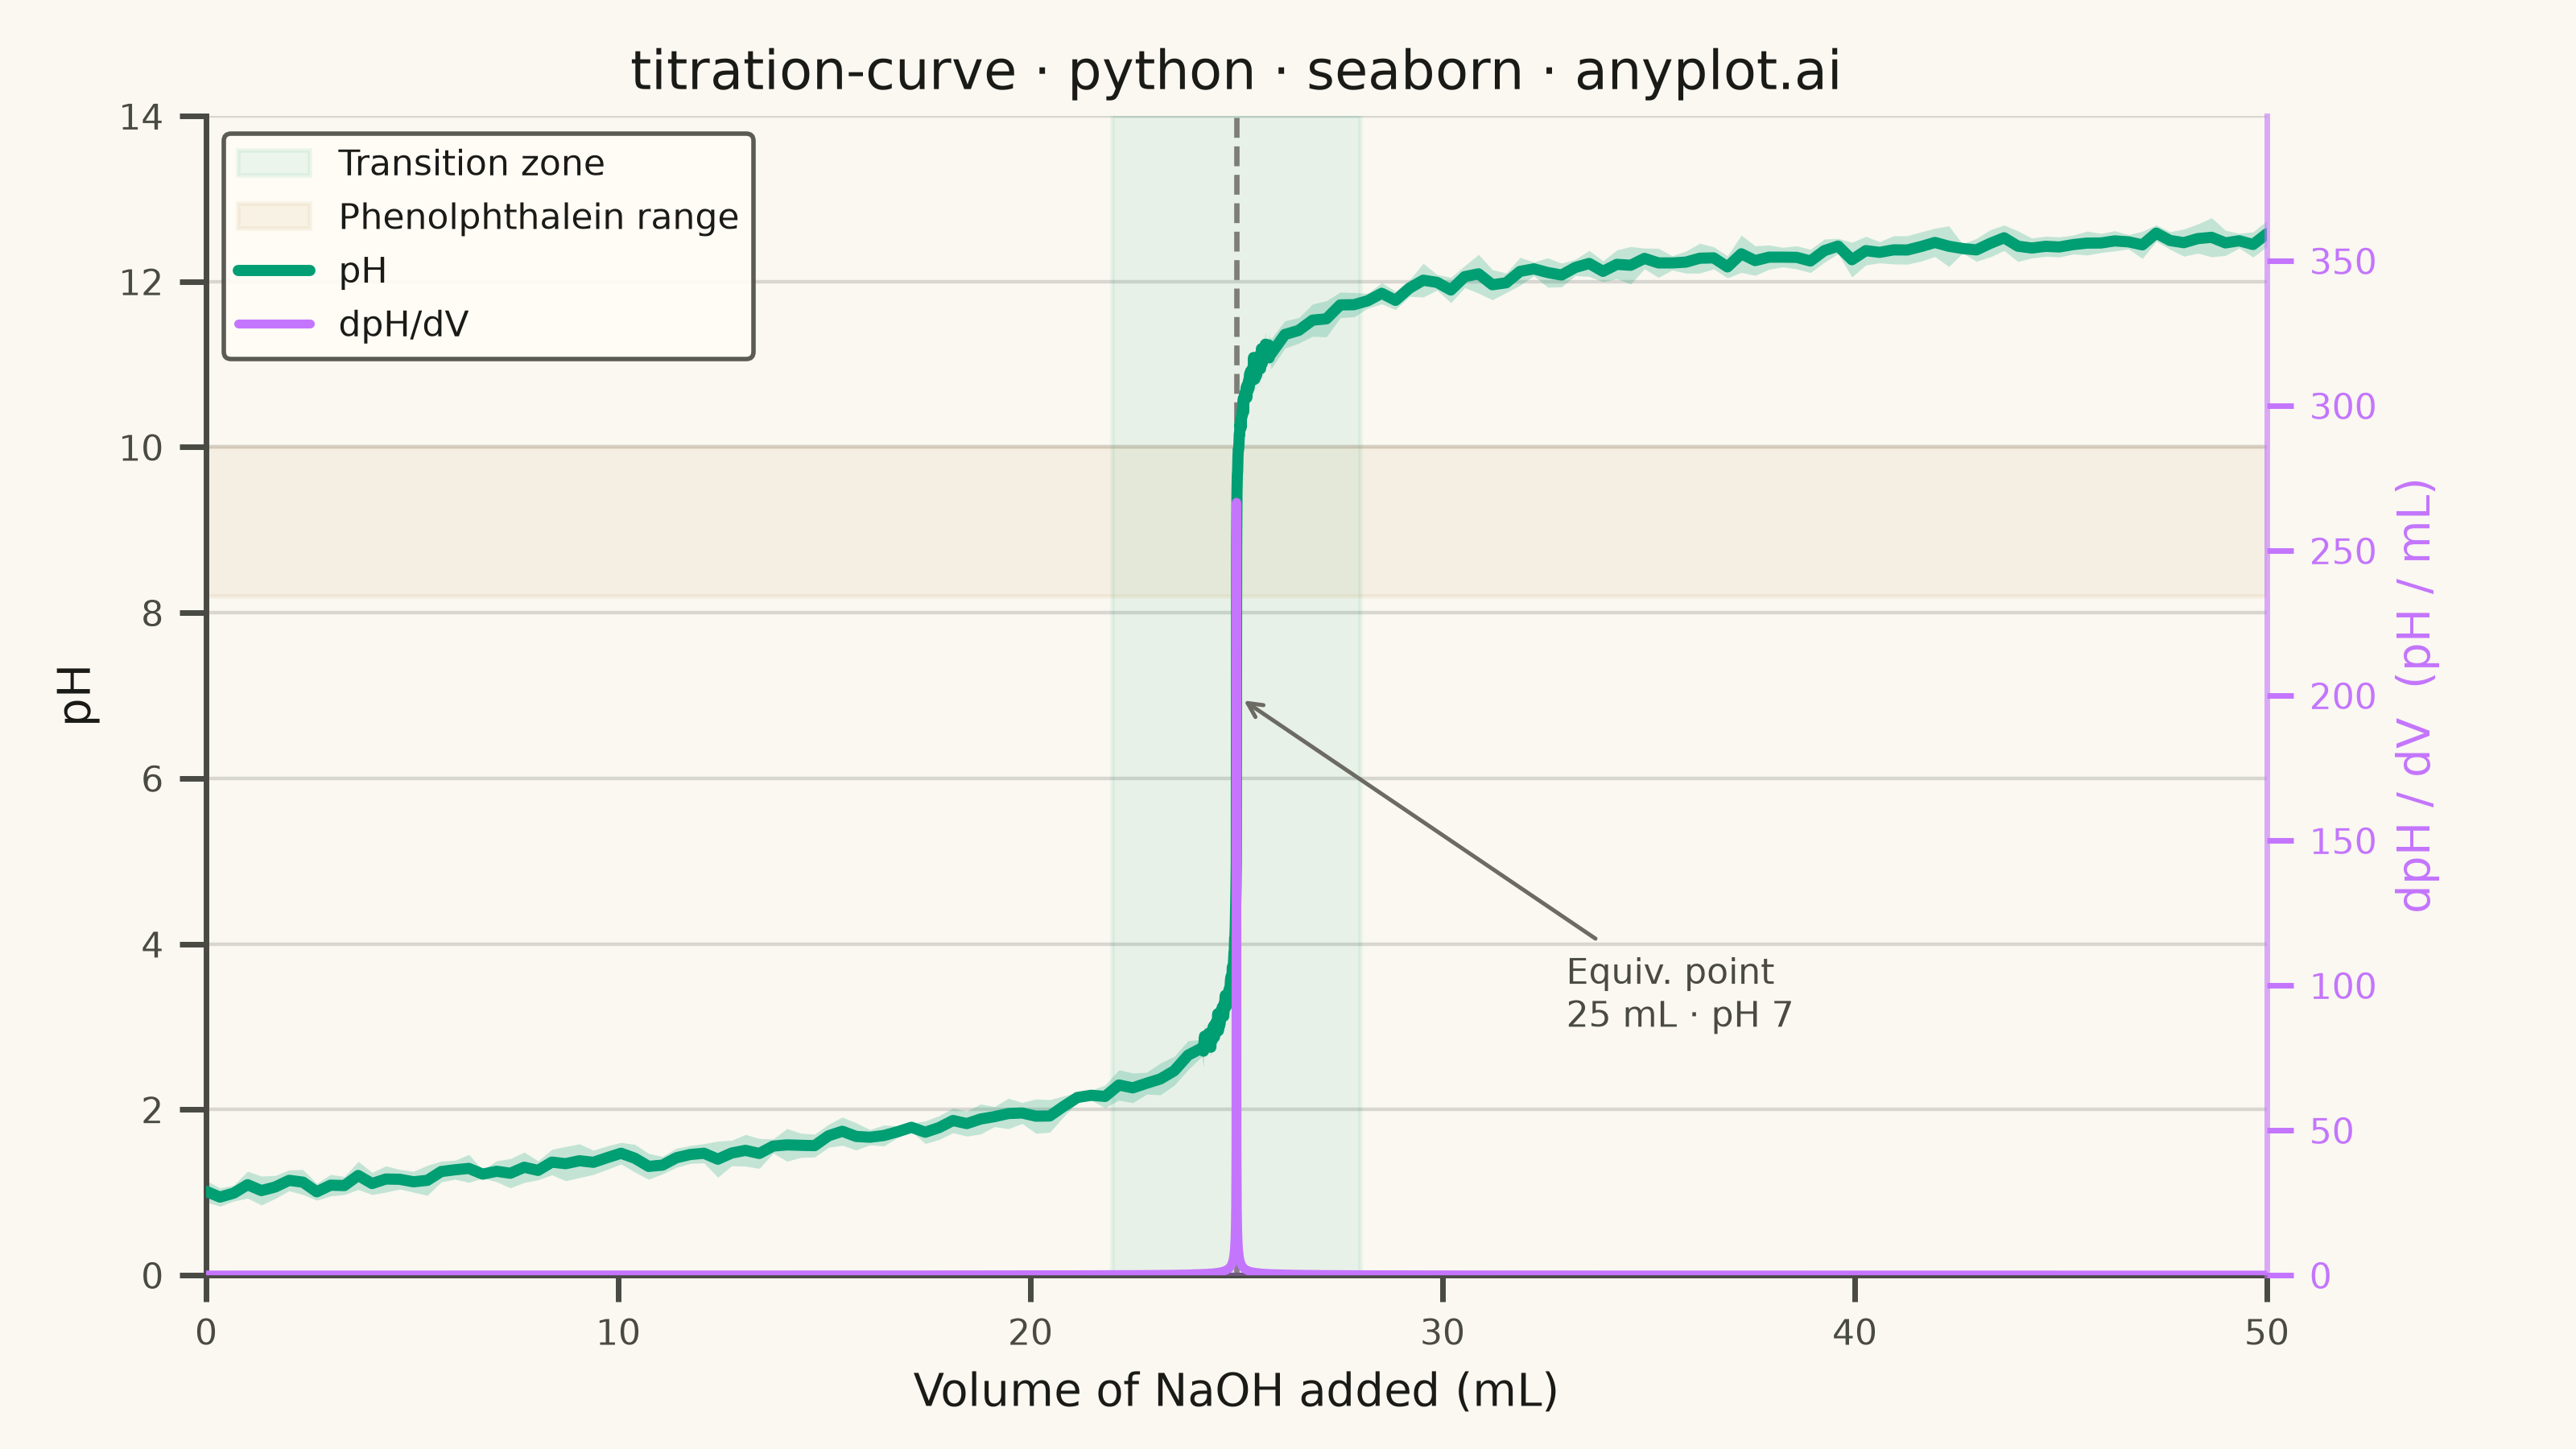
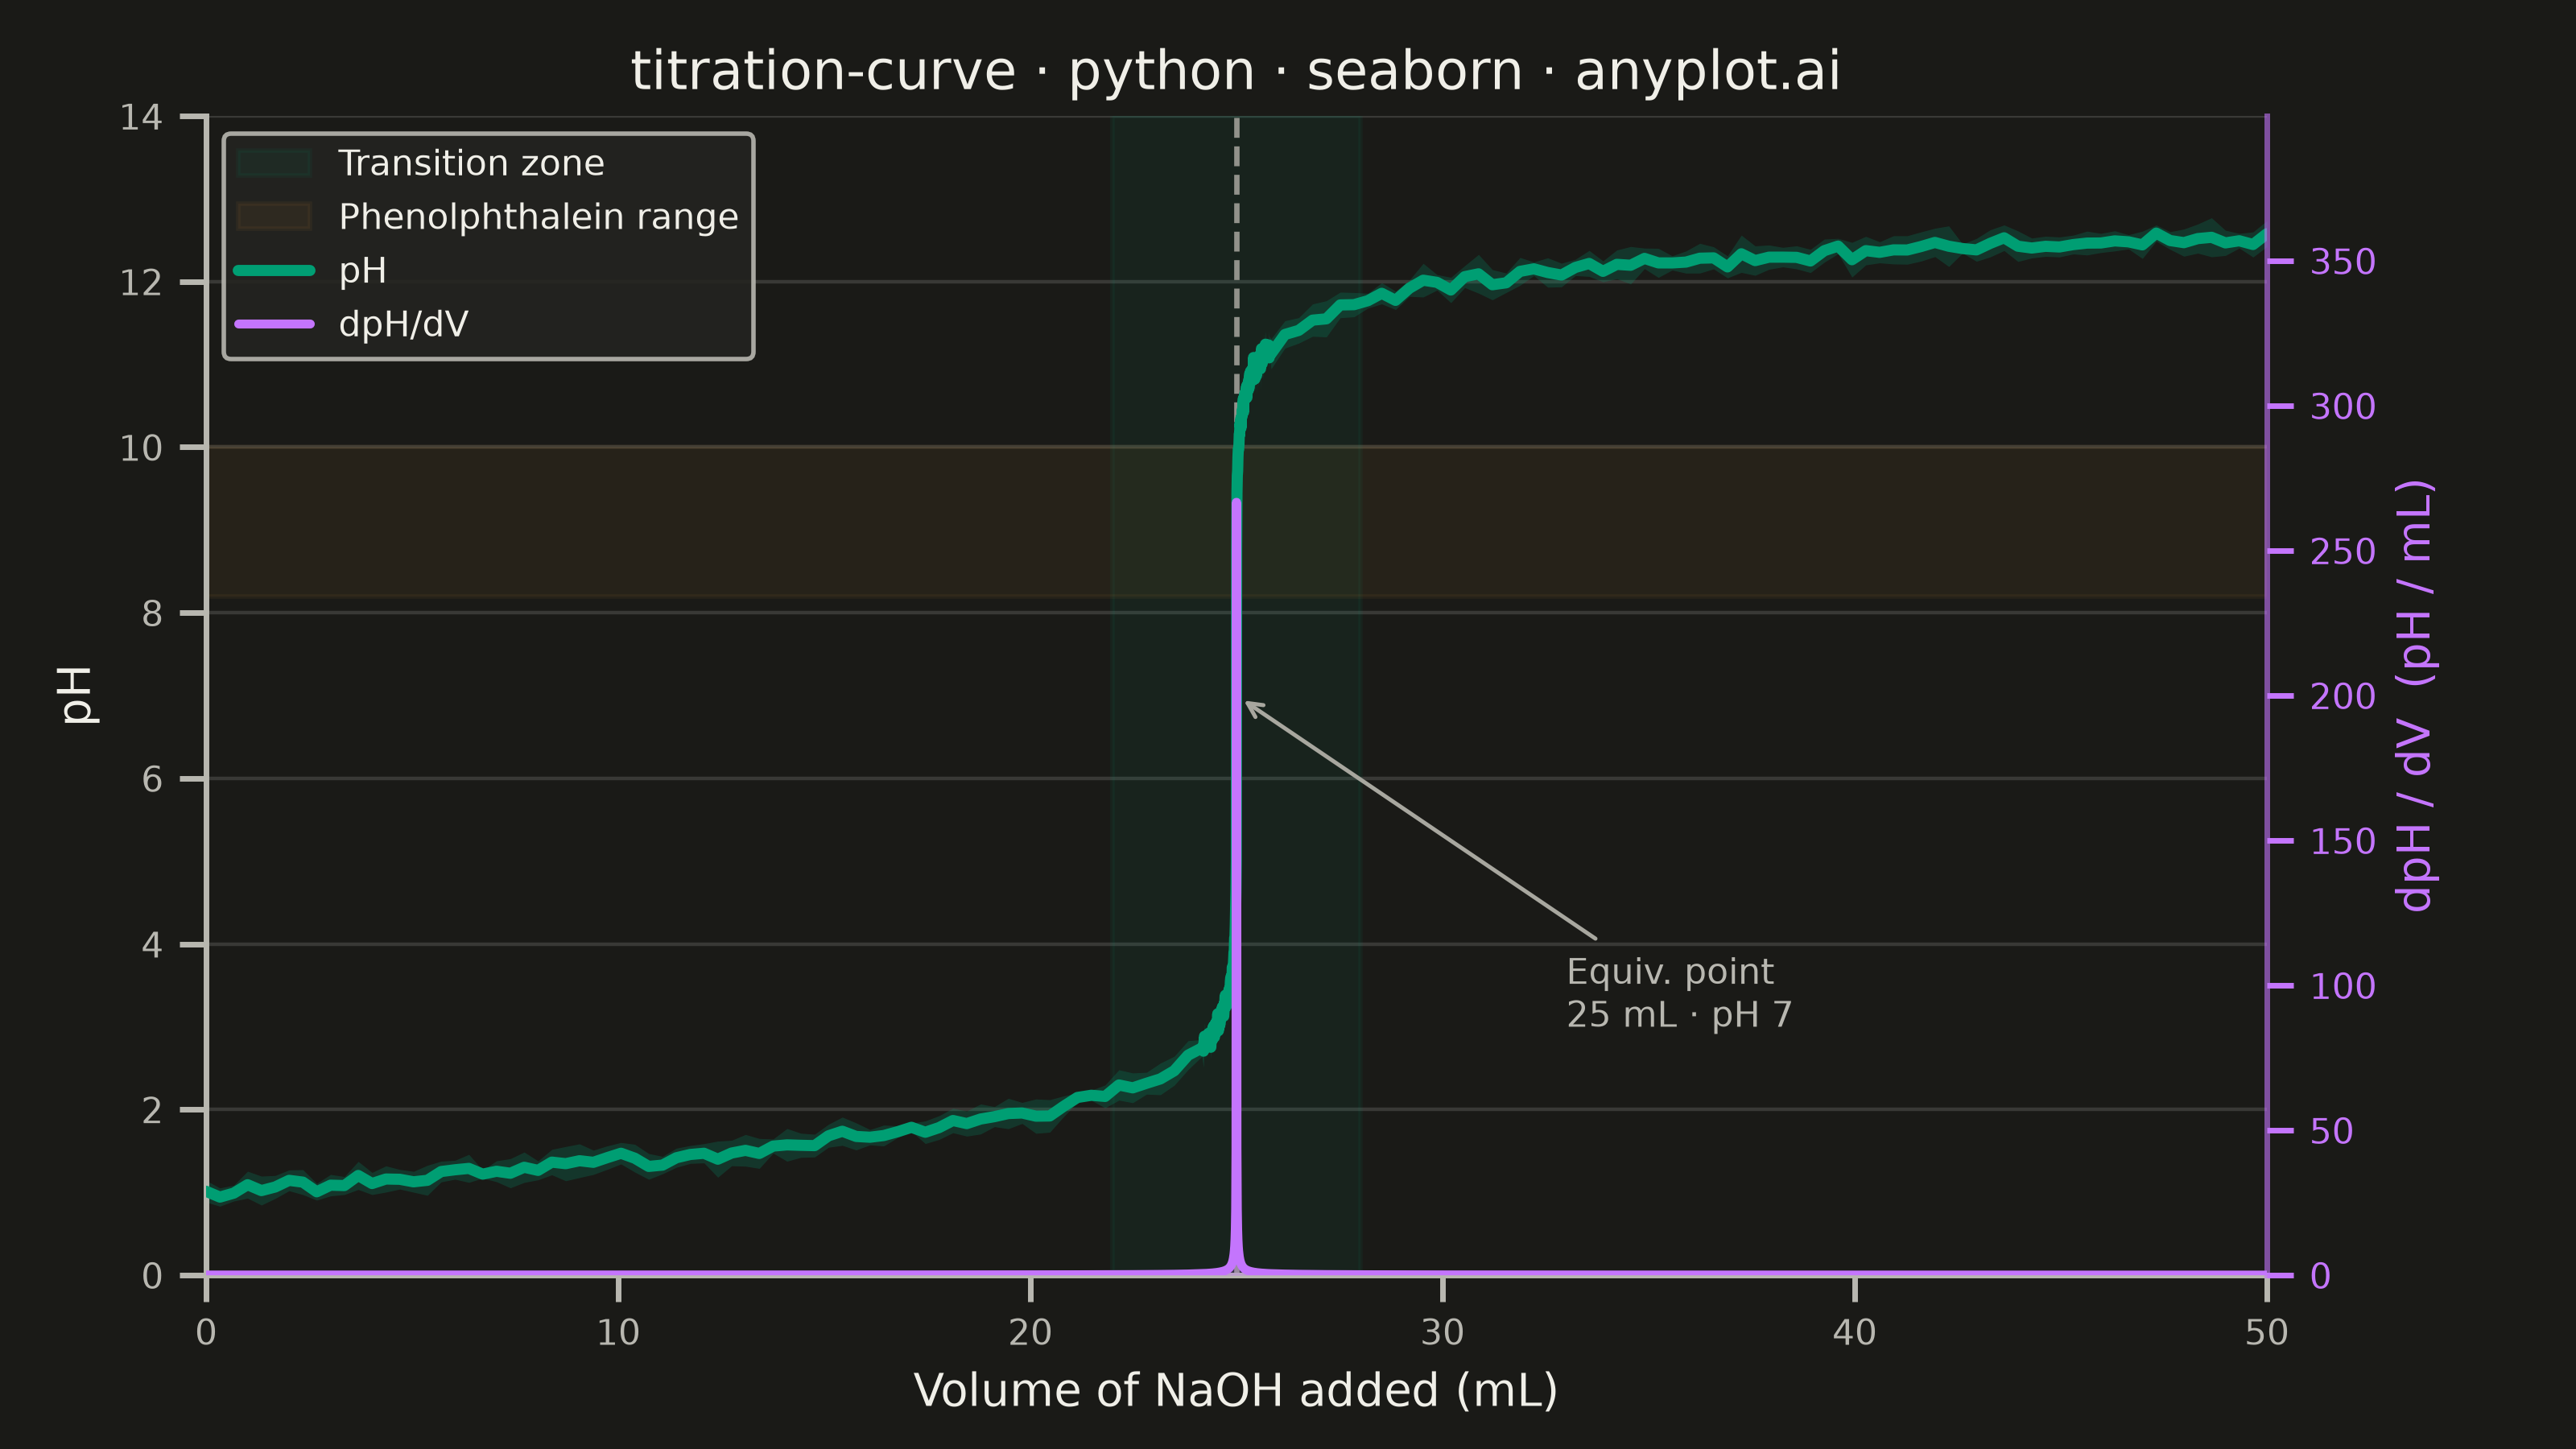
A titration curve plotting pH against volume of titrant added, producing the characteristic S-shaped (sigmoidal) curve used in analytical chemistry. The plot reveals buffer regions, equivalence points, and acid/base strength at a glance. Essential for chemistry education and laboratory analysis, it helps identify when a reaction reaches completion and which indicators are appropriate.
""" anyplot.ai
titration-curve: Acid-Base Titration Curve
Library: seaborn 0.13.2 | Python 3.13.14
Quality: 90/100 | Created: 2026-06-24
"""

import os
import sys


# Remove the script's own directory from sys.path so sibling files (e.g. matplotlib.py)
# do not shadow installed packages when running from the implementations directory.
_here = os.path.dirname(os.path.abspath(__file__))
sys.path = [p for p in sys.path if os.path.abspath(p) != _here]
del _here

import matplotlib.pyplot as plt
import numpy as np
import pandas as pd
import seaborn as sns


# Theme tokens
THEME = os.getenv("ANYPLOT_THEME", "light")
PAGE_BG = "#FAF8F1" if THEME == "light" else "#1A1A17"
ELEVATED_BG = "#FFFDF6" if THEME == "light" else "#242420"
INK = "#1A1A17" if THEME == "light" else "#F0EFE8"
INK_SOFT = "#4A4A44" if THEME == "light" else "#B8B7B0"
INK_MUTED = "#6B6A63" if THEME == "light" else "#A8A79F"

# Imprint palette — canonical order
IMPRINT_PALETTE = ["#009E73", "#C475FD", "#4467A3", "#BD8233", "#AE3030", "#2ABCCD", "#954477", "#99B314"]
BRAND = IMPRINT_PALETTE[0]  # #009E73 — pH curve (first series)
DERIV_COLOR = IMPRINT_PALETTE[1]  # #C475FD — derivative dpH/dV (second series)
INDICATOR_COLOR = IMPRINT_PALETTE[3]  # #BD8233 — phenolphthalein indicator range

# Combined context + theme setup (seaborn-idiomatic: context scales all elements globally)
sns.set_theme(
    context="notebook",
    font_scale=0.85,
    style="ticks",
    rc={
        "figure.facecolor": PAGE_BG,
        "axes.facecolor": PAGE_BG,
        "axes.edgecolor": INK_SOFT,
        "axes.labelcolor": INK,
        "text.color": INK,
        "xtick.color": INK_SOFT,
        "ytick.color": INK_SOFT,
        "grid.color": INK,
        "grid.alpha": 0.15,
        "legend.facecolor": ELEVATED_BG,
        "legend.edgecolor": INK_SOFT,
    },
)

# Data — 0.1 M HCl (25 mL) titrated with 0.1 M NaOH
# Extra density near the equivalence point for a smooth inflection
vol_naoh = np.unique(np.concatenate([np.linspace(0.0, 50.0, 150), np.linspace(24.2, 25.8, 200)]))

n_hcl = 2.5  # mmol  (25 mL × 0.1 mmol/mL)
n_naoh = vol_naoh * 0.1
total_ml = 25.0 + vol_naoh

conc_h = np.maximum((n_hcl - n_naoh) / total_ml, 1e-15)
conc_oh = np.maximum((n_naoh - n_hcl) / total_ml, 1e-15)

ph = np.where(n_naoh < n_hcl, -np.log10(conc_h), np.where(n_naoh > n_hcl, 14.0 + np.log10(conc_oh), 7.0))
ph = np.clip(ph, 0.0, 14.0)

dph_dv = np.gradient(ph, vol_naoh)

eq_vol = 25.0
eq_ph = 7.0

# Simulate replicate titration measurements (fixed seed → fully deterministic)
# Enables seaborn's native errorbar aggregation — not available in plain matplotlib
rng = np.random.default_rng(42)
n_reps = 8
ph_noise = rng.normal(0, 0.15, (n_reps, len(vol_naoh)))
ph_df = pd.DataFrame(
    {"volume": np.tile(vol_naoh, n_reps), "pH": np.clip((ph[np.newaxis, :] + ph_noise).ravel(), 0.0, 14.0)}
)

# Plot
fig, ax1 = plt.subplots(figsize=(8, 4.5), dpi=400, facecolor=PAGE_BG)
ax1.set_facecolor(PAGE_BG)

# Shaded transition zone (±3 mL around equivalence point)
ax1.axvspan(eq_vol - 3.0, eq_vol + 3.0, alpha=0.07, color=BRAND, zorder=1, label="Transition zone")

# Phenolphthalein indicator range (pH 8.2–10.0) — guides endpoint indicator selection
ax1.axhspan(8.2, 10.0, alpha=0.08, color=INDICATOR_COLOR, zorder=1, label="Phenolphthalein range")

# Primary curve — seaborn lineplot with SD confidence band from replicate data
# errorbar='sd' is seaborn-native statistical aggregation over the replicate DataFrame
sns.lineplot(
    data=ph_df,
    x="volume",
    y="pH",
    ax=ax1,
    color=BRAND,
    linewidth=2.5,
    errorbar="sd",
    err_kws={"alpha": 0.22, "linewidth": 0},
    label="pH",
    zorder=3,
)

ax1.set_xlim(0, 50)
ax1.set_ylim(0, 14)
ax1.set_xlabel("Volume of NaOH added (mL)", fontsize=10, color=INK)
ax1.set_ylabel("pH", fontsize=10, color=INK)
ax1.tick_params(axis="both", labelsize=8, colors=INK_SOFT)
ax1.yaxis.grid(True, alpha=0.15, linewidth=0.8, color=INK, zorder=0)

# Equivalence point — dashed vertical marker
ax1.axvline(x=eq_vol, color=INK_MUTED, linestyle="--", linewidth=1.2, alpha=0.85, zorder=2)
ax1.annotate(
    f"Equiv. point\n{eq_vol:.0f} mL · pH {eq_ph:.0f}",
    xy=(eq_vol, eq_ph),
    xytext=(33.0, 3.0),
    fontsize=8,
    color=INK_SOFT,
    arrowprops={"arrowstyle": "->", "color": INK_MUTED, "lw": 0.9},
    zorder=5,
)

# Secondary axis — derivative dpH/dV locates the equivalence point precisely
ax2 = ax1.twinx()
ax2.patch.set_visible(False)

# Fill under spike for strong visual prominence, then overlay the seaborn line
ax2.fill_between(vol_naoh, 0, dph_dv, alpha=0.20, color=DERIV_COLOR, zorder=2)
sns.lineplot(x=vol_naoh, y=dph_dv, ax=ax2, color=DERIV_COLOR, linewidth=2.0, label="dpH/dV", zorder=3)

ax2.set_ylabel("dpH / dV  (pH / mL)", fontsize=10, color=DERIV_COLOR)
ax2.tick_params(axis="y", labelsize=8, colors=DERIV_COLOR)
ax2.set_ylim(0, np.max(dph_dv) * 1.5)

# Spine styling — sns.despine for ax1 (seaborn-idiomatic), manual for ax2
sns.despine(ax=ax1, right=True, top=True)
ax1.spines["left"].set_color(INK_SOFT)
ax1.spines["bottom"].set_color(INK_SOFT)
ax2.spines["top"].set_visible(False)
ax2.spines["left"].set_visible(False)
ax2.spines["bottom"].set_visible(False)
ax2.spines["right"].set_visible(True)
ax2.spines["right"].set_color(DERIV_COLOR)
ax2.spines["right"].set_alpha(0.6)

# Combined legend (primary + secondary axes) — remove ax2 auto-legend first
h1, l1 = ax1.get_legend_handles_labels()
h2, l2 = ax2.get_legend_handles_labels()
if ax2.get_legend():
    ax2.get_legend().remove()
ax1.legend(h1 + h2, l1 + l2, fontsize=8, loc="upper left", facecolor=ELEVATED_BG, edgecolor=INK_SOFT, framealpha=0.9)

# Title
title = "titration-curve · python · seaborn · anyplot.ai"
ax1.set_title(title, fontsize=12, fontweight="medium", color=INK)

fig.subplots_adjust(left=0.08, right=0.88, top=0.92, bottom=0.12)

# Save — no bbox_inches='tight' per seaborn canvas rule (figsize × dpi = exact target)
plt.savefig(f"plot-{THEME}.png", dpi=400, facecolor=PAGE_BG)
plt.close()
Runnable source as JSON, for any HTTP client: https://api.anyplot.ai/specs/titration-curve/seaborn/code. Any spec id and library id listed in llms-full.txt fit the same URL shape; every URL below is complete and callable.
{
  "spec_id": "titration-curve",
  "language": "python",
  "library": "seaborn",
  "page": "https://anyplot.ai/titration-curve/python/seaborn",
  "hub": "https://anyplot.ai/titration-curve",
  "code_json": "https://api.anyplot.ai/specs/titration-curve/seaborn/code",
  "spec_json": "https://api.anyplot.ai/specs/titration-curve",
  "render_light_png": "https://storage.googleapis.com/anyplot-images/plots/titration-curve/python/seaborn/plot-light.png",
  "render_dark_png": "https://storage.googleapis.com/anyplot-images/plots/titration-curve/python/seaborn/plot-dark.png",
  "quality_score": 90.0,
  "license": "MIT",
  "guide": "https://anyplot.ai/llms.txt"
}
Part of Acid-Base Titration Curve on anyplot.ai.