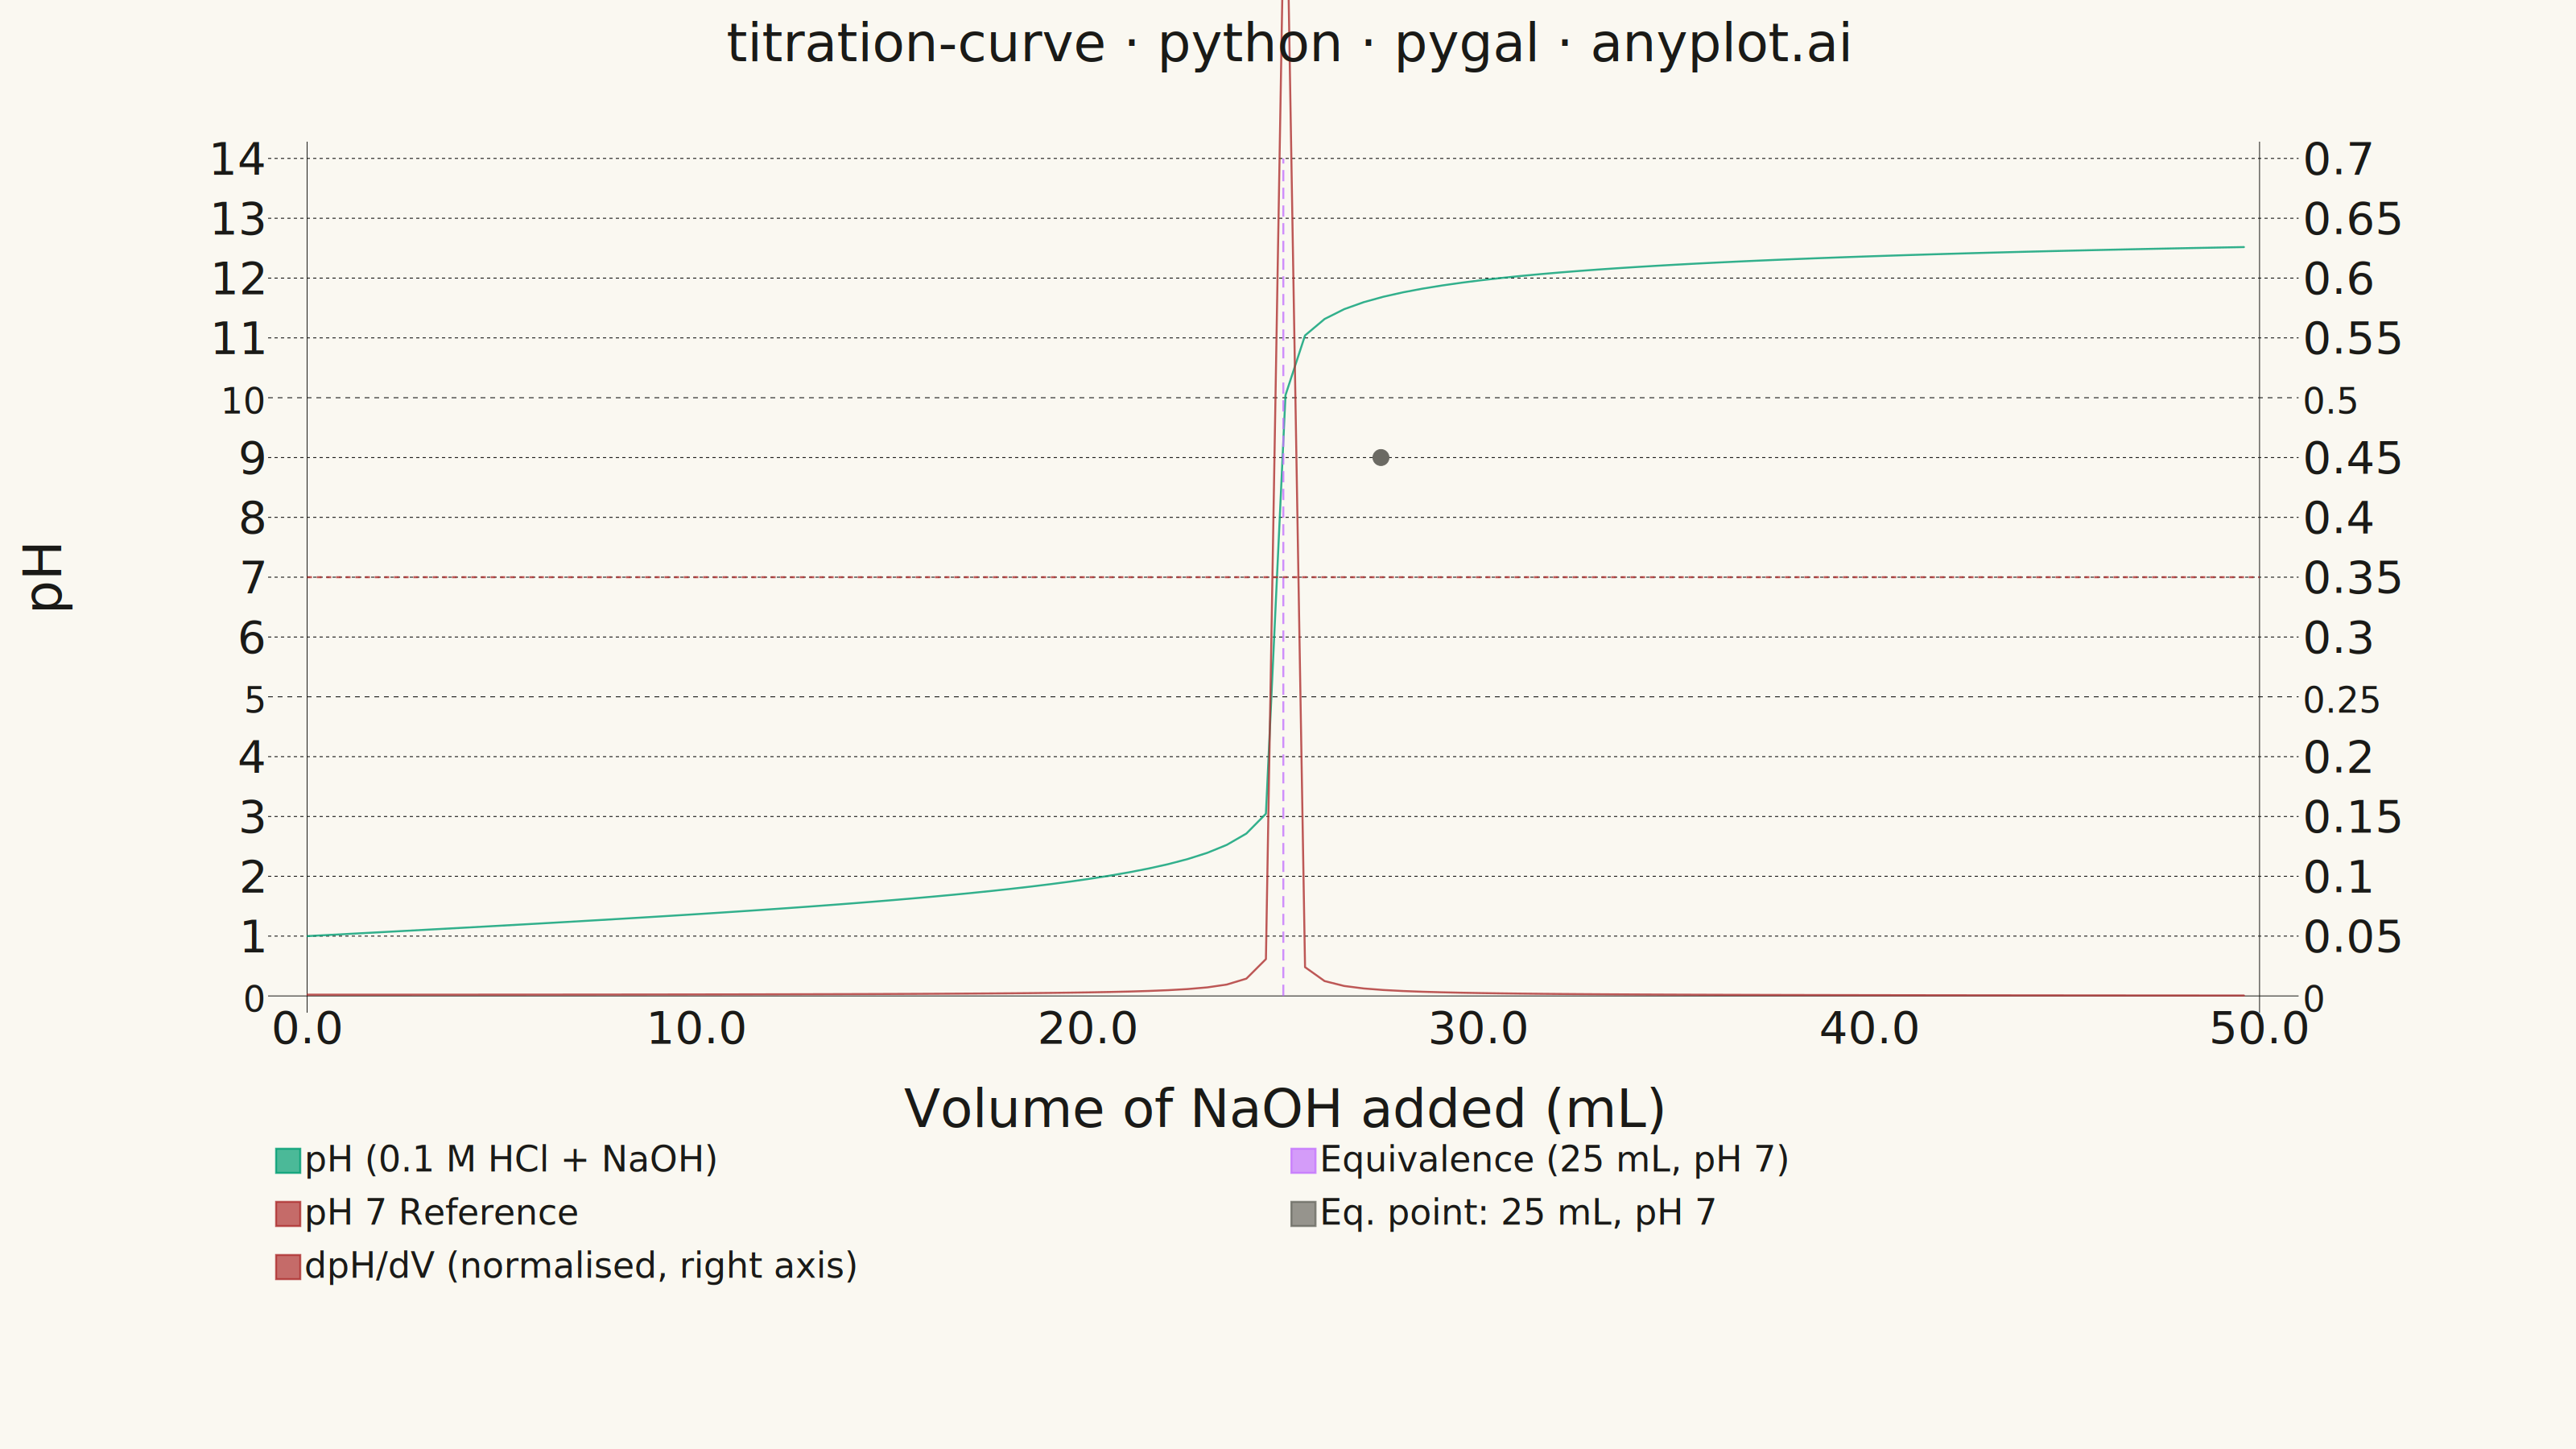
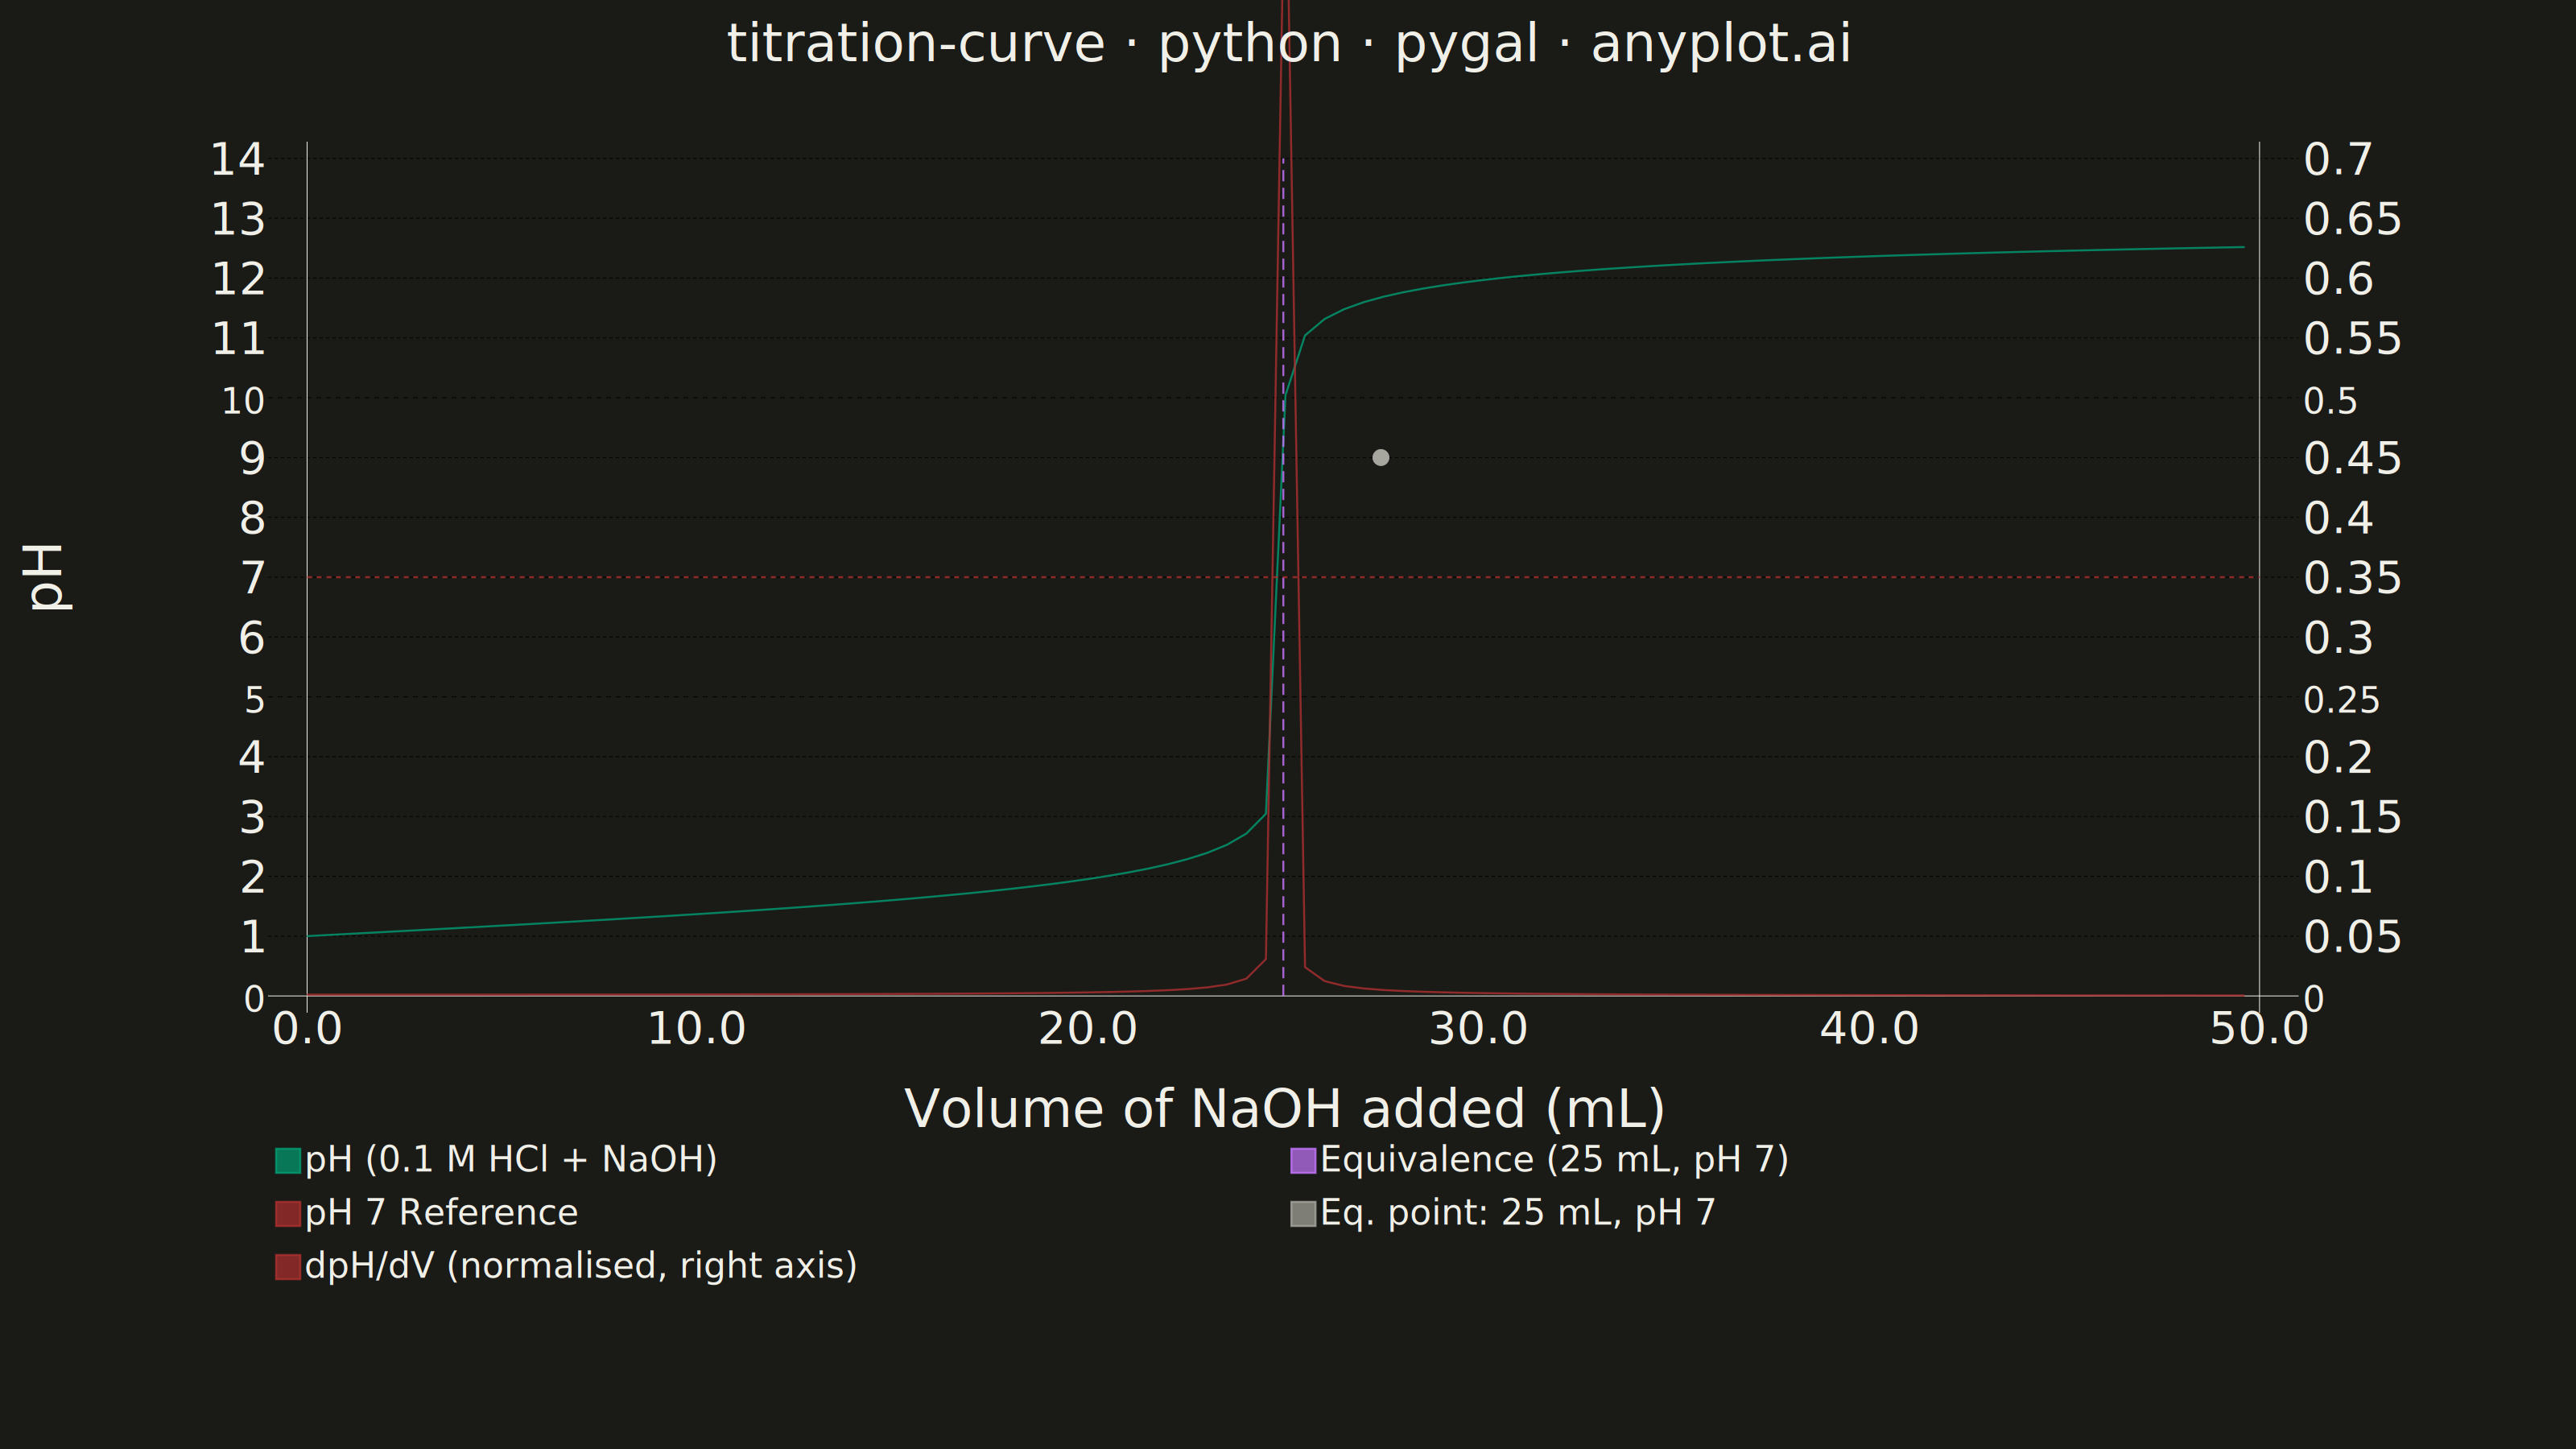
A titration curve plotting pH against volume of titrant added, producing the characteristic S-shaped (sigmoidal) curve used in analytical chemistry. The plot reveals buffer regions, equivalence points, and acid/base strength at a glance. Essential for chemistry education and laboratory analysis, it helps identify when a reaction reaches completion and which indicators are appropriate.
""" anyplot.ai
titration-curve: Acid-Base Titration Curve
Library: pygal 3.1.3 | Python 3.13.14
Quality: 84/100 | Updated: 2026-06-24
"""

import os
import sys


# Prevent the local pygal.py from shadowing the installed pygal package
sys.path = [p for p in sys.path if p and os.path.abspath(p) != os.path.abspath(os.path.dirname(__file__))]

import numpy as np
import pygal
from pygal.style import Style


# Theme tokens
THEME = os.getenv("ANYPLOT_THEME", "light")
PAGE_BG = "#FAF8F1" if THEME == "light" else "#1A1A17"
INK = "#1A1A17" if THEME == "light" else "#F0EFE8"
INK_MUTED = "#6B6A63" if THEME == "light" else "#A8A79F"

# Imprint palette — semantic positions for this chart
# Series add() order: pH (1) → dpH/dV (2) → equivalence (3) → pH-7 ref (4) → annotation (5)
CHART_PALETTE = (
    "#009E73",  # pH curve — Imprint brand green (position 1)
    "#C475FD",  # dpH/dV derivative — Imprint lavender (position 2)
    "#AE3030",  # equivalence point — matte red (semantic: critical threshold)
    INK_MUTED,  # pH 7 reference — muted neutral (structural reference)
    "#AE3030",  # equivalence annotation text (matches line color)
)

# Data — 25 mL of 0.1 M HCl titrated with 0.1 M NaOH
ca, va = 0.1, 25.0
cb = 0.1
equivalence_vol = va * ca / cb  # 25.0 mL

volume_ml = np.linspace(0.01, 50.0, 500)
ph = np.empty_like(volume_ml)
for i, v in enumerate(volume_ml):
    moles_h = ca * va - cb * v
    total_vol = va + v
    if moles_h > 1e-10:
        ph[i] = -np.log10(moles_h / total_vol)
    elif moles_h < -1e-10:
        oh_conc = -moles_h / total_vol
        ph[i] = 14.0 + np.log10(oh_conc)
    else:
        ph[i] = 7.0

# Derivative dpH/dV — normalised 0-1 so the right axis has clean labels
dpH_dV = np.gradient(ph, volume_ml)
dpH_dV = np.clip(dpH_dV, 0, None)
dpH_dV = dpH_dV / dpH_dV.max()  # peak = 1.0

eq_vol = equivalence_vol
eq_ph = 7.0

# Title — 45 chars < 67 baseline → full title_font_size=66
title_str = "titration-curve · python · pygal · anyplot.ai"

# Style — Imprint palette, theme-adaptive chrome
custom_style = Style(
    background=PAGE_BG,
    plot_background=PAGE_BG,
    foreground=INK,
    foreground_strong=INK,
    foreground_subtle=INK_MUTED,
    colors=CHART_PALETTE,
    title_font_size=66,
    label_font_size=56,
    major_label_font_size=44,
    legend_font_size=44,
    value_font_size=36,
    stroke_width=2.5,
    font_family="'Helvetica Neue', 'Helvetica', 'Arial', sans-serif",
)

# Subsample — 100 points gives a smooth curve with fast render
step = 5
curve_pts = [(float(volume_ml[i]), float(ph[i])) for i in range(0, len(volume_ml), step)]
deriv_pts = [(float(volume_ml[i]), float(dpH_dV[i])) for i in range(0, len(volume_ml), step)]
eq_line_pts = [(float(eq_vol), 0.0), (float(eq_vol), 14.0)]
ref_ph7_pts = [(0.0, 7.0), (50.0, 7.0)]

# Chart — single XY with secondary y-axis for dpH/dV overlay
chart = pygal.XY(
    style=custom_style,
    width=3200,
    height=1800,
    title=title_str,
    x_title="Volume of NaOH added (mL)",
    y_title="pH",
    secondary_range=(0.0, 0.7),
    show_dots=False,
    show_x_guides=False,
    show_y_guides=True,
    range=(0.0, 14.0),
    xrange=(0.0, 50.0),
    legend_at_bottom=True,
    legend_at_bottom_columns=2,
    legend_box_size=30,
    truncate_legend=-1,
    margin=30,
    margin_top=100,
    margin_left=180,
    margin_right=200,
    margin_bottom=160,
    tooltip_fancy_mode=True,
    x_value_formatter=lambda x: f"{x:.1f}",
    y_value_formatter=lambda y: f"{y:.1f}",
)

# Series — color order follows CHART_PALETTE positions
chart.add(
    "pH (0.1 M HCl + NaOH)",
    curve_pts,
    show_dots=False,
    stroke_style={"width": 8, "linecap": "round", "linejoin": "round"},
)

chart.add(
    "dpH/dV (normalised, right axis)",
    deriv_pts,
    secondary=True,
    show_dots=False,
    stroke_style={"width": 6, "linecap": "round", "linejoin": "round"},
)

chart.add(
    f"Equivalence ({eq_vol:.0f} mL, pH {eq_ph:.0f})",
    eq_line_pts,
    show_dots=False,
    stroke_style={"width": 3, "dasharray": "14,8"},
)

chart.add("pH 7 Reference", ref_ph7_pts, show_dots=False, stroke_style={"width": 2, "dasharray": "6,6"})

# Direct text annotation at equivalence point — positioned to the right of the vertical line
ann_label = f"{eq_vol:.0f} mL, pH {eq_ph:.0f}"
chart.add(
    f"Eq. point: {ann_label}",
    [(float(eq_vol + 2.5), float(eq_ph + 2.0))],
    show_dots=True,
    dots_size=10,
    print_values=True,
    value_formatter=lambda _: ann_label,
    stroke=False,
)

# Save
chart.render_to_png(f"plot-{THEME}.png")

with open(f"plot-{THEME}.html", "wb") as f:
    f.write(chart.render())
Runnable source as JSON, for any HTTP client: https://api.anyplot.ai/specs/titration-curve/pygal/code. Any spec id and library id listed in llms-full.txt fit the same URL shape; every URL below is complete and callable.
{
  "spec_id": "titration-curve",
  "language": "python",
  "library": "pygal",
  "page": "https://anyplot.ai/titration-curve/python/pygal",
  "hub": "https://anyplot.ai/titration-curve",
  "code_json": "https://api.anyplot.ai/specs/titration-curve/pygal/code",
  "spec_json": "https://api.anyplot.ai/specs/titration-curve",
  "render_light_png": "https://storage.googleapis.com/anyplot-images/plots/titration-curve/python/pygal/plot-light.png",
  "render_dark_png": "https://storage.googleapis.com/anyplot-images/plots/titration-curve/python/pygal/plot-dark.png",
  "interactive_light_html": "https://storage.googleapis.com/anyplot-images/plots/titration-curve/python/pygal/plot-light.html",
  "interactive_dark_html": "https://storage.googleapis.com/anyplot-images/plots/titration-curve/python/pygal/plot-dark.html",
  "quality_score": 84.0,
  "license": "MIT",
  "guide": "https://anyplot.ai/llms.txt"
}
Part of Acid-Base Titration Curve on anyplot.ai.