The same plot in 14 other libraries — JavaScript: D3.js, Apache ECharts, Highcharts, MUI X Charts; Python: Altair, Bokeh, lets-plot, Matplotlib, Plotly, plotnine, Pygal, Seaborn; R: ggplot2; Julia: Makie.jl. Compare all 15 side by side: Phylogenetic Tree Diagram in Python, R, Julia and JavaScript.
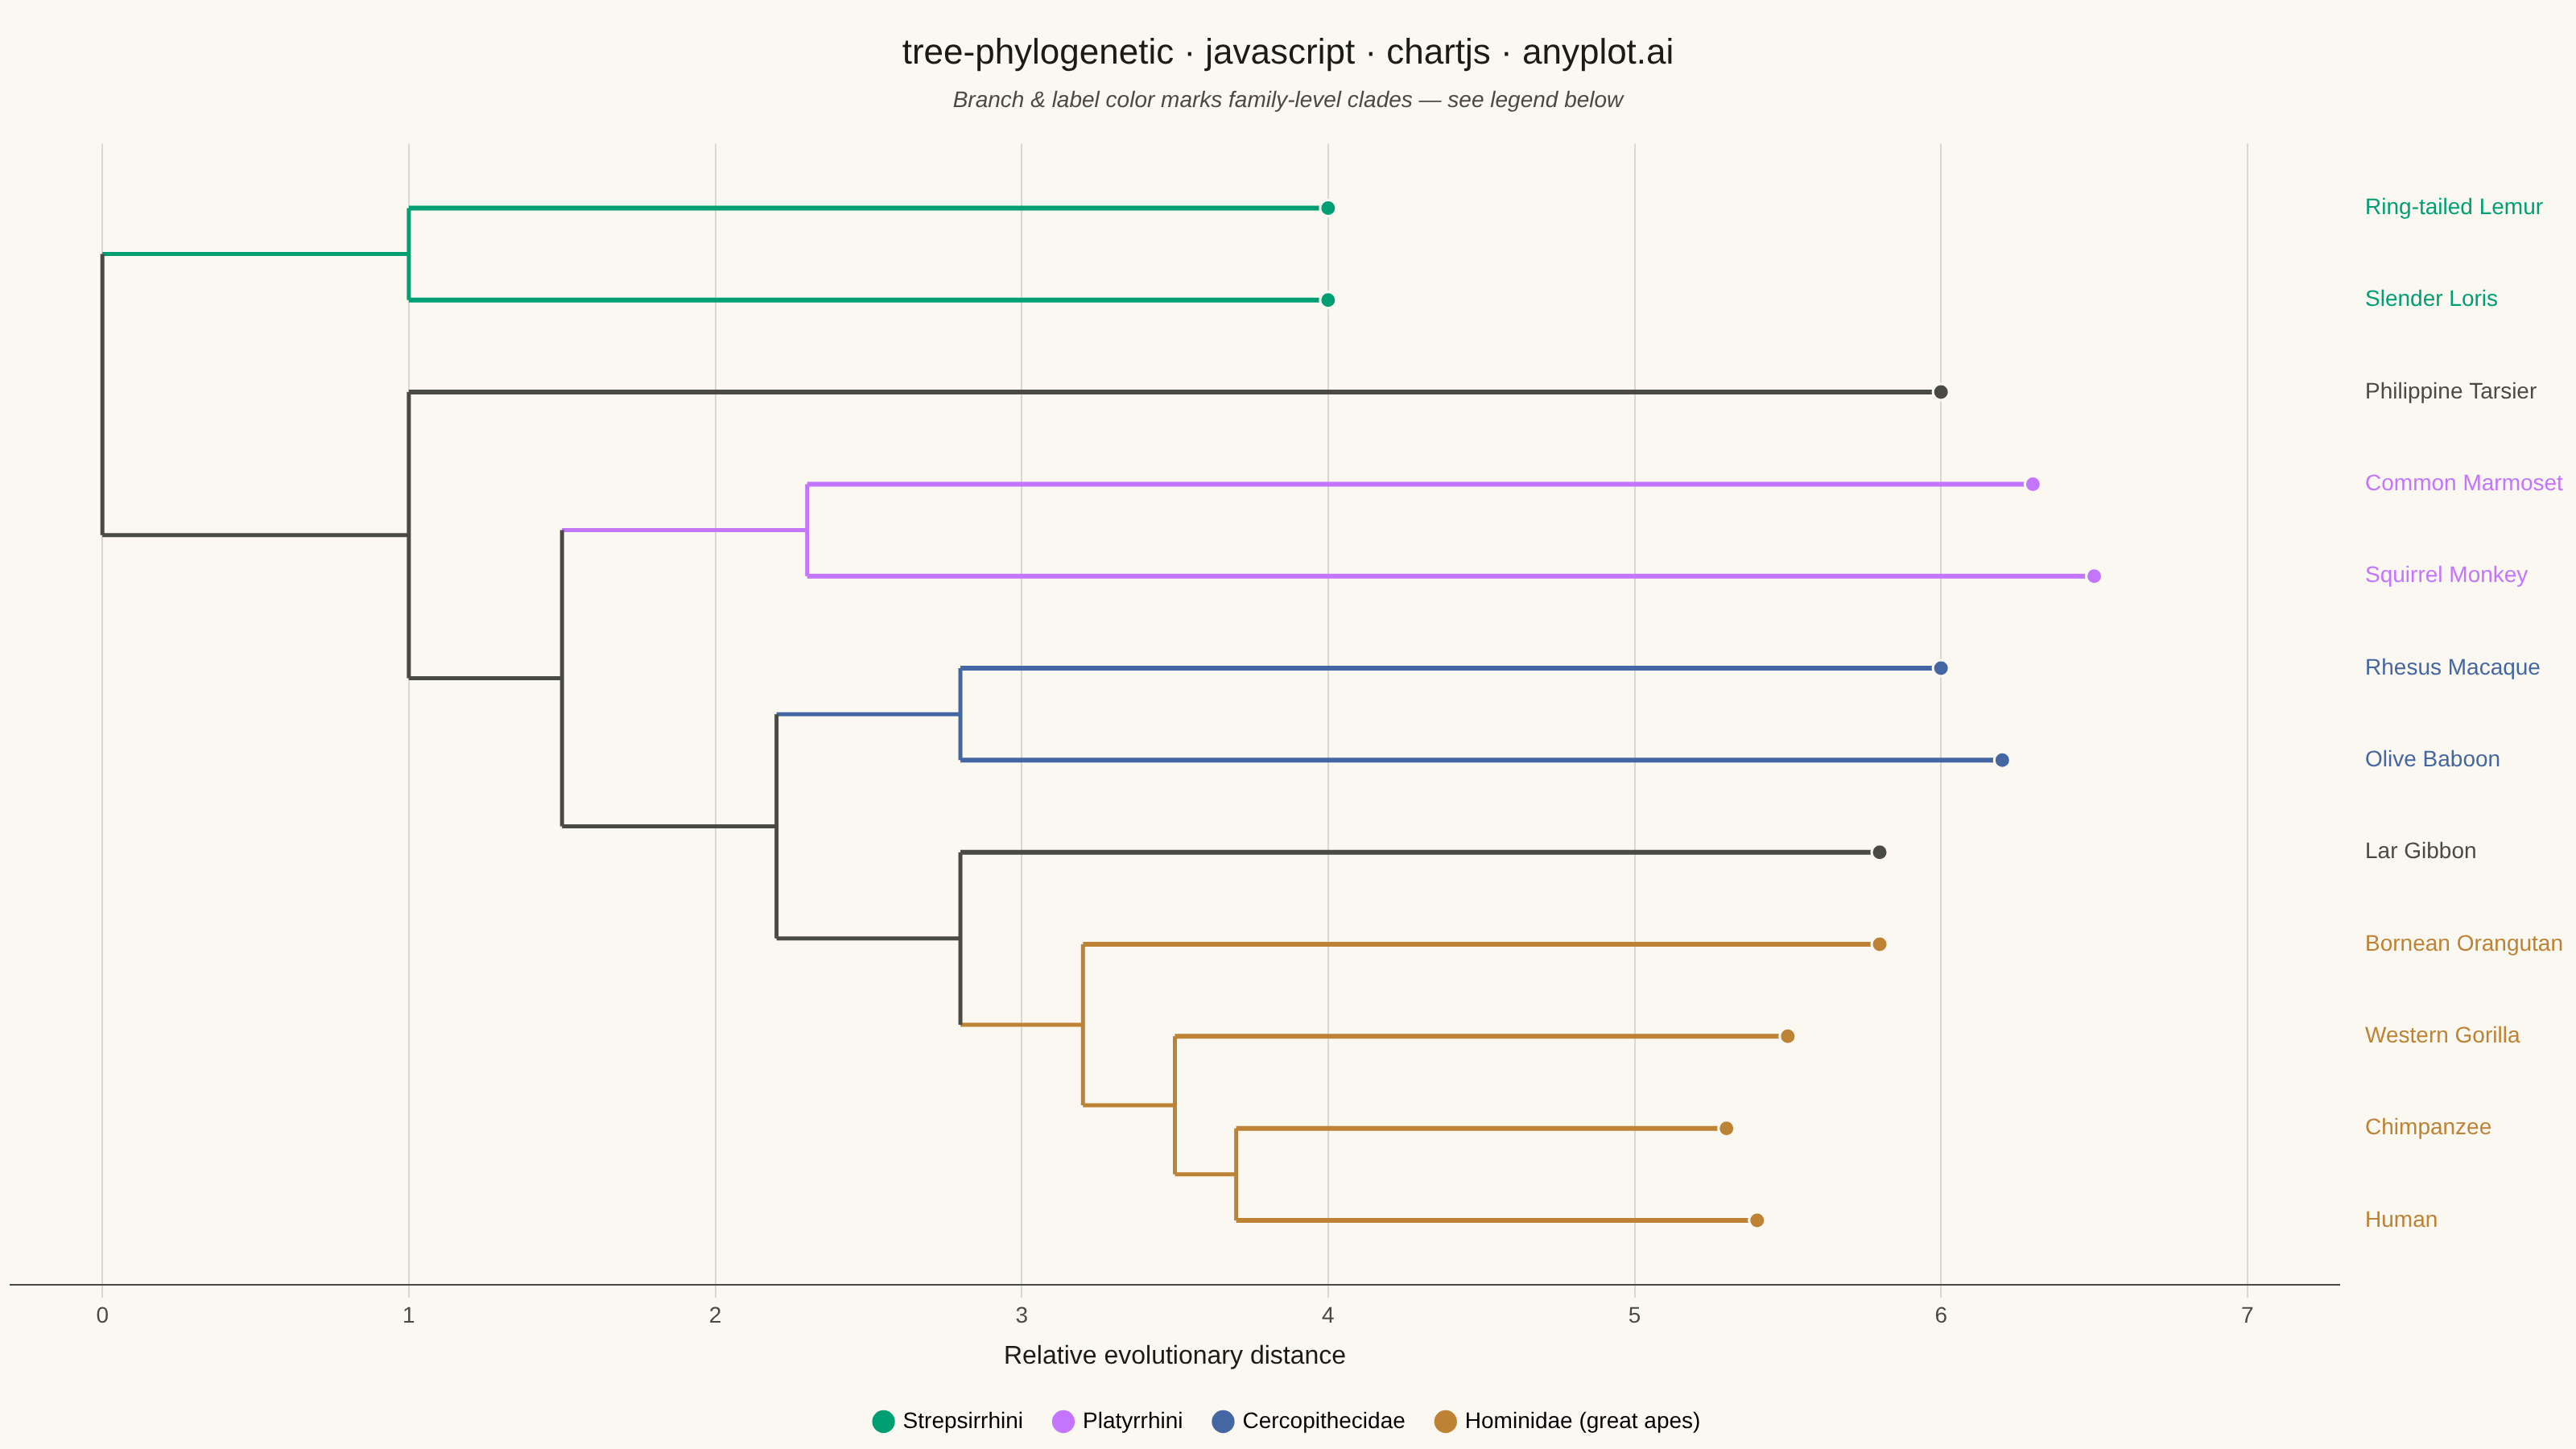
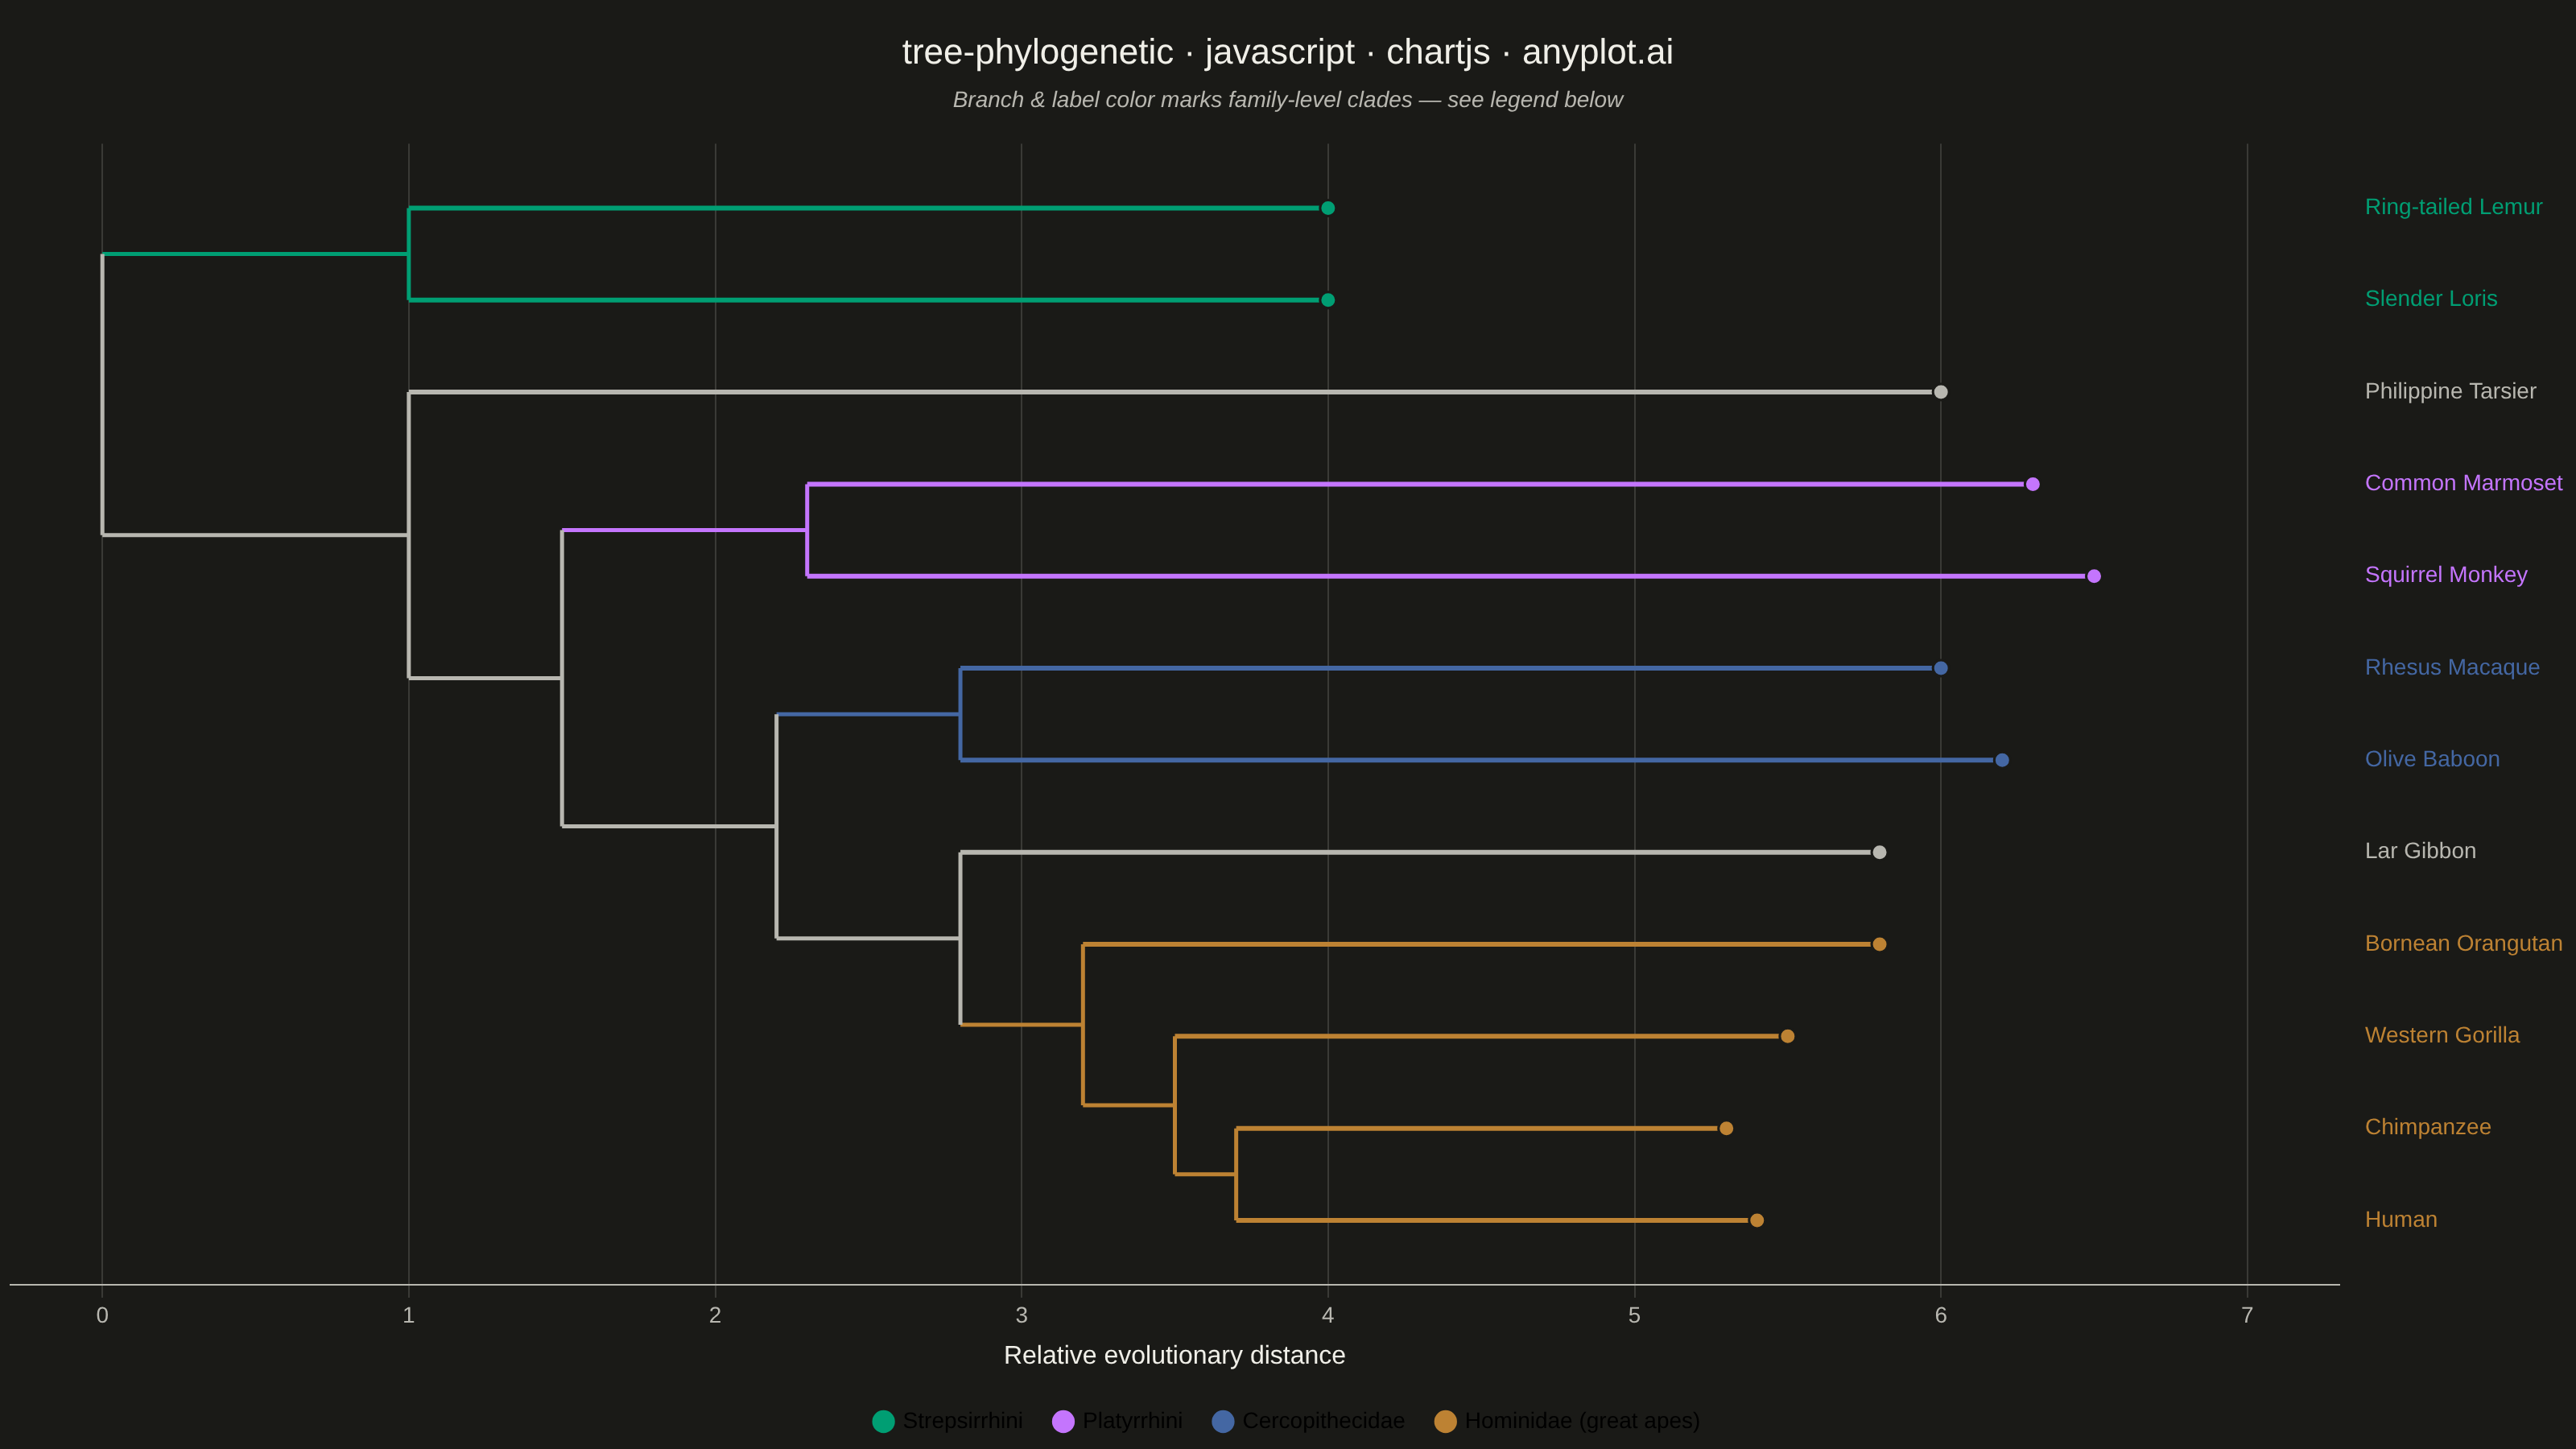
A phylogenetic tree (evolutionary tree) visualization showing hierarchical relationships between species or sequences, with branch lengths proportional to evolutionary distance. This diagram reveals how organisms or genes evolved from common ancestors, with longer branches indicating greater divergence. Phylogenetic trees are essential for understanding evolutionary history, taxonomy, and molecular biology relationships.
// anyplot.ai
// tree-phylogenetic: Phylogenetic Tree Diagram
// Library: chartjs 4.4.7 | JavaScript 22.23.2
// Quality: 91/100 | Created: 2026-09-09

//# anyplot-orientation: landscape

const t = window.ANYPLOT_TOKENS;

// --- Data: illustrative primate phylogeny (mitochondrial-DNA style) --------
// Newick-equivalent topology (branch lengths in relative divergence units):
// (((Lemur:3.0,Loris:3.0)Strepsirrhini:1.0,(Tarsier:5.0,((Marmoset:4.0,
// SquirrelMonkey:4.2)Platyrrhini:0.8,((Macaque:3.2,Baboon:3.4)
// Cercopithecidae:0.6,(Gibbon:3.0,(Orangutan:2.6,(Gorilla:2.0,
// (Chimpanzee:1.6,Human:1.7)Hominini:0.2)Homininae:0.3)Hominidae:0.4)
// Hominoidea:0.6)Catarrhini:0.7)Simiiformes:0.5)Haplorhini:1.0)Root;
const tree = {
  length: 0,
  children: [
    {
      // Strepsirrhini
      clade: "strepsirrhini",
      length: 1.0,
      children: [
        { name: "Ring-tailed Lemur", length: 3.0 },
        { name: "Slender Loris", length: 3.0 },
      ],
    },
    {
      // Haplorhini
      length: 1.0,
      children: [
        { name: "Philippine Tarsier", length: 5.0 },
        {
          // Simiiformes
          length: 0.5,
          children: [
            {
              // Platyrrhini
              clade: "platyrrhini",
              length: 0.8,
              children: [
                { name: "Common Marmoset", length: 4.0 },
                { name: "Squirrel Monkey", length: 4.2 },
              ],
            },
            {
              // Catarrhini
              length: 0.7,
              children: [
                {
                  // Cercopithecidae
                  clade: "cercopithecidae",
                  length: 0.6,
                  children: [
                    { name: "Rhesus Macaque", length: 3.2 },
                    { name: "Olive Baboon", length: 3.4 },
                  ],
                },
                {
                  // Hominoidea
                  length: 0.6,
                  children: [
                    { name: "Lar Gibbon", length: 3.0 },
                    {
                      // Hominidae (great apes)
                      clade: "hominidae",
                      length: 0.4,
                      children: [
                        { name: "Bornean Orangutan", length: 2.6 },
                        {
                          // Homininae
                          length: 0.3,
                          children: [
                            { name: "Western Gorilla", length: 2.0 },
                            {
                              // Hominini
                              length: 0.2,
                              children: [
                                { name: "Chimpanzee", length: 1.6 },
                                { name: "Human", length: 1.7 },
                              ],
                            },
                          ],
                        },
                      ],
                    },
                  ],
                },
              ],
            },
          ],
        },
      ],
    },
  ],
};

// --- Layout: cumulative branch length -> x, leaf order -> y ---------------
let leafCounter = 0;
let maxX = 0;
function layout(node, parentX) {
  node.x = parentX + node.length;
  maxX = Math.max(maxX, node.x);
  if (node.children) {
    node.children.forEach((c) => layout(c, node.x));
    const ys = node.children.map((c) => c.y);
    node.y = (Math.min(...ys) + Math.max(...ys)) / 2;
  } else {
    node.y = leafCounter++;
  }
}
layout(tree, 0);
const n = leafCounter;
const maxXTick = Math.ceil(maxX);

// --- Clade colors (Imprint palette, canonical order) -----------------------
const cladeColors = {
  strepsirrhini: t.palette[0], // brand green
  platyrrhini: t.palette[1], // lavender
  cercopithecidae: t.palette[2], // blue
  hominidae: t.palette[3], // ochre — great apes, incl. the human lineage
};
const cladeNames = {
  strepsirrhini: "Strepsirrhini",
  platyrrhini: "Platyrrhini",
  cercopithecidae: "Cercopithecidae",
  hominidae: "Hominidae (great apes)",
};
const BACKBONE = t.inkSoft;

// --- Collect elbow segments (horizontal branch + vertical connector) ------
const segments = [];
const leaves = [];
function collect(node, parentX, inheritedColor) {
  const color = node.clade ? cladeColors[node.clade] : inheritedColor;
  const isLeaf = !node.children;
  segments.push({
    points: [
      { x: parentX, y: node.y },
      { x: node.x, y: node.y },
    ],
    color,
    leaf: isLeaf,
  });
  if (isLeaf) {
    leaves.push({ name: node.name, y: node.y, color });
    return;
  }
  const ys = node.children.map((c) => c.y);
  segments.push({
    points: [
      { x: node.x, y: Math.min(...ys) },
      { x: node.x, y: Math.max(...ys) },
    ],
    color,
    leaf: false,
  });
  node.children.forEach((c) => collect(c, node.x, color));
}
const rootYs = tree.children.map((c) => c.y);
segments.push({
  points: [
    { x: tree.x, y: Math.min(...rootYs) },
    { x: tree.x, y: Math.max(...rootYs) },
  ],
  color: BACKBONE,
  leaf: false,
});
tree.children.forEach((c) => collect(c, tree.x, BACKBONE));

// --- Mount -------------------------------------------------------------
document.getElementById("container").style.background = t.pageBg;
const canvas = document.createElement("canvas");
document.getElementById("container").appendChild(canvas);

// --- Chart ---------------------------------------------------------------
const TITLE = "tree-phylogenetic · javascript · chartjs · anyplot.ai";
const SUBTITLE =
  "Branch & label color marks family-level clades — see legend below";

new Chart(canvas, {
  type: "scatter",
  data: {
    datasets: segments.map((s) => ({
      data: s.points,
      showLine: true,
      borderColor: s.color,
      borderWidth: s.leaf ? 3 : 2.5,
      pointRadius: s.leaf ? [0, 5] : 0,
      pointBackgroundColor: s.color,
      pointBorderColor: t.pageBg,
      pointBorderWidth: 1.5,
      fill: false,
      tension: 0,
    })),
  },
  options: {
    responsive: true,
    maintainAspectRatio: false,
    animation: false,
    plugins: {
      title: {
        display: true,
        text: TITLE,
        color: t.ink,
        font: { size: 22, weight: "500" },
        padding: { top: 20, bottom: 8 },
      },
      subtitle: {
        display: true,
        text: SUBTITLE,
        color: t.inkSoft,
        font: { size: 14, style: "italic" },
        padding: { bottom: 18 },
      },
      legend: {
        display: true,
        position: "bottom",
        onClick: () => {},
        labels: {
          generateLabels: () =>
            Object.keys(cladeColors).map((key) => ({
              text: cladeNames[key],
              fillStyle: cladeColors[key],
              strokeStyle: cladeColors[key],
              lineWidth: 0,
              pointStyle: "circle",
            })),
          color: t.ink,
          font: { size: 14 },
          usePointStyle: true,
          boxWidth: 10,
          boxHeight: 10,
          padding: 20,
        },
      },
    },
    scales: {
      x: {
        type: "linear",
        min: -0.3,
        max: maxXTick + 0.3,
        border: { color: t.inkSoft },
        grid: { color: t.grid },
        title: {
          display: true,
          text: "Relative evolutionary distance",
          color: t.ink,
          font: { size: 16 },
        },
        afterBuildTicks: (axis) => {
          axis.ticks = Array.from({ length: maxXTick + 1 }, (_, i) => ({
            value: i,
          }));
        },
        ticks: { color: t.inkSoft, font: { size: 14 } },
      },
      y: {
        type: "linear",
        position: "right",
        reverse: true,
        min: -0.7,
        max: n - 1 + 0.7,
        grid: { display: false },
        border: { display: false },
        afterBuildTicks: (axis) => {
          axis.ticks = Array.from({ length: n }, (_, i) => ({ value: i }));
        },
        ticks: {
          color: (ctx) => {
            const idx = Math.round(ctx.tick.value);
            return leaves[idx] ? leaves[idx].color : t.inkSoft;
          },
          font: { size: 14, weight: "500" },
          padding: 8,
          callback: (value) => {
            const idx = Math.round(value);
            return leaves[idx] ? leaves[idx].name : "";
          },
        },
      },
    },
  },
});
Runnable source as JSON, for any HTTP client: https://api.anyplot.ai/specs/tree-phylogenetic/chartjs/code. Any spec id and library id listed in llms-full.txt fit the same URL shape; every URL below is complete and callable.
{
  "spec_id": "tree-phylogenetic",
  "language": "javascript",
  "library": "chartjs",
  "page": "https://anyplot.ai/tree-phylogenetic/javascript/chartjs",
  "hub": "https://anyplot.ai/tree-phylogenetic",
  "code_json": "https://api.anyplot.ai/specs/tree-phylogenetic/chartjs/code",
  "spec_json": "https://api.anyplot.ai/specs/tree-phylogenetic",
  "render_light_png": "https://storage.googleapis.com/anyplot-images/plots/tree-phylogenetic/javascript/chartjs/plot-light.png",
  "render_dark_png": "https://storage.googleapis.com/anyplot-images/plots/tree-phylogenetic/javascript/chartjs/plot-dark.png",
  "interactive_light_html": "https://storage.googleapis.com/anyplot-images/plots/tree-phylogenetic/javascript/chartjs/plot-light.html",
  "interactive_dark_html": "https://storage.googleapis.com/anyplot-images/plots/tree-phylogenetic/javascript/chartjs/plot-dark.html",
  "quality_score": 91.0,
  "license": "MIT",
  "guide": "https://anyplot.ai/llms.txt"
}
Part of Phylogenetic Tree Diagram on anyplot.ai.