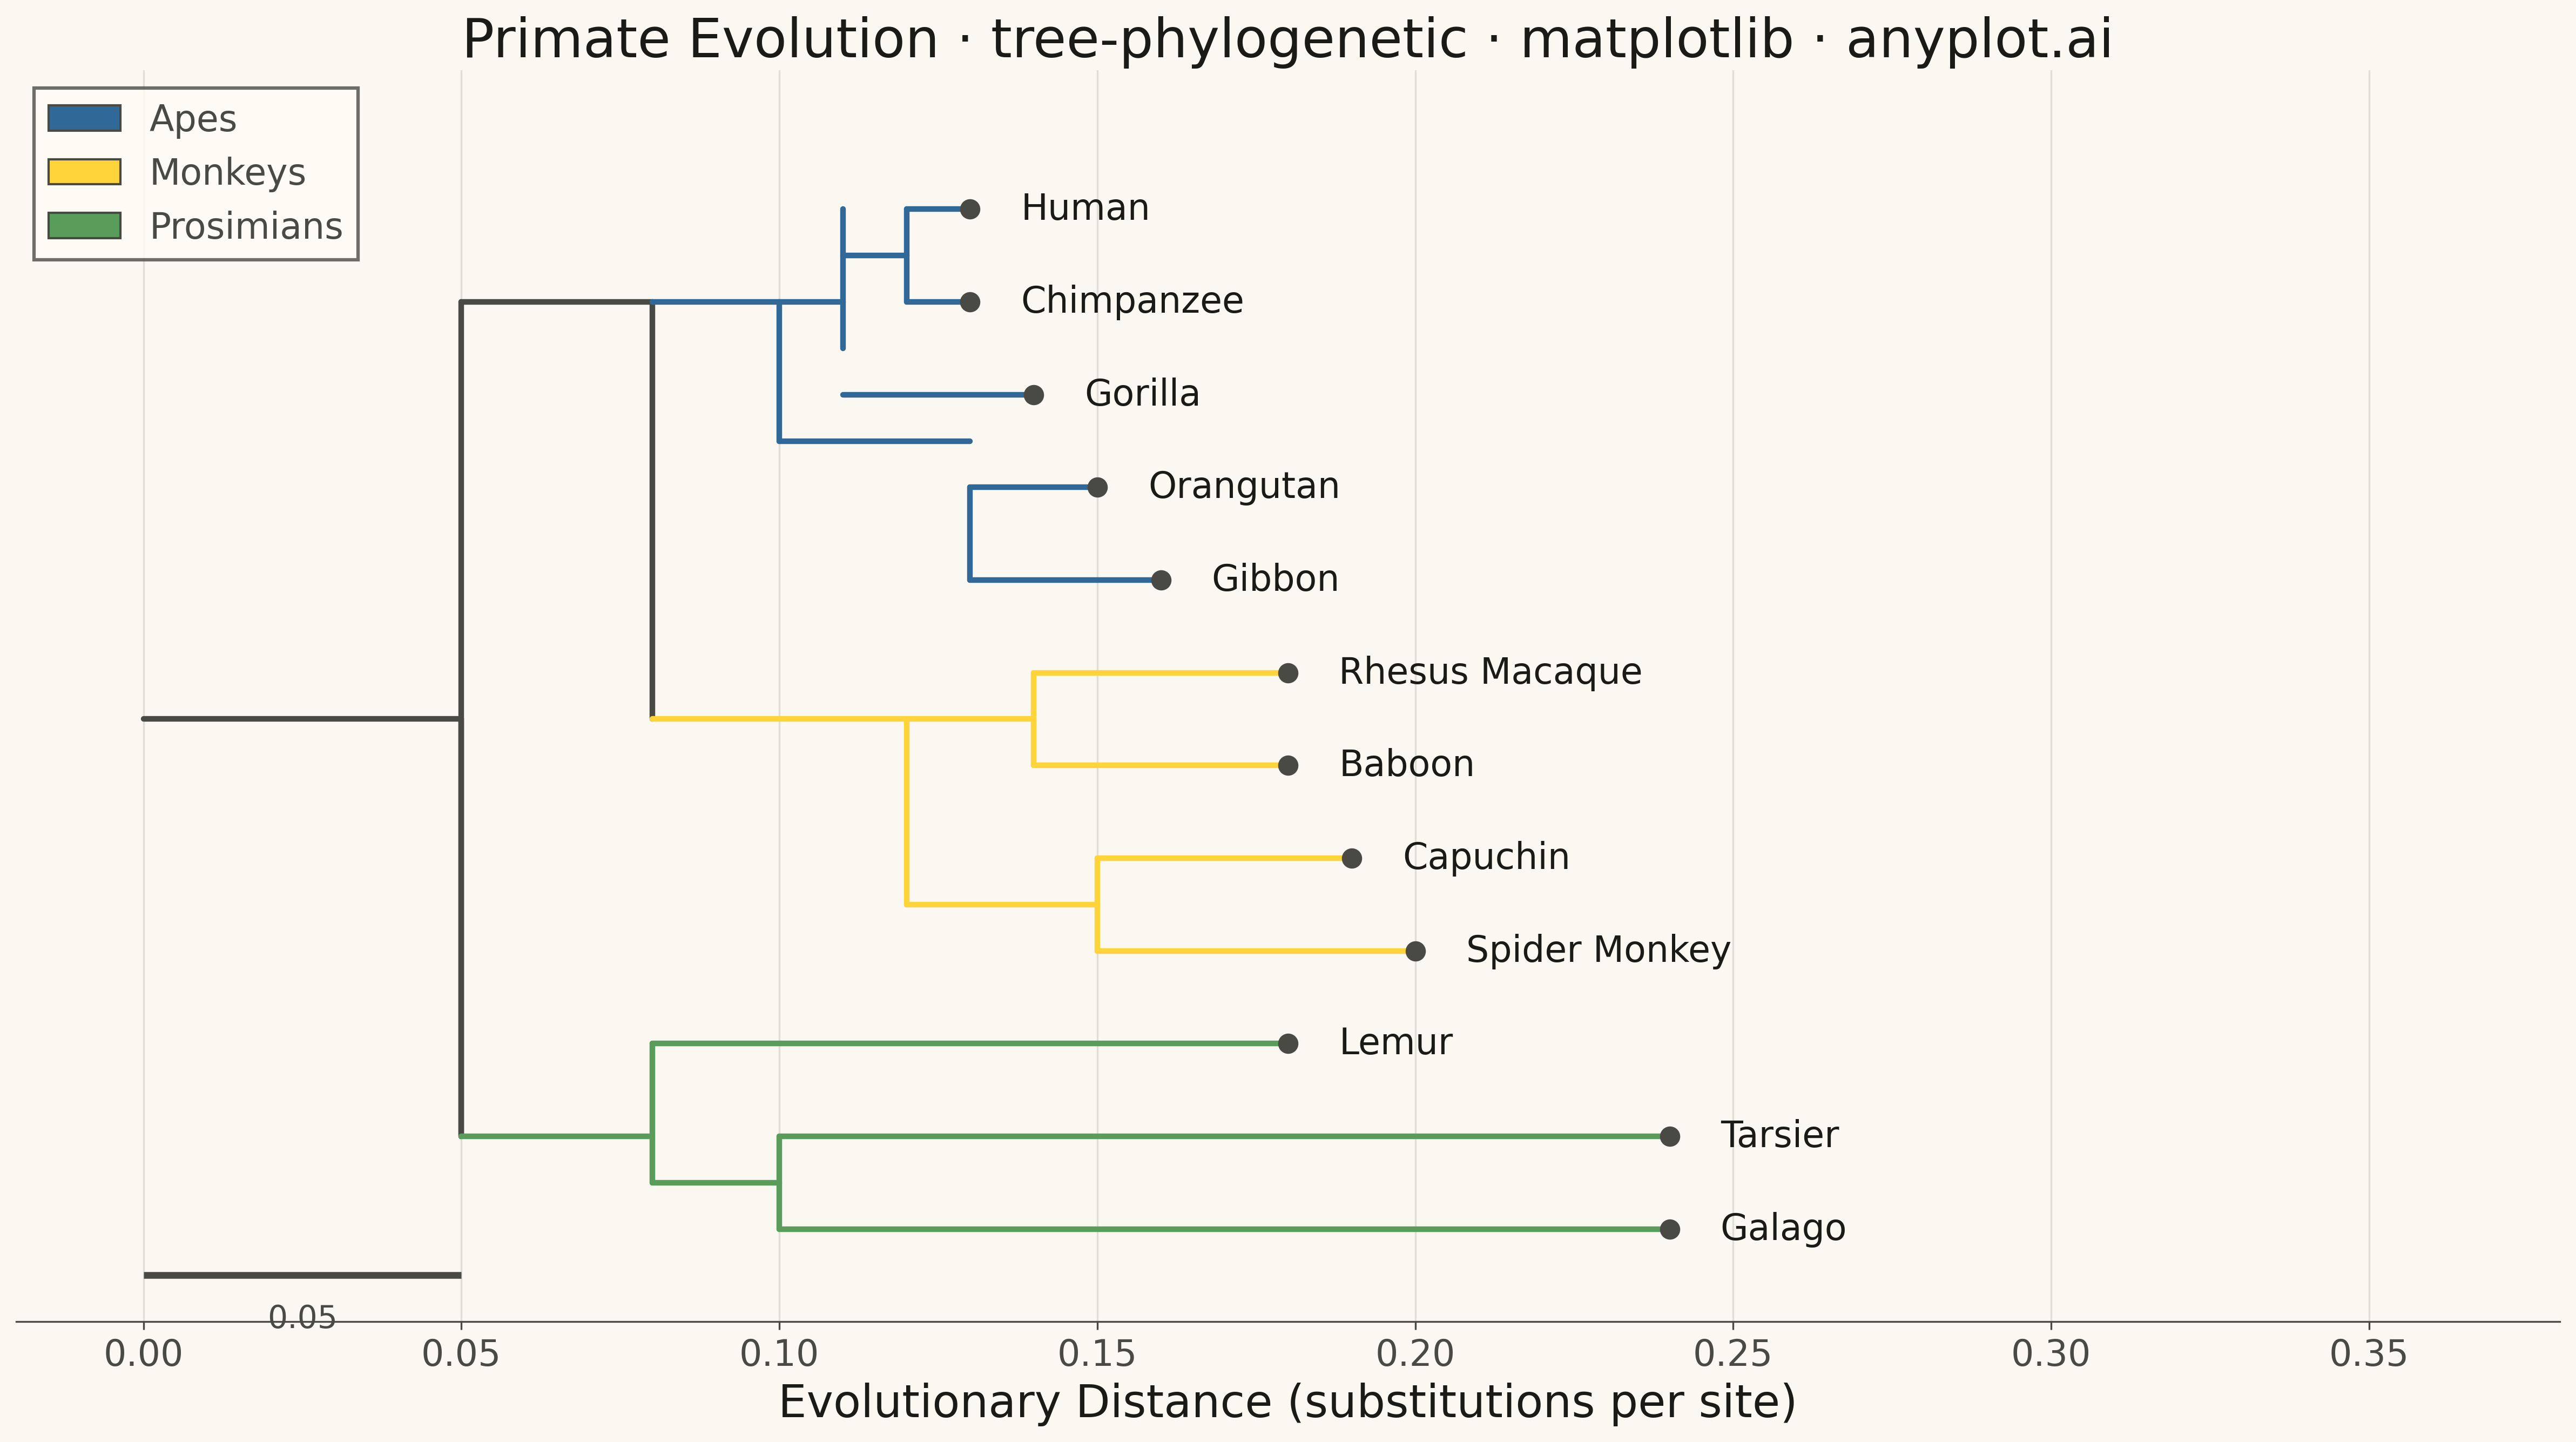
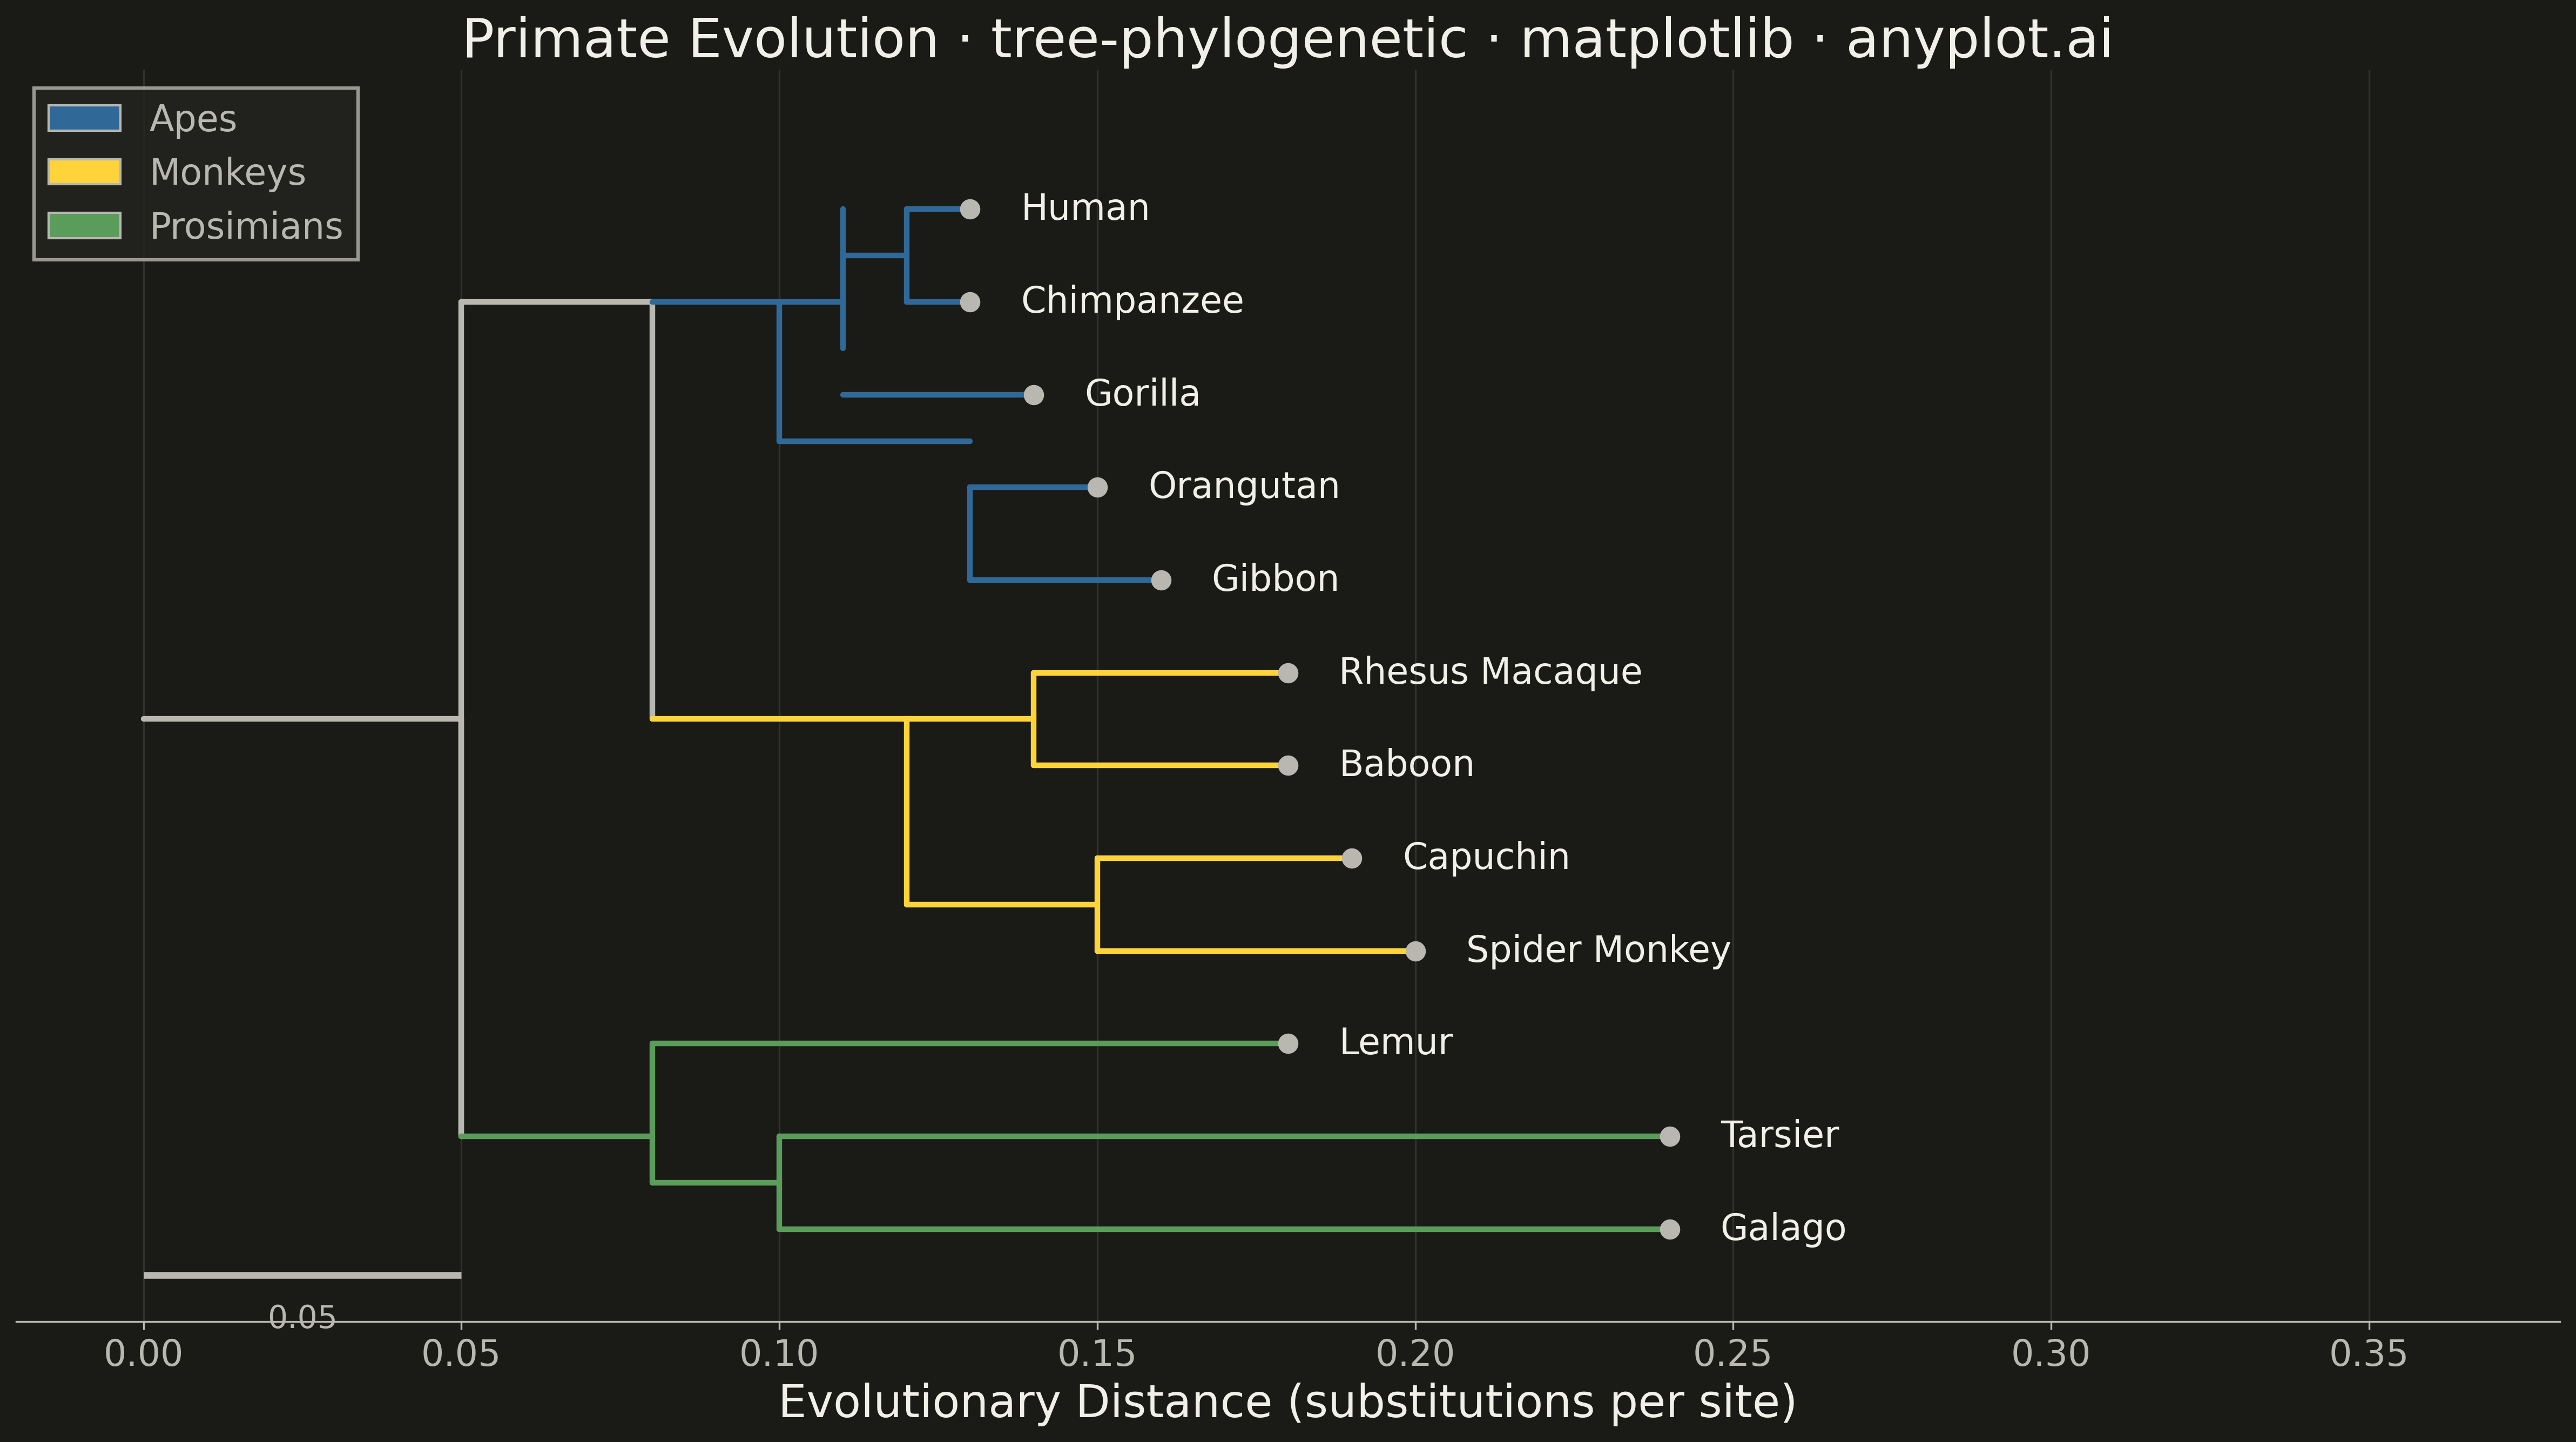
A phylogenetic tree (evolutionary tree) visualization showing hierarchical relationships between species or sequences, with branch lengths proportional to evolutionary distance. This diagram reveals how organisms or genes evolved from common ancestors, with longer branches indicating greater divergence. Phylogenetic trees are essential for understanding evolutionary history, taxonomy, and molecular biology relationships.
""" anyplot.ai
tree-phylogenetic: Phylogenetic Tree Diagram
Library: matplotlib 3.10.9 | Python 3.13.13
Quality: 82/100 | Updated: 2026-05-15
"""

import os

import matplotlib.pyplot as plt
from matplotlib.patches import Patch


THEME = os.getenv("ANYPLOT_THEME", "light")
PAGE_BG = "#FAF8F1" if THEME == "light" else "#1A1A17"
ELEVATED_BG = "#FFFDF6" if THEME == "light" else "#242420"
INK = "#1A1A17" if THEME == "light" else "#F0EFE8"
INK_SOFT = "#4A4A44" if THEME == "light" else "#B8B7B0"

# Clade colors (excellent colorblind-safe palette - preserved from previous implementation)
APES_COLOR = "#306998"
MONKEYS_COLOR = "#FFD43B"
PROSIMIANS_COLOR = "#5A9C5A"

# Primate phylogenetic tree - pre-computed coordinates
# Each leaf: (name, y_position, x_end) where x_end is total distance from root
# Species ordered by evolutionary grouping (top to bottom)
species = [
    ("Galago", 0, 0.24),
    ("Tarsier", 1, 0.24),
    ("Lemur", 2, 0.18),
    ("Spider Monkey", 3, 0.20),
    ("Capuchin", 4, 0.19),
    ("Baboon", 5, 0.18),
    ("Rhesus Macaque", 6, 0.18),
    ("Gibbon", 7, 0.16),
    ("Orangutan", 8, 0.15),
    ("Gorilla", 9, 0.14),
    ("Chimpanzee", 10, 0.13),
    ("Human", 11, 0.13),
]

# Pre-computed branch segments for the phylogenetic tree
# Format: (x_start, y_start, x_end, y_end, color)
branches = [
    # Root split (Prosimians vs Simians)
    (0, 5.5, 0.05, 5.5, INK_SOFT),  # Root to split
    (0.05, 1, 0.05, 5.5, INK_SOFT),  # Vertical at root
    (0.05, 1, 0.05, 10, INK_SOFT),  # Vertical to Simians
    # Prosimians clade
    (0.05, 1, 0.08, 1, PROSIMIANS_COLOR),  # To Prosimians node
    (0.08, 0.5, 0.08, 2, PROSIMIANS_COLOR),  # Prosimians vertical
    (0.08, 0.5, 0.10, 0.5, PROSIMIANS_COLOR),  # To Lorisoids
    (0.10, 0, 0.10, 1, PROSIMIANS_COLOR),  # Lorisoids vertical
    (0.10, 0, 0.24, 0, PROSIMIANS_COLOR),  # To Galago
    (0.10, 1, 0.24, 1, PROSIMIANS_COLOR),  # To Tarsier
    (0.08, 2, 0.18, 2, PROSIMIANS_COLOR),  # To Lemur
    # Simians main branch
    (0.05, 10, 0.08, 10, INK_SOFT),  # To Simians node
    (0.08, 5.5, 0.08, 10, INK_SOFT),  # Simians vertical
    # Apes clade
    (0.08, 10, 0.10, 10, APES_COLOR),  # To Apes
    (0.10, 8.5, 0.10, 10, APES_COLOR),  # Apes vertical
    # African Apes
    (0.10, 10, 0.11, 10, APES_COLOR),  # To African Apes
    (0.11, 9.5, 0.11, 11, APES_COLOR),  # African Apes vertical
    (0.11, 9, 0.14, 9, APES_COLOR),  # To Gorilla
    (0.11, 10.5, 0.12, 10.5, APES_COLOR),  # To Hominini
    (0.12, 10, 0.12, 11, APES_COLOR),  # Hominini vertical
    (0.12, 10, 0.13, 10, APES_COLOR),  # To Chimpanzee
    (0.12, 11, 0.13, 11, APES_COLOR),  # To Human
    # Asian Apes
    (0.10, 8.5, 0.13, 8.5, APES_COLOR),  # To Asian Apes
    (0.13, 7, 0.13, 8, APES_COLOR),  # Asian Apes vertical
    (0.13, 7, 0.16, 7, APES_COLOR),  # To Gibbon
    (0.13, 8, 0.15, 8, APES_COLOR),  # To Orangutan
    # Monkeys clade
    (0.08, 5.5, 0.12, 5.5, MONKEYS_COLOR),  # To Monkeys
    (0.12, 3.5, 0.12, 5.5, MONKEYS_COLOR),  # Monkeys vertical
    # Old World Monkeys
    (0.12, 5.5, 0.14, 5.5, MONKEYS_COLOR),  # To Old World
    (0.14, 5, 0.14, 6, MONKEYS_COLOR),  # OW vertical
    (0.14, 5, 0.18, 5, MONKEYS_COLOR),  # To Baboon
    (0.14, 6, 0.18, 6, MONKEYS_COLOR),  # To Rhesus
    # New World Monkeys
    (0.12, 3.5, 0.15, 3.5, MONKEYS_COLOR),  # To New World
    (0.15, 3, 0.15, 4, MONKEYS_COLOR),  # NW vertical
    (0.15, 3, 0.20, 3, MONKEYS_COLOR),  # To Spider Monkey
    (0.15, 4, 0.19, 4, MONKEYS_COLOR),  # To Capuchin
]

# Plot
fig, ax = plt.subplots(figsize=(16, 9), facecolor=PAGE_BG)
ax.set_facecolor(PAGE_BG)

# Draw all branches
for x1, y1, x2, y2, color in branches:
    ax.plot([x1, x2], [y1, y2], color=color, linewidth=2.5, solid_capstyle="round")

# Draw species labels
for name, y, x in species:
    ax.plot(x, y, "o", color=INK_SOFT, markersize=8)
    ax.text(x + 0.008, y, name, va="center", ha="left", fontsize=16, fontweight="medium", color=INK)

# Style
ax.set_xlabel("Evolutionary Distance (substitutions per site)", fontsize=20, color=INK)
ax.set_ylabel("")
ax.set_title(
    "Primate Evolution · tree-phylogenetic · matplotlib · anyplot.ai", fontsize=24, fontweight="medium", color=INK
)

# Set axis limits
ax.set_xlim(-0.02, 0.38)
ax.set_ylim(-1, 12.5)

# Style ticks
ax.tick_params(axis="x", labelsize=16, colors=INK_SOFT, labelcolor=INK_SOFT)
ax.tick_params(axis="y", left=False, labelleft=False)

# Add subtle grid on x-axis only
ax.grid(True, axis="x", alpha=0.15, linestyle="-", linewidth=0.8, color=INK_SOFT)

# Remove spines
ax.spines["top"].set_visible(False)
ax.spines["right"].set_visible(False)
ax.spines["left"].set_visible(False)
ax.spines["bottom"].set_color(INK_SOFT)

# Add legend explaining clade colors
legend_elements = [
    Patch(facecolor=APES_COLOR, edgecolor=INK_SOFT, label="Apes"),
    Patch(facecolor=MONKEYS_COLOR, edgecolor=INK_SOFT, label="Monkeys"),
    Patch(facecolor=PROSIMIANS_COLOR, edgecolor=INK_SOFT, label="Prosimians"),
]
leg = ax.legend(
    handles=legend_elements, loc="upper left", fontsize=16, frameon=True, fancybox=False, edgecolor=INK_SOFT
)
leg.get_frame().set_facecolor(ELEVATED_BG)
leg.get_frame().set_edgecolor(INK_SOFT)
leg.get_frame().set_linewidth(1.5)
for text in leg.get_texts():
    text.set_color(INK_SOFT)

# Add scale bar
ax.plot([0, 0.05], [-0.5, -0.5], color=INK_SOFT, linewidth=3, solid_capstyle="butt")
ax.text(0.025, -0.8, "0.05", ha="center", va="top", fontsize=14, color=INK_SOFT)

plt.tight_layout()
plt.savefig(f"plot-{THEME}.png", dpi=300, bbox_inches="tight", facecolor=PAGE_BG)
Runnable source as JSON, for any HTTP client: https://api.anyplot.ai/specs/tree-phylogenetic/matplotlib/code. Any spec id and library id listed in llms-full.txt fit the same URL shape; every URL below is complete and callable.
{
  "spec_id": "tree-phylogenetic",
  "language": "python",
  "library": "matplotlib",
  "page": "https://anyplot.ai/tree-phylogenetic/python/matplotlib",
  "hub": "https://anyplot.ai/tree-phylogenetic",
  "code_json": "https://api.anyplot.ai/specs/tree-phylogenetic/matplotlib/code",
  "spec_json": "https://api.anyplot.ai/specs/tree-phylogenetic",
  "render_light_png": "https://storage.googleapis.com/anyplot-images/plots/tree-phylogenetic/python/matplotlib/plot-light.png",
  "render_dark_png": "https://storage.googleapis.com/anyplot-images/plots/tree-phylogenetic/python/matplotlib/plot-dark.png",
  "quality_score": 82.0,
  "license": "MIT",
  "guide": "https://anyplot.ai/llms.txt"
}
Part of Phylogenetic Tree Diagram on anyplot.ai.