The same plot in 14 other libraries — JavaScript: Chart.js, D3.js, Apache ECharts, MUI X Charts; Python: Altair, Bokeh, lets-plot, Matplotlib, Plotly, plotnine, Pygal, Seaborn; R: ggplot2; Julia: Makie.jl. Compare all 15 side by side: Phylogenetic Tree Diagram in Python, R, Julia and JavaScript.
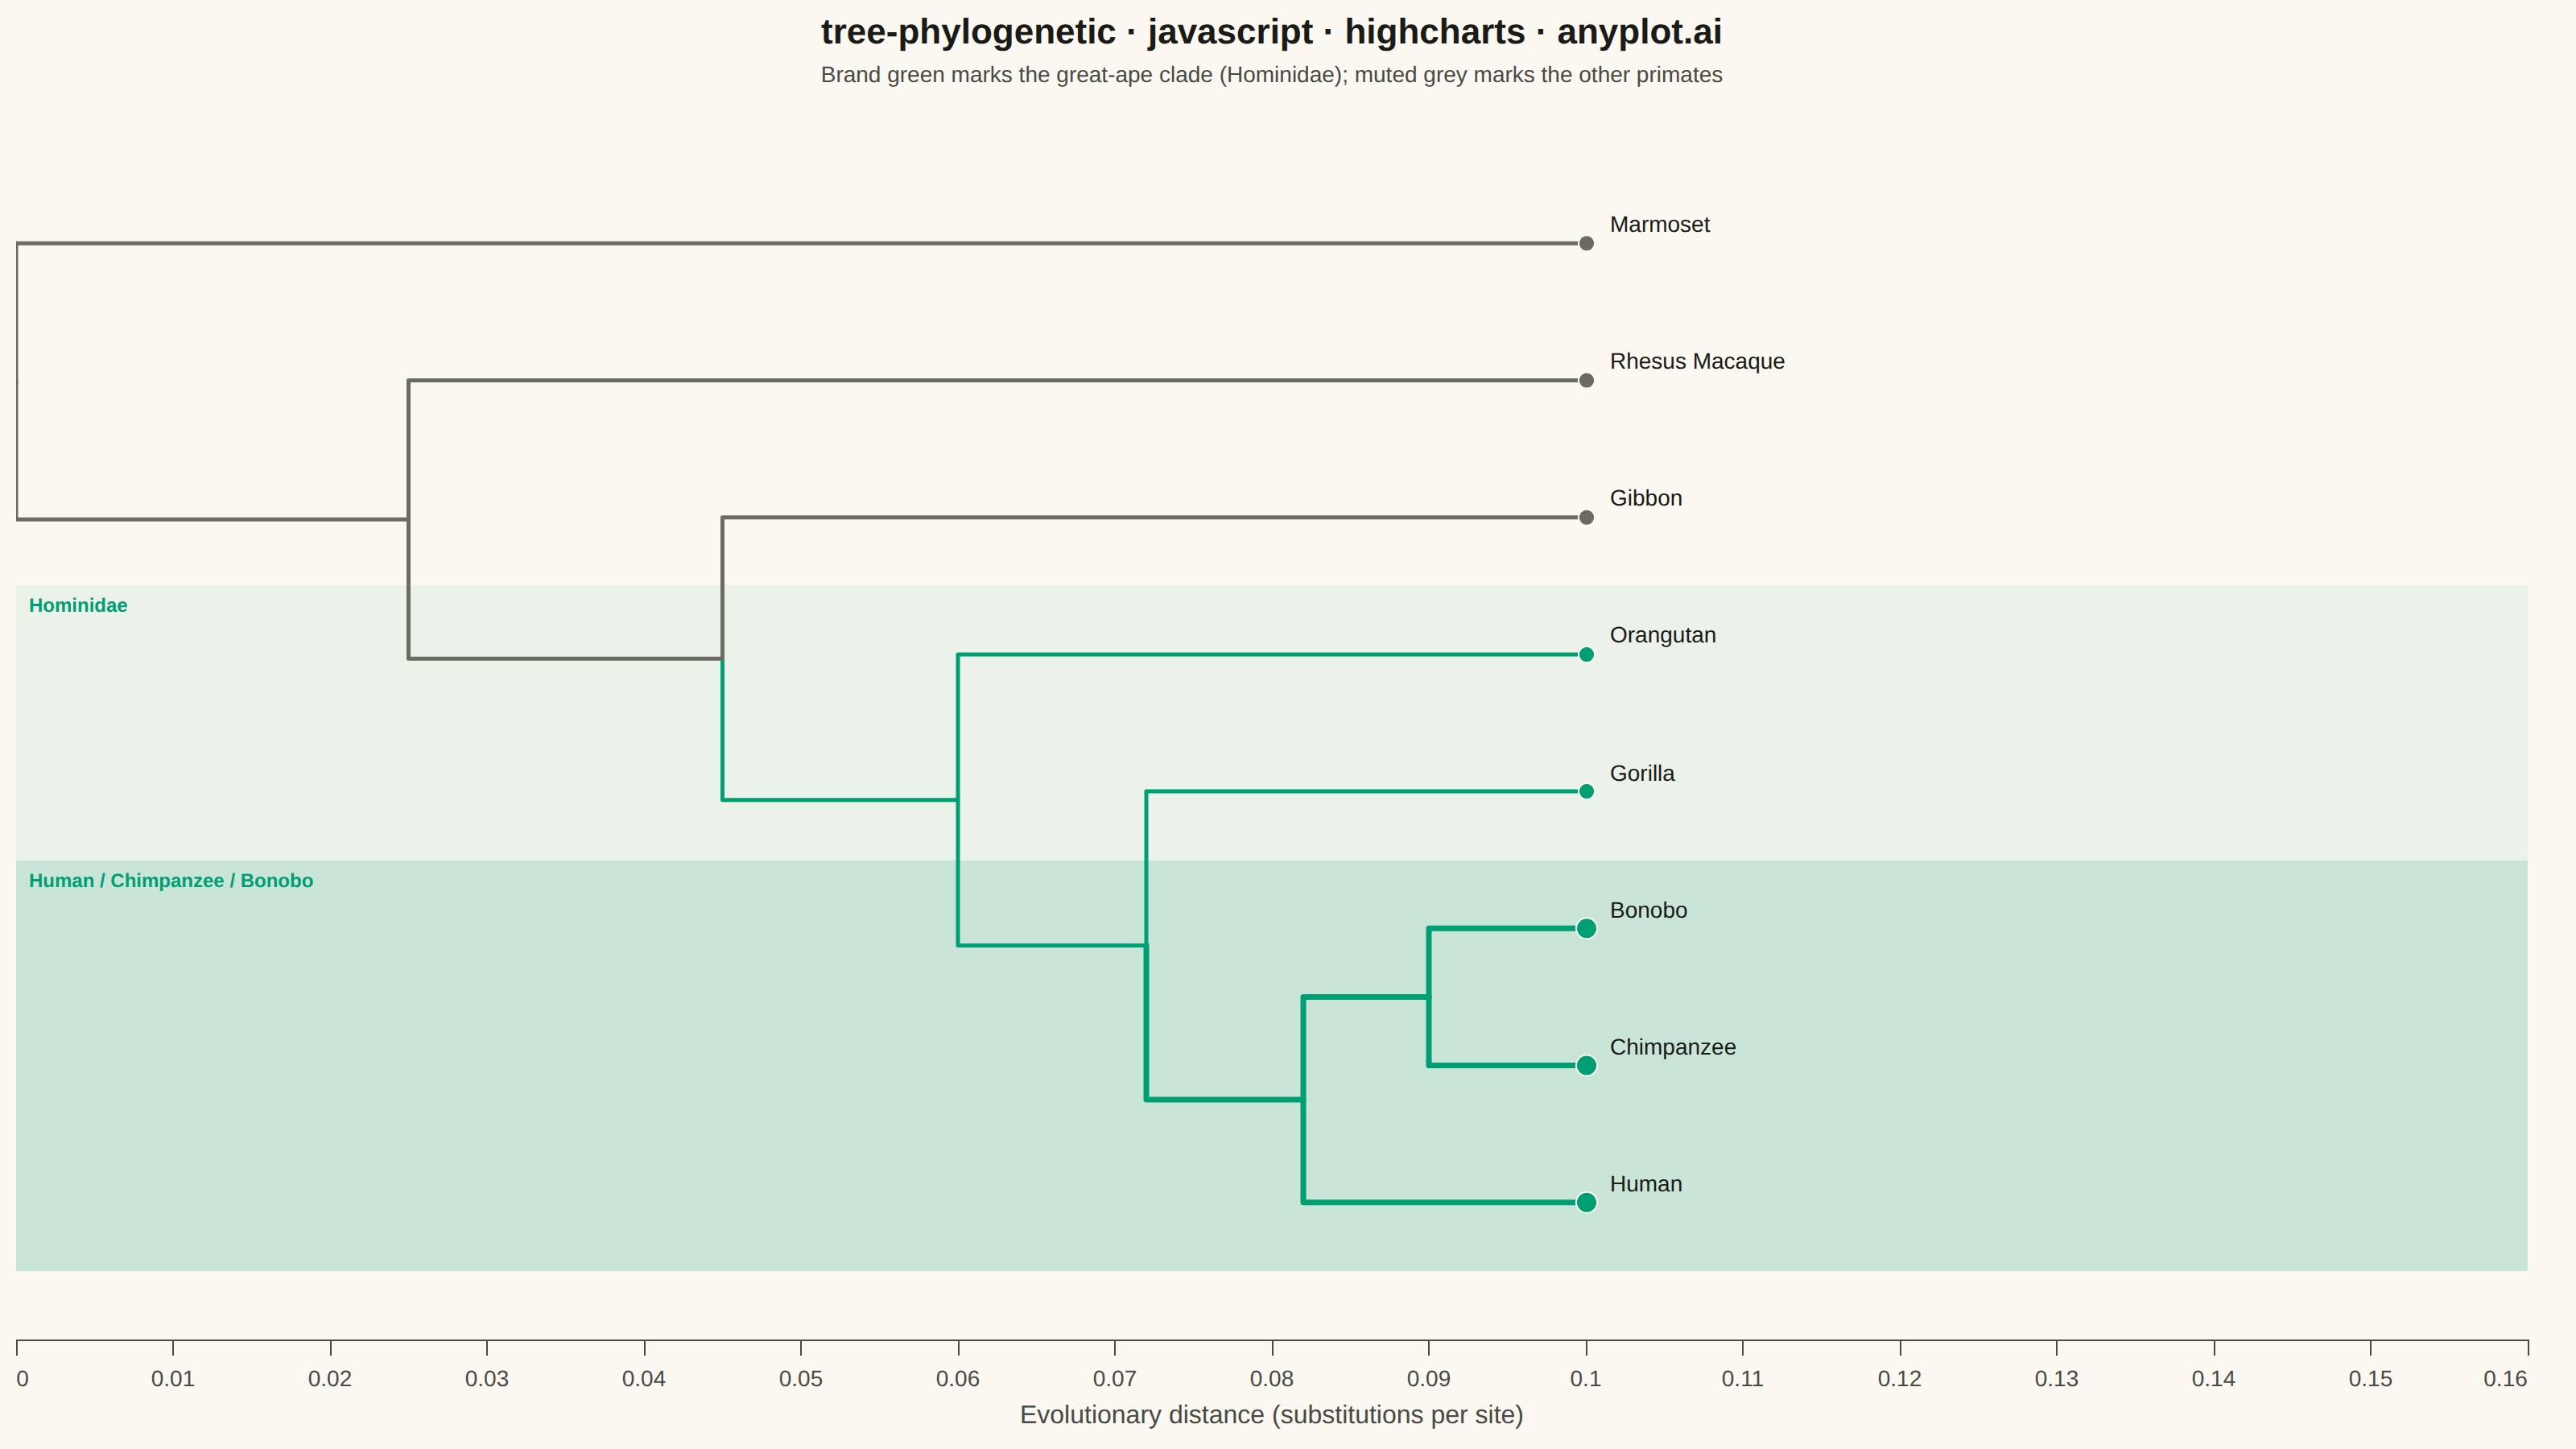
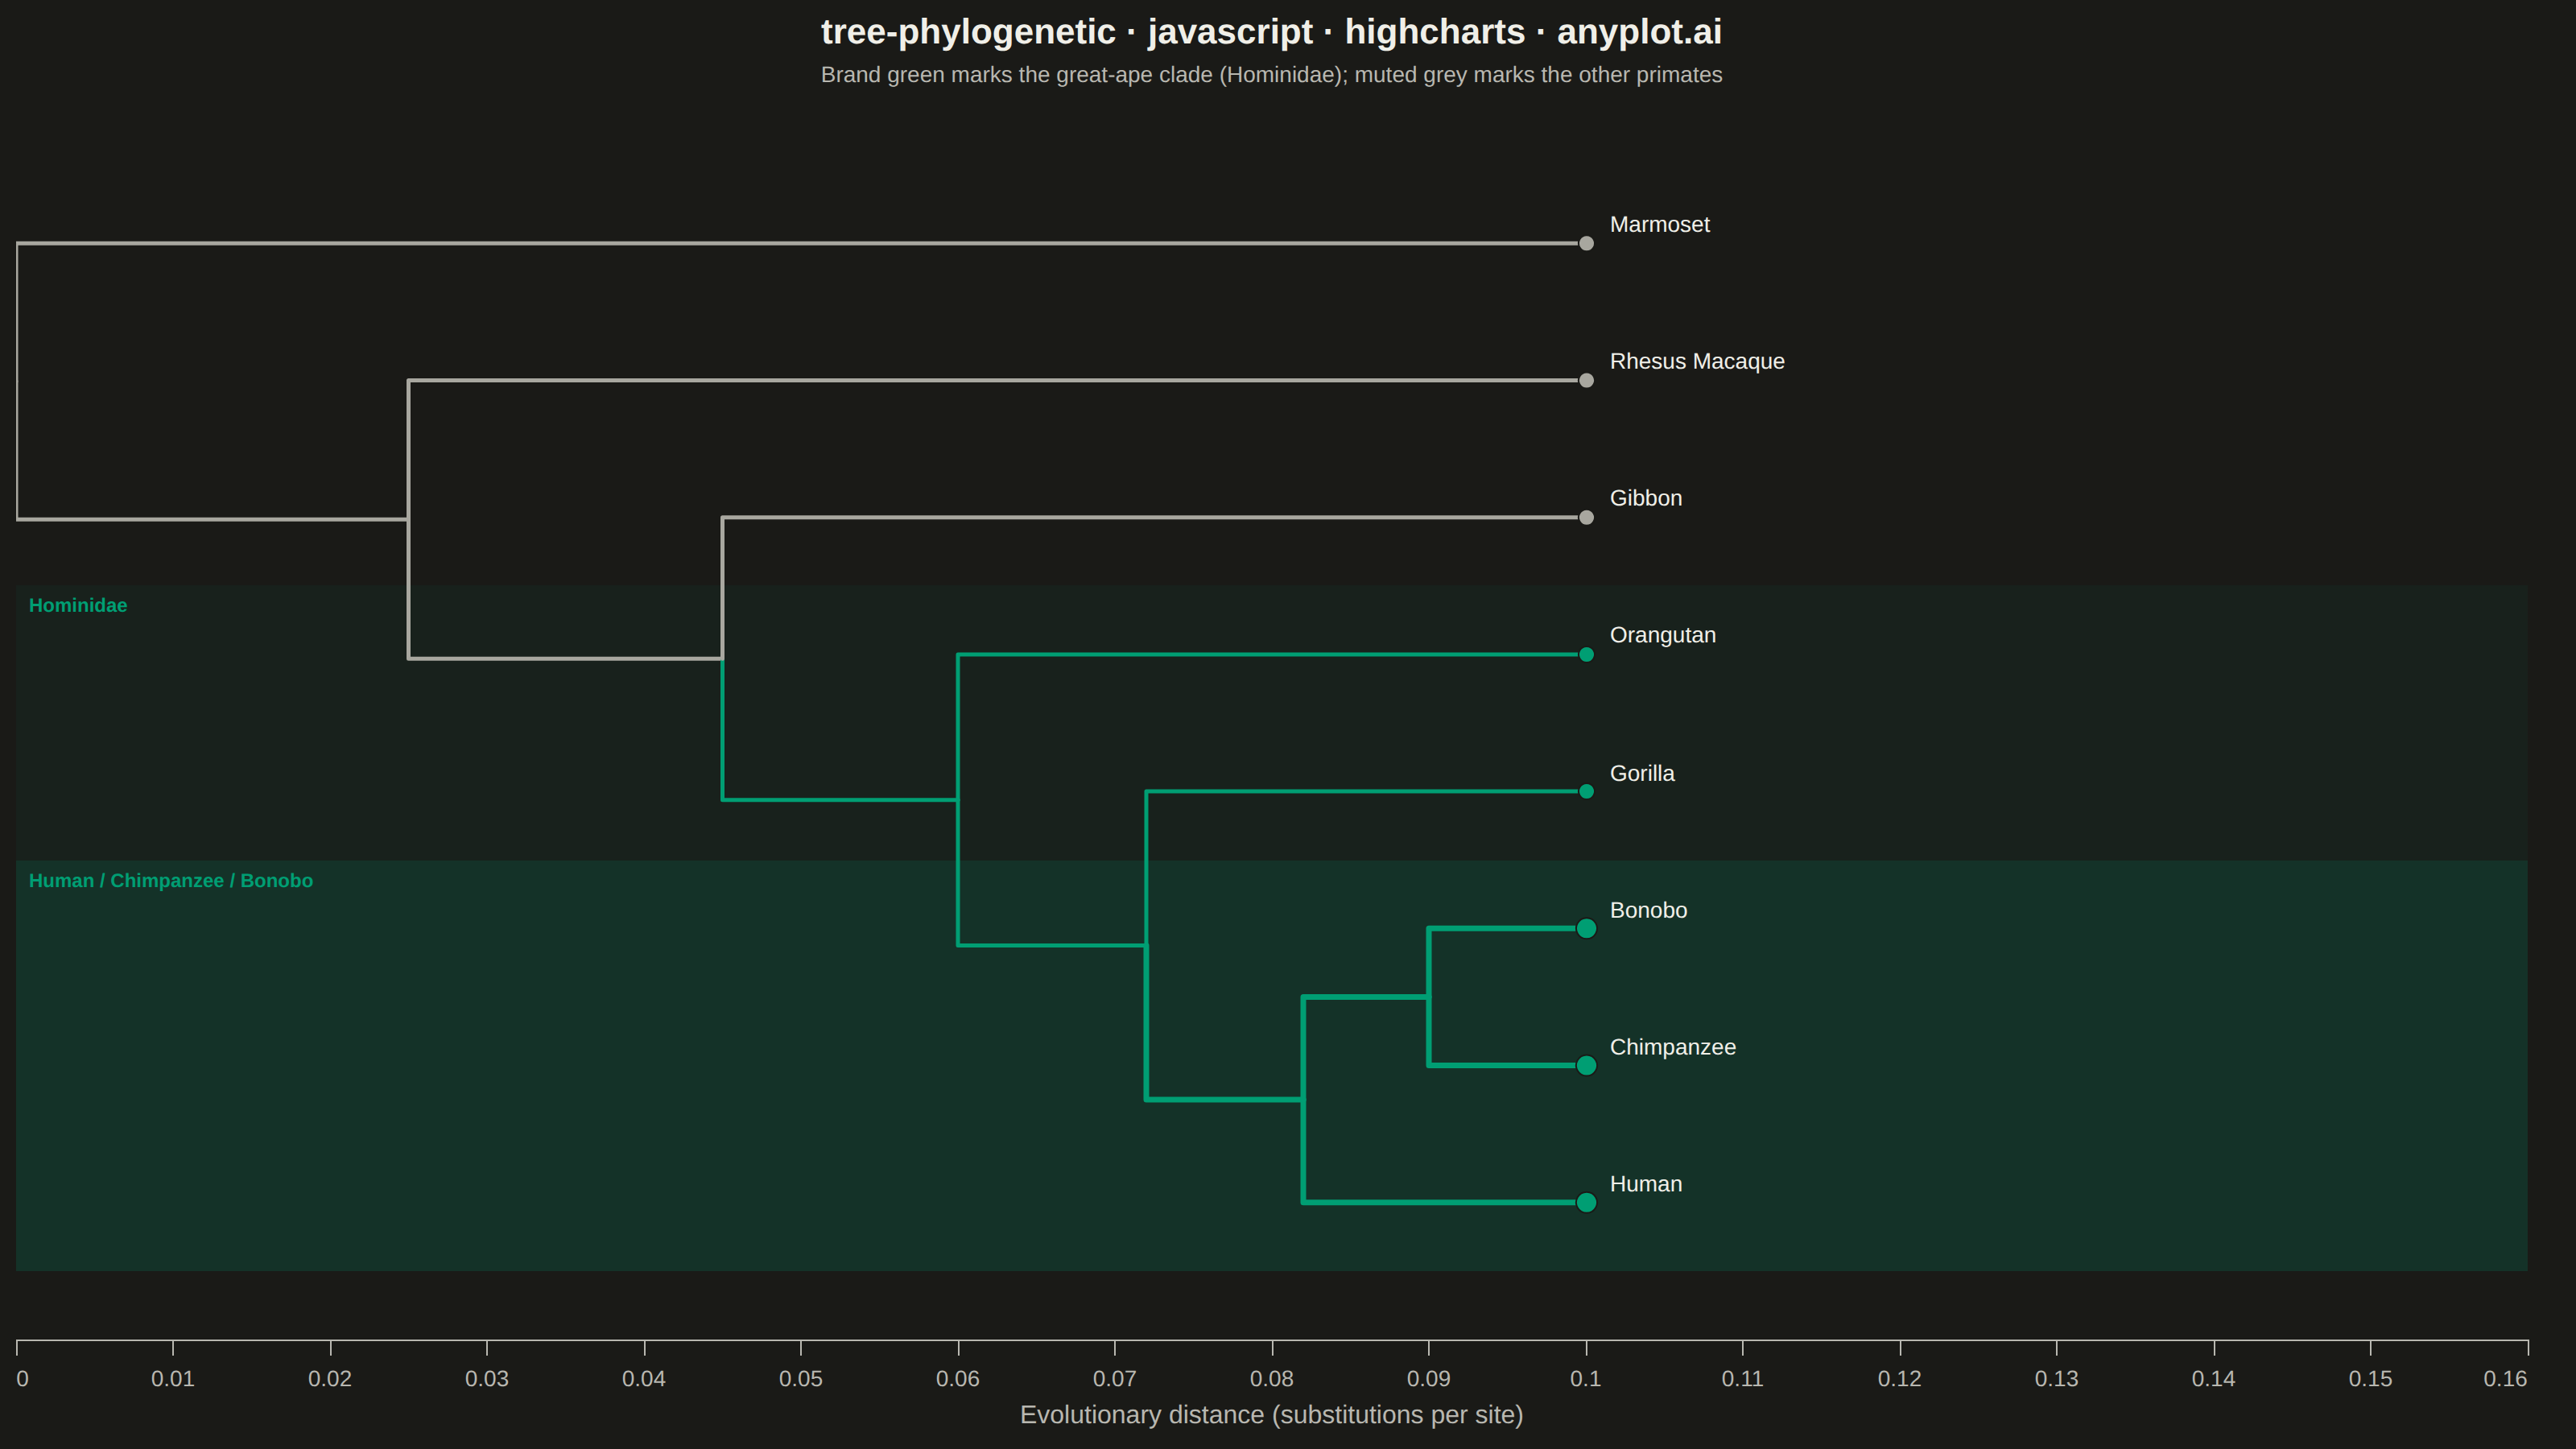
A phylogenetic tree (evolutionary tree) visualization showing hierarchical relationships between species or sequences, with branch lengths proportional to evolutionary distance. This diagram reveals how organisms or genes evolved from common ancestors, with longer branches indicating greater divergence. Phylogenetic trees are essential for understanding evolutionary history, taxonomy, and molecular biology relationships.
// anyplot.ai
// tree-phylogenetic: Phylogenetic Tree Diagram
// Library: highcharts 12.6.0 | JavaScript 22.23.2
// Quality: 93/100 | Created: 2026-09-09

const t = window.ANYPLOT_TOKENS;

// --- Data --------------------------------------------------------------------
// Simplified primate phylogeny (mitochondrial DNA), ultrametric so every tip
// lands at the same evolutionary distance from the root. Each node carries its
// cumulative x (substitutions per site from the root); the "hominid" flag
// marks the great-ape clade (Hominidae) for the color highlight, and the
// "innerClade" flag marks the tighter Human/Chimp/Bonobo split (Hominini) for
// a second, bolder layer of emphasis nested inside it.
const tree = {
  name: "Anthropoidea",
  x: 0,
  children: [
    {
      name: "Catarrhini",
      x: 0.025,
      children: [
        {
          name: "Hominoidea",
          x: 0.045,
          children: [
            {
              name: "Hominidae",
              x: 0.06,
              hominid: true,
              children: [
                {
                  name: "Homininae",
                  x: 0.072,
                  children: [
                    {
                      name: "Hominini",
                      x: 0.082,
                      innerClade: true,
                      children: [
                        { name: "Human", x: 0.1 },
                        {
                          name: "Pan",
                          x: 0.09,
                          children: [
                            { name: "Chimpanzee", x: 0.1 },
                            { name: "Bonobo", x: 0.1 },
                          ],
                        },
                      ],
                    },
                    { name: "Gorilla", x: 0.1 },
                  ],
                },
                { name: "Orangutan", x: 0.1 },
              ],
            },
            { name: "Gibbon", x: 0.1 },
          ],
        },
        { name: "Rhesus Macaque", x: 0.1 },
      ],
    },
    { name: "Marmoset", x: 0.1 },
  ],
};

// --- Layout ------------------------------------------------------------------
// y = leaf order (assigned depth-first), internal nodes take the midpoint of
// their children's y. x is already fixed above (evolutionary distance).
let nextY = 0;
const assignY = (node) => {
  if (!node.children) {
    node.y = nextY;
    nextY += 1;
    return node.y;
  }
  const ys = node.children.map(assignY);
  node.y = (ys[0] + ys[ys.length - 1]) / 2;
  return node.y;
};
assignY(tree);

const branches = [];
const leaves = [];
const collect = (node, inheritedClade, inheritedInner) => {
  const clade = node.hominid ? "hominid" : inheritedClade;
  const inner = inheritedInner || Boolean(node.innerClade);
  if (node.children) {
    node.children.forEach((child) => {
      const childClade = child.hominid ? "hominid" : clade;
      const childInner = inner || Boolean(child.innerClade);
      branches.push({
        clade: childClade,
        inner: childInner,
        points: [
          [node.x, node.y],
          [node.x, child.y],
          [child.x, child.y],
        ],
      });
      collect(child, clade, inner);
    });
  } else {
    leaves.push({ x: node.x, y: node.y, name: node.name, clade, inner });
  }
};
collect(tree, "other", false);

// Hominini leaves (Human/Chimpanzee/Bonobo) sit at the low end of the y-axis;
// used to place the in-plot clade labels below.
const innerLeafYs = leaves.filter((leaf) => leaf.inner).map((leaf) => leaf.y);
const hominidLeafYs = leaves.filter((leaf) => leaf.clade === "hominid").map((leaf) => leaf.y);

// The JS harness tokens don't expose the "muted" semantic anchor — apply it
// directly from the style guide (theme-adaptive: #6B6A63 light / #A8A79F dark).
const MUTED = t.theme === "dark" ? "#A8A79F" : "#6B6A63";
const cladeColor = { hominid: t.palette[0], other: MUTED };

// --- Chart -------------------------------------------------------------------
const branchSeries = branches.map((branch) => ({
  type: "line",
  data: branch.points,
  color: cladeColor[branch.clade],
  lineWidth: branch.inner ? 3.5 : 2.5,
  marker: { enabled: false },
  enableMouseTracking: false,
  showInLegend: false,
}));

const leafSeries = {
  type: "scatter",
  name: "Species",
  data: leaves.map((leaf) => ({
    x: leaf.x,
    y: leaf.y,
    name: leaf.name,
    color: cladeColor[leaf.clade],
    marker: { radius: leaf.inner ? 6.5 : 5 },
  })),
  marker: { radius: 5, symbol: "circle", lineColor: t.pageBg, lineWidth: 1 },
  dataLabels: {
    enabled: true,
    format: "{point.name}",
    align: "left",
    x: 10,
    crop: false,
    overflow: "allow",
    style: { color: t.ink, fontSize: "14px", fontWeight: "500", textOutline: "none" },
  },
  tooltip: {
    pointFormat: "<b>{point.name}</b><br/>Distance from root: {point.x}",
  },
  showInLegend: false,
};

Highcharts.chart("container", {
  chart: {
    type: "line",
    backgroundColor: "transparent",
    animation: false,
    style: { fontFamily: "inherit" },
    spacingRight: 30,
  },
  credits: { enabled: false },
  colors: t.palette,
  title: {
    text: "tree-phylogenetic · javascript · highcharts · anyplot.ai",
    style: { color: t.ink, fontSize: "22px", fontWeight: "600" },
  },
  subtitle: {
    text: "Brand green marks the great-ape clade (Hominidae); muted grey marks the other primates",
    style: { color: t.inkSoft, fontSize: "14px" },
  },
  xAxis: {
    min: 0,
    max: 0.16,
    title: {
      text: "Evolutionary distance (substitutions per site)",
      style: { color: t.inkSoft, fontSize: "16px" },
    },
    lineColor: t.inkSoft,
    tickColor: t.inkSoft,
    gridLineWidth: 0,
    labels: { style: { color: t.inkSoft, fontSize: "14px" } },
  },
  yAxis: {
    min: -0.8,
    max: nextY - 0.2,
    title: null,
    labels: { enabled: false },
    gridLineWidth: 0,
    lineWidth: 0,
    tickLength: 0,
    // In-plot clade callouts (core plotBands, no add-on module) so the
    // clade highlight reads without relying solely on the subtitle text,
    // and so the tighter Hominini split shows as a nested second layer.
    plotBands: [
      {
        from: Math.min(...hominidLeafYs) - 0.5,
        to: Math.max(...hominidLeafYs) + 0.5,
        color: Highcharts.color(t.palette[0]).setOpacity(0.06).get(),
        label: {
          text: "Hominidae",
          align: "left",
          x: 8,
          verticalAlign: "top",
          y: 16,
          style: { color: t.palette[0], fontSize: "12px", fontWeight: "600" },
        },
      },
      {
        from: Math.min(...innerLeafYs) - 0.5,
        to: Math.max(...innerLeafYs) + 0.5,
        color: Highcharts.color(t.palette[0]).setOpacity(0.14).get(),
        label: {
          text: "Human / Chimpanzee / Bonobo",
          align: "left",
          x: 8,
          verticalAlign: "top",
          y: 16,
          style: { color: t.palette[0], fontSize: "12px", fontWeight: "600" },
        },
      },
    ],
  },
  legend: { enabled: false },
  tooltip: { enabled: true },
  plotOptions: { series: { animation: false } },
  series: [...branchSeries, leafSeries],
});
Runnable source as JSON, for any HTTP client: https://api.anyplot.ai/specs/tree-phylogenetic/highcharts/code. Any spec id and library id listed in llms-full.txt fit the same URL shape; every URL below is complete and callable.
{
  "spec_id": "tree-phylogenetic",
  "language": "javascript",
  "library": "highcharts",
  "page": "https://anyplot.ai/tree-phylogenetic/javascript/highcharts",
  "hub": "https://anyplot.ai/tree-phylogenetic",
  "code_json": "https://api.anyplot.ai/specs/tree-phylogenetic/highcharts/code",
  "spec_json": "https://api.anyplot.ai/specs/tree-phylogenetic",
  "render_light_png": "https://storage.googleapis.com/anyplot-images/plots/tree-phylogenetic/javascript/highcharts/plot-light.png",
  "render_dark_png": "https://storage.googleapis.com/anyplot-images/plots/tree-phylogenetic/javascript/highcharts/plot-dark.png",
  "interactive_light_html": "https://storage.googleapis.com/anyplot-images/plots/tree-phylogenetic/javascript/highcharts/plot-light.html",
  "interactive_dark_html": "https://storage.googleapis.com/anyplot-images/plots/tree-phylogenetic/javascript/highcharts/plot-dark.html",
  "quality_score": 93.0,
  "license": "MIT",
  "guide": "https://anyplot.ai/llms.txt"
}
Part of Phylogenetic Tree Diagram on anyplot.ai.