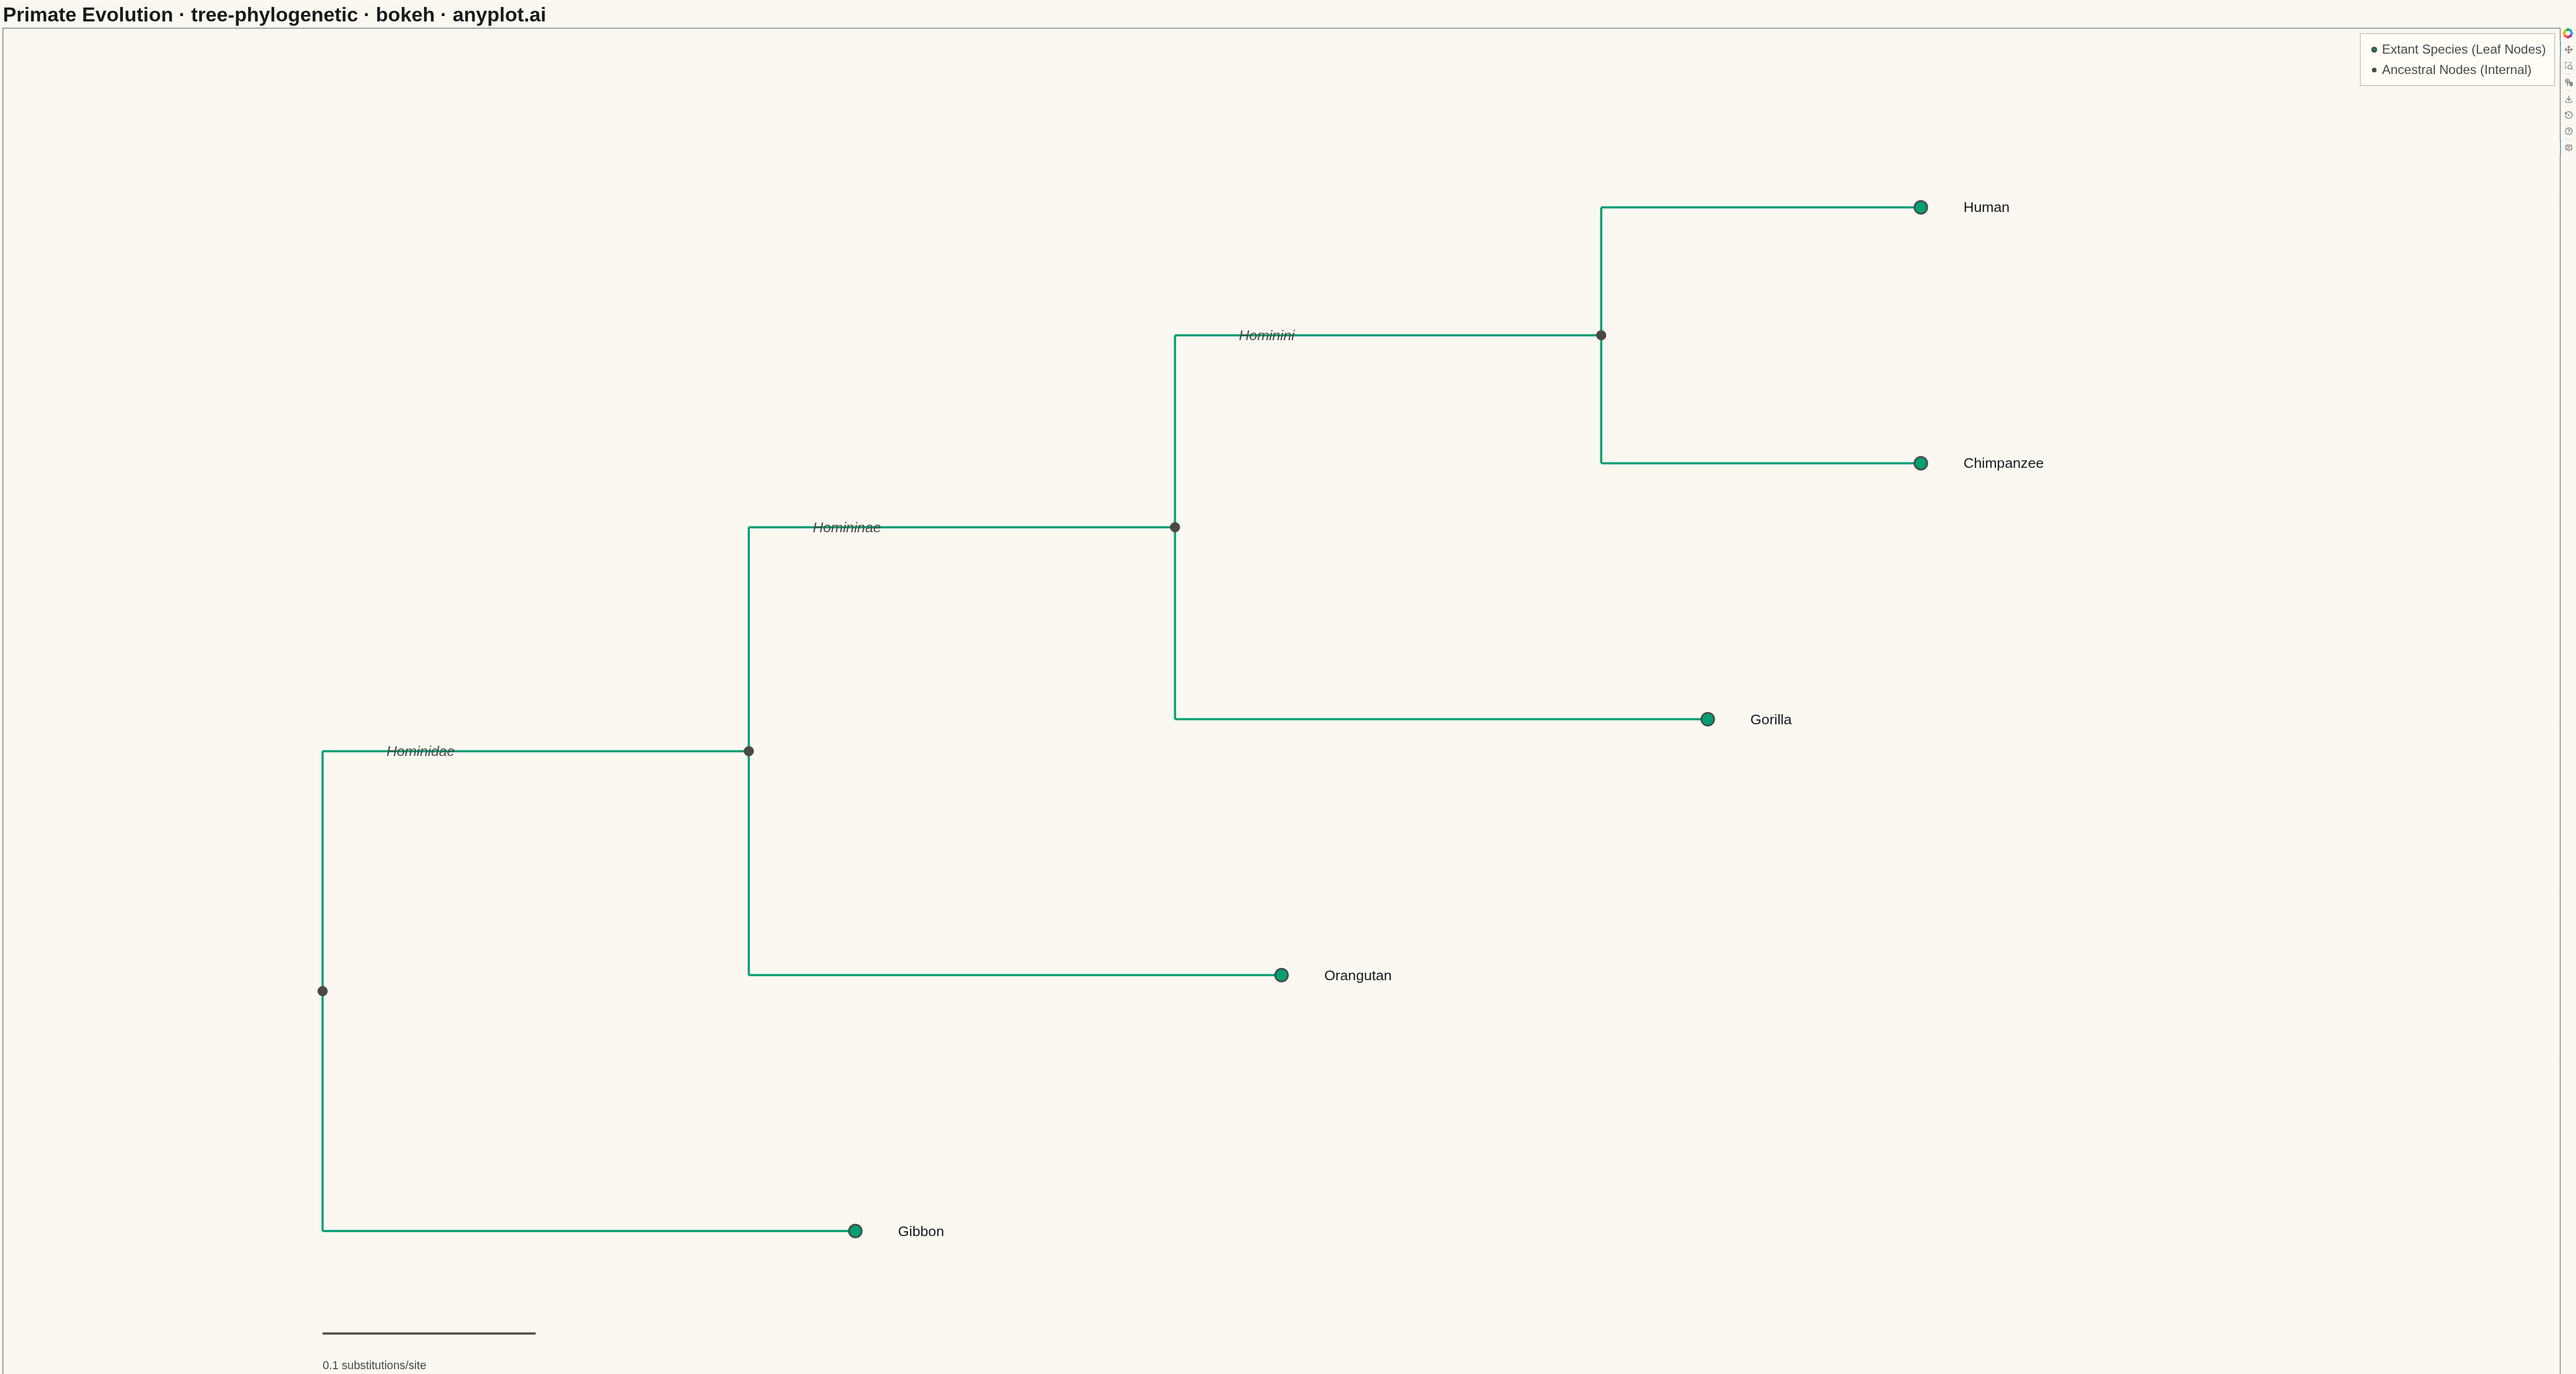
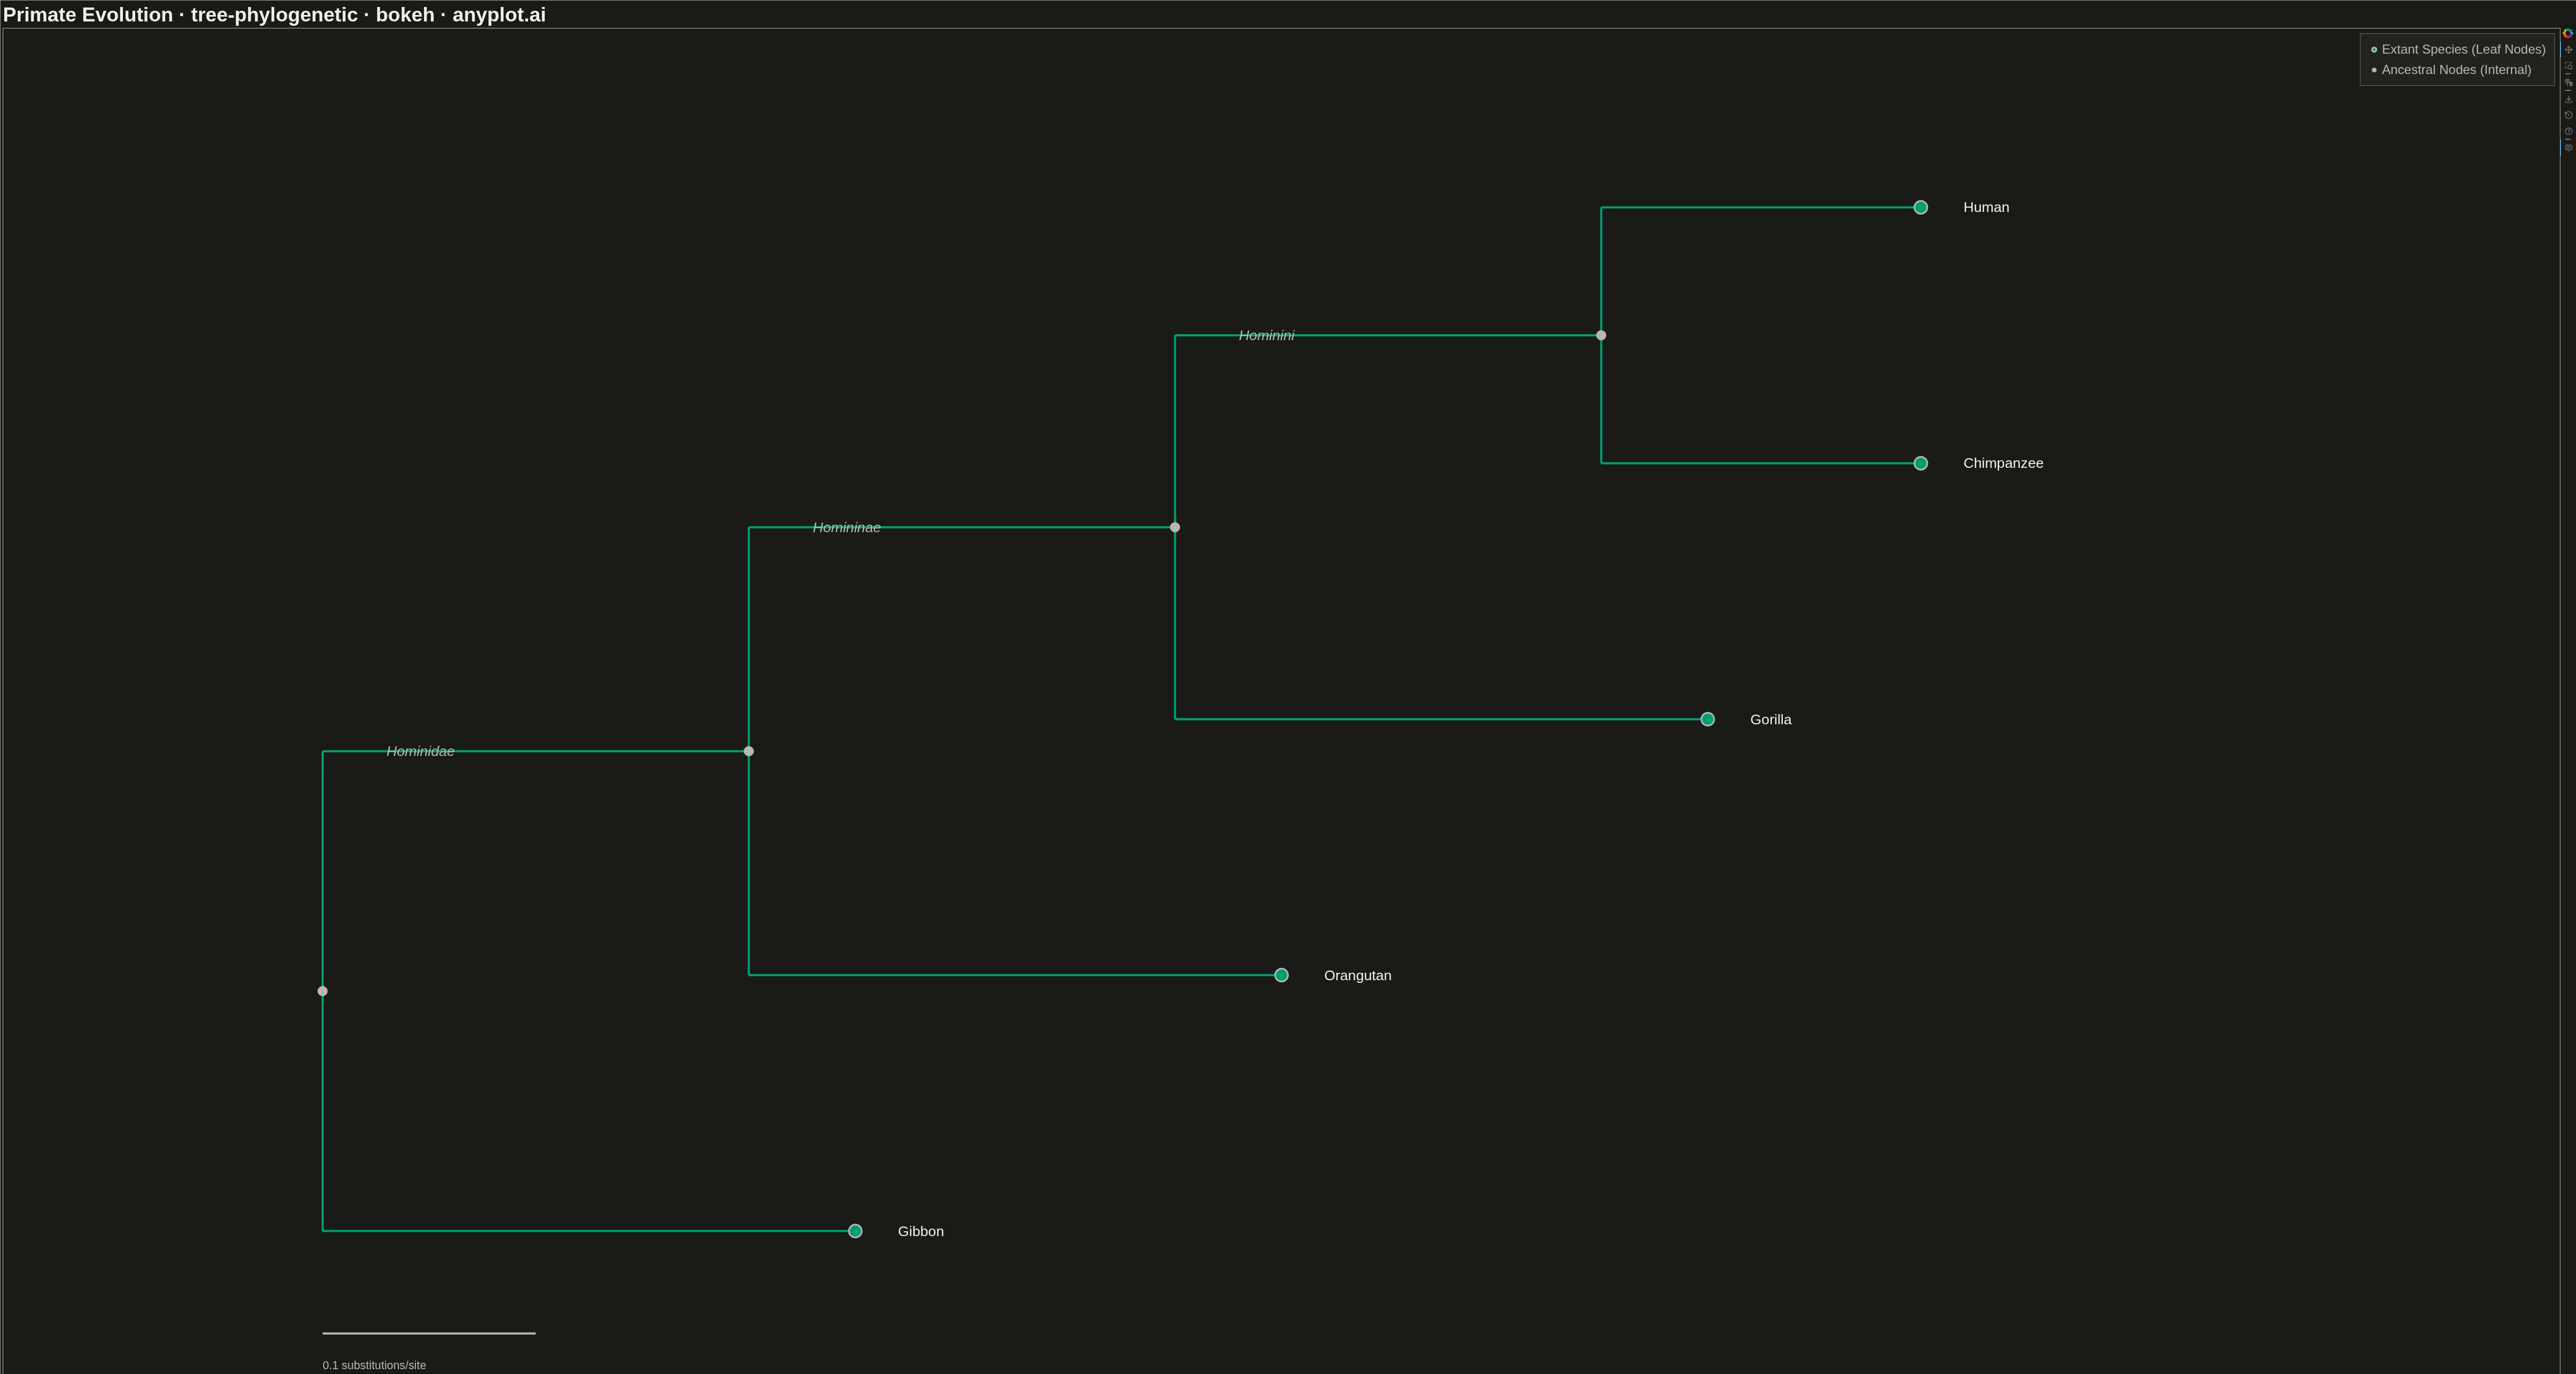
A phylogenetic tree (evolutionary tree) visualization showing hierarchical relationships between species or sequences, with branch lengths proportional to evolutionary distance. This diagram reveals how organisms or genes evolved from common ancestors, with longer branches indicating greater divergence. Phylogenetic trees are essential for understanding evolutionary history, taxonomy, and molecular biology relationships.
""" anyplot.ai
tree-phylogenetic: Phylogenetic Tree Diagram
Library: bokeh 3.9.0 | Python 3.13.13
Quality: 90/100 | Updated: 2026-05-15
"""

import os
import time
from pathlib import Path

from bokeh.io import output_file, save
from bokeh.models import ColumnDataSource, HoverTool, Label, Legend, LegendItem
from bokeh.plotting import figure
from selenium import webdriver
from selenium.webdriver.chrome.options import Options


# Theme tokens
THEME = os.getenv("ANYPLOT_THEME", "light")
PAGE_BG = "#FAF8F1" if THEME == "light" else "#1A1A17"
ELEVATED_BG = "#FFFDF6" if THEME == "light" else "#242420"
INK = "#1A1A17" if THEME == "light" else "#F0EFE8"
INK_SOFT = "#4A4A44" if THEME == "light" else "#B8B7B0"
BRAND = "#009E73"

# Phylogenetic tree data - Primate species (mitochondrial DNA based)
# Structure: ((((Human, Chimp), Gorilla), Orangutan), Gibbon)
# Rectangular cladogram layout

species = ["Human", "Chimpanzee", "Gorilla", "Orangutan", "Gibbon"]

# Leaf node positions (x = evolutionary distance, y = vertical position)
leaf_y = [5, 4, 3, 2, 1]
leaf_x = [0.75, 0.75, 0.65, 0.45, 0.25]

# Internal node positions
internal_x = [0.60, 0.40, 0.20, 0.00]
internal_y = [4.5, 3.75, 2.875, 1.9375]

# Horizontal branches from leaves to ancestors
h_branch_x = [
    [internal_x[0], leaf_x[0]],
    [internal_x[0], leaf_x[1]],
    [internal_x[1], leaf_x[2]],
    [internal_x[2], leaf_x[3]],
    [internal_x[3], leaf_x[4]],
    [internal_x[1], internal_x[0]],
    [internal_x[2], internal_x[1]],
    [internal_x[3], internal_x[2]],
]

h_branch_y = [
    [leaf_y[0], leaf_y[0]],
    [leaf_y[1], leaf_y[1]],
    [leaf_y[2], leaf_y[2]],
    [leaf_y[3], leaf_y[3]],
    [leaf_y[4], leaf_y[4]],
    [internal_y[0], internal_y[0]],
    [internal_y[1], internal_y[1]],
    [internal_y[2], internal_y[2]],
]

# Vertical branches connecting nodes
v_branch_x = [
    [internal_x[0], internal_x[0]],
    [internal_x[1], internal_x[1]],
    [internal_x[2], internal_x[2]],
    [internal_x[3], internal_x[3]],
]

v_branch_y = [
    [leaf_y[0], leaf_y[1]],
    [internal_y[0], leaf_y[2]],
    [internal_y[1], leaf_y[3]],
    [internal_y[2], leaf_y[4]],
]

# Create figure
p = figure(
    width=4800,
    height=2700,
    title="Primate Evolution · tree-phylogenetic · bokeh · anyplot.ai",
    x_axis_label="Evolutionary Distance (substitutions per site)",
    y_axis_label="",
    x_range=(-0.15, 1.05),
    y_range=(0.3, 5.7),
)

# Style the figure with theme-adaptive colors
p.background_fill_color = PAGE_BG
p.border_fill_color = PAGE_BG
p.outline_line_color = INK_SOFT

p.title.text_font_size = "28pt"
p.title.text_color = INK

p.xaxis.axis_label_text_font_size = "22pt"
p.xaxis.axis_label_text_color = INK
p.xaxis.major_label_text_font_size = "18pt"
p.xaxis.major_label_text_color = INK_SOFT
p.xaxis.axis_line_color = INK_SOFT
p.xaxis.major_tick_line_color = INK_SOFT

p.yaxis.visible = False
p.grid.visible = False

# Draw horizontal branches using brand color
for hx, hy in zip(h_branch_x, h_branch_y, strict=True):
    p.line(hx, hy, line_width=4, line_color=BRAND)

# Draw vertical branches using brand color
for vx, vy in zip(v_branch_x, v_branch_y, strict=True):
    p.line(vx, vy, line_width=4, line_color=BRAND)

# Draw leaf nodes
leaf_source = ColumnDataSource(
    data={
        "x": leaf_x,
        "y": leaf_y,
        "species": species,
        "type": ["Leaf Node"] * len(species),
        "info": [
            "Modern human (Homo sapiens)",
            "Chimpanzee (Pan troglodytes)",
            "Western gorilla (Gorilla gorilla)",
            "Bornean orangutan (Pongo pygmaeus)",
            "White-handed gibbon (Hylobates lar)",
        ],
    }
)
leaf_scatter = p.scatter(
    "x", "y", source=leaf_source, size=24, color=BRAND, line_color=INK_SOFT, line_width=3, name="leaf_nodes"
)

# Draw internal nodes
internal_names = ["Human-Chimp Ancestor", "Great Ape Ancestor", "Hominid Ancestor", "Root (Common Ancestor)"]
internal_source = ColumnDataSource(
    data={"x": internal_x, "y": internal_y, "type": ["Internal Node"] * len(internal_x), "info": internal_names}
)
internal_scatter = p.scatter("x", "y", source=internal_source, size=18, color=INK_SOFT, name="internal_nodes")

# Add hover tool
hover = HoverTool(
    renderers=[leaf_scatter, internal_scatter], tooltips=[("Type", "@type"), ("Info", "@info")], mode="mouse"
)
p.add_tools(hover)

# Add species labels with theme-adaptive color
for i, sp in enumerate(species):
    label = Label(
        x=leaf_x[i] + 0.02, y=leaf_y[i], text=sp, text_font_size="20pt", text_baseline="middle", text_color=INK
    )
    p.add_layout(label)

# Add scale bar
scale_bar_y = 0.6
p.line([0, 0.1], [scale_bar_y, scale_bar_y], line_width=4, line_color=INK_SOFT)
scale_label = Label(
    x=0.0, y=scale_bar_y - 0.15, text="0.1 substitutions/site", text_font_size="16pt", text_color=INK_SOFT
)
p.add_layout(scale_label)

# Add clade annotations with theme-adaptive color
clade_labels = [
    {"x": 0.58, "y": 4.5, "text": "Hominini"},
    {"x": 0.38, "y": 3.75, "text": "Homininae"},
    {"x": 0.18, "y": 2.875, "text": "Hominidae"},
]

for clade in clade_labels:
    bracket_label = Label(
        x=clade["x"] - 0.15,
        y=clade["y"],
        text=clade["text"],
        text_font_size="20pt",
        text_font_style="italic",
        text_color=INK_SOFT,
        text_baseline="middle",
    )
    p.add_layout(bracket_label)

# Add legend with theme-adaptive styling
legend = Legend(
    items=[
        LegendItem(label="Extant Species (Leaf Nodes)", renderers=[leaf_scatter]),
        LegendItem(label="Ancestral Nodes (Internal)", renderers=[internal_scatter]),
    ],
    location="top_right",
    label_text_font_size="18pt",
    label_text_color=INK_SOFT,
    spacing=10,
    padding=15,
    background_fill_color=ELEVATED_BG,
    background_fill_alpha=0.9,
    border_line_color=INK_SOFT,
)
p.add_layout(legend)

# Save HTML (required catalog artifact)
output_file(f"plot-{THEME}.html")
save(p)

# Screenshot with Selenium/headless Chrome
W, H = 4800, 2700
opts = Options()
for arg in (
    "--headless=new",
    "--no-sandbox",
    "--disable-dev-shm-usage",
    "--disable-gpu",
    f"--window-size={W},{H}",
    "--hide-scrollbars",
):
    opts.add_argument(arg)
driver = webdriver.Chrome(options=opts)
driver.set_window_size(W, H)
driver.get(f"file://{Path(f'plot-{THEME}.html').resolve()}")
time.sleep(3)
driver.save_screenshot(f"plot-{THEME}.png")
driver.quit()
Runnable source as JSON, for any HTTP client: https://api.anyplot.ai/specs/tree-phylogenetic/bokeh/code. Any spec id and library id listed in llms-full.txt fit the same URL shape; every URL below is complete and callable.
{
  "spec_id": "tree-phylogenetic",
  "language": "python",
  "library": "bokeh",
  "page": "https://anyplot.ai/tree-phylogenetic/python/bokeh",
  "hub": "https://anyplot.ai/tree-phylogenetic",
  "code_json": "https://api.anyplot.ai/specs/tree-phylogenetic/bokeh/code",
  "spec_json": "https://api.anyplot.ai/specs/tree-phylogenetic",
  "render_light_png": "https://storage.googleapis.com/anyplot-images/plots/tree-phylogenetic/python/bokeh/plot-light.png",
  "render_dark_png": "https://storage.googleapis.com/anyplot-images/plots/tree-phylogenetic/python/bokeh/plot-dark.png",
  "interactive_light_html": "https://storage.googleapis.com/anyplot-images/plots/tree-phylogenetic/python/bokeh/plot-light.html",
  "interactive_dark_html": "https://storage.googleapis.com/anyplot-images/plots/tree-phylogenetic/python/bokeh/plot-dark.html",
  "quality_score": 90.0,
  "license": "MIT",
  "guide": "https://anyplot.ai/llms.txt"
}
Part of Phylogenetic Tree Diagram on anyplot.ai.