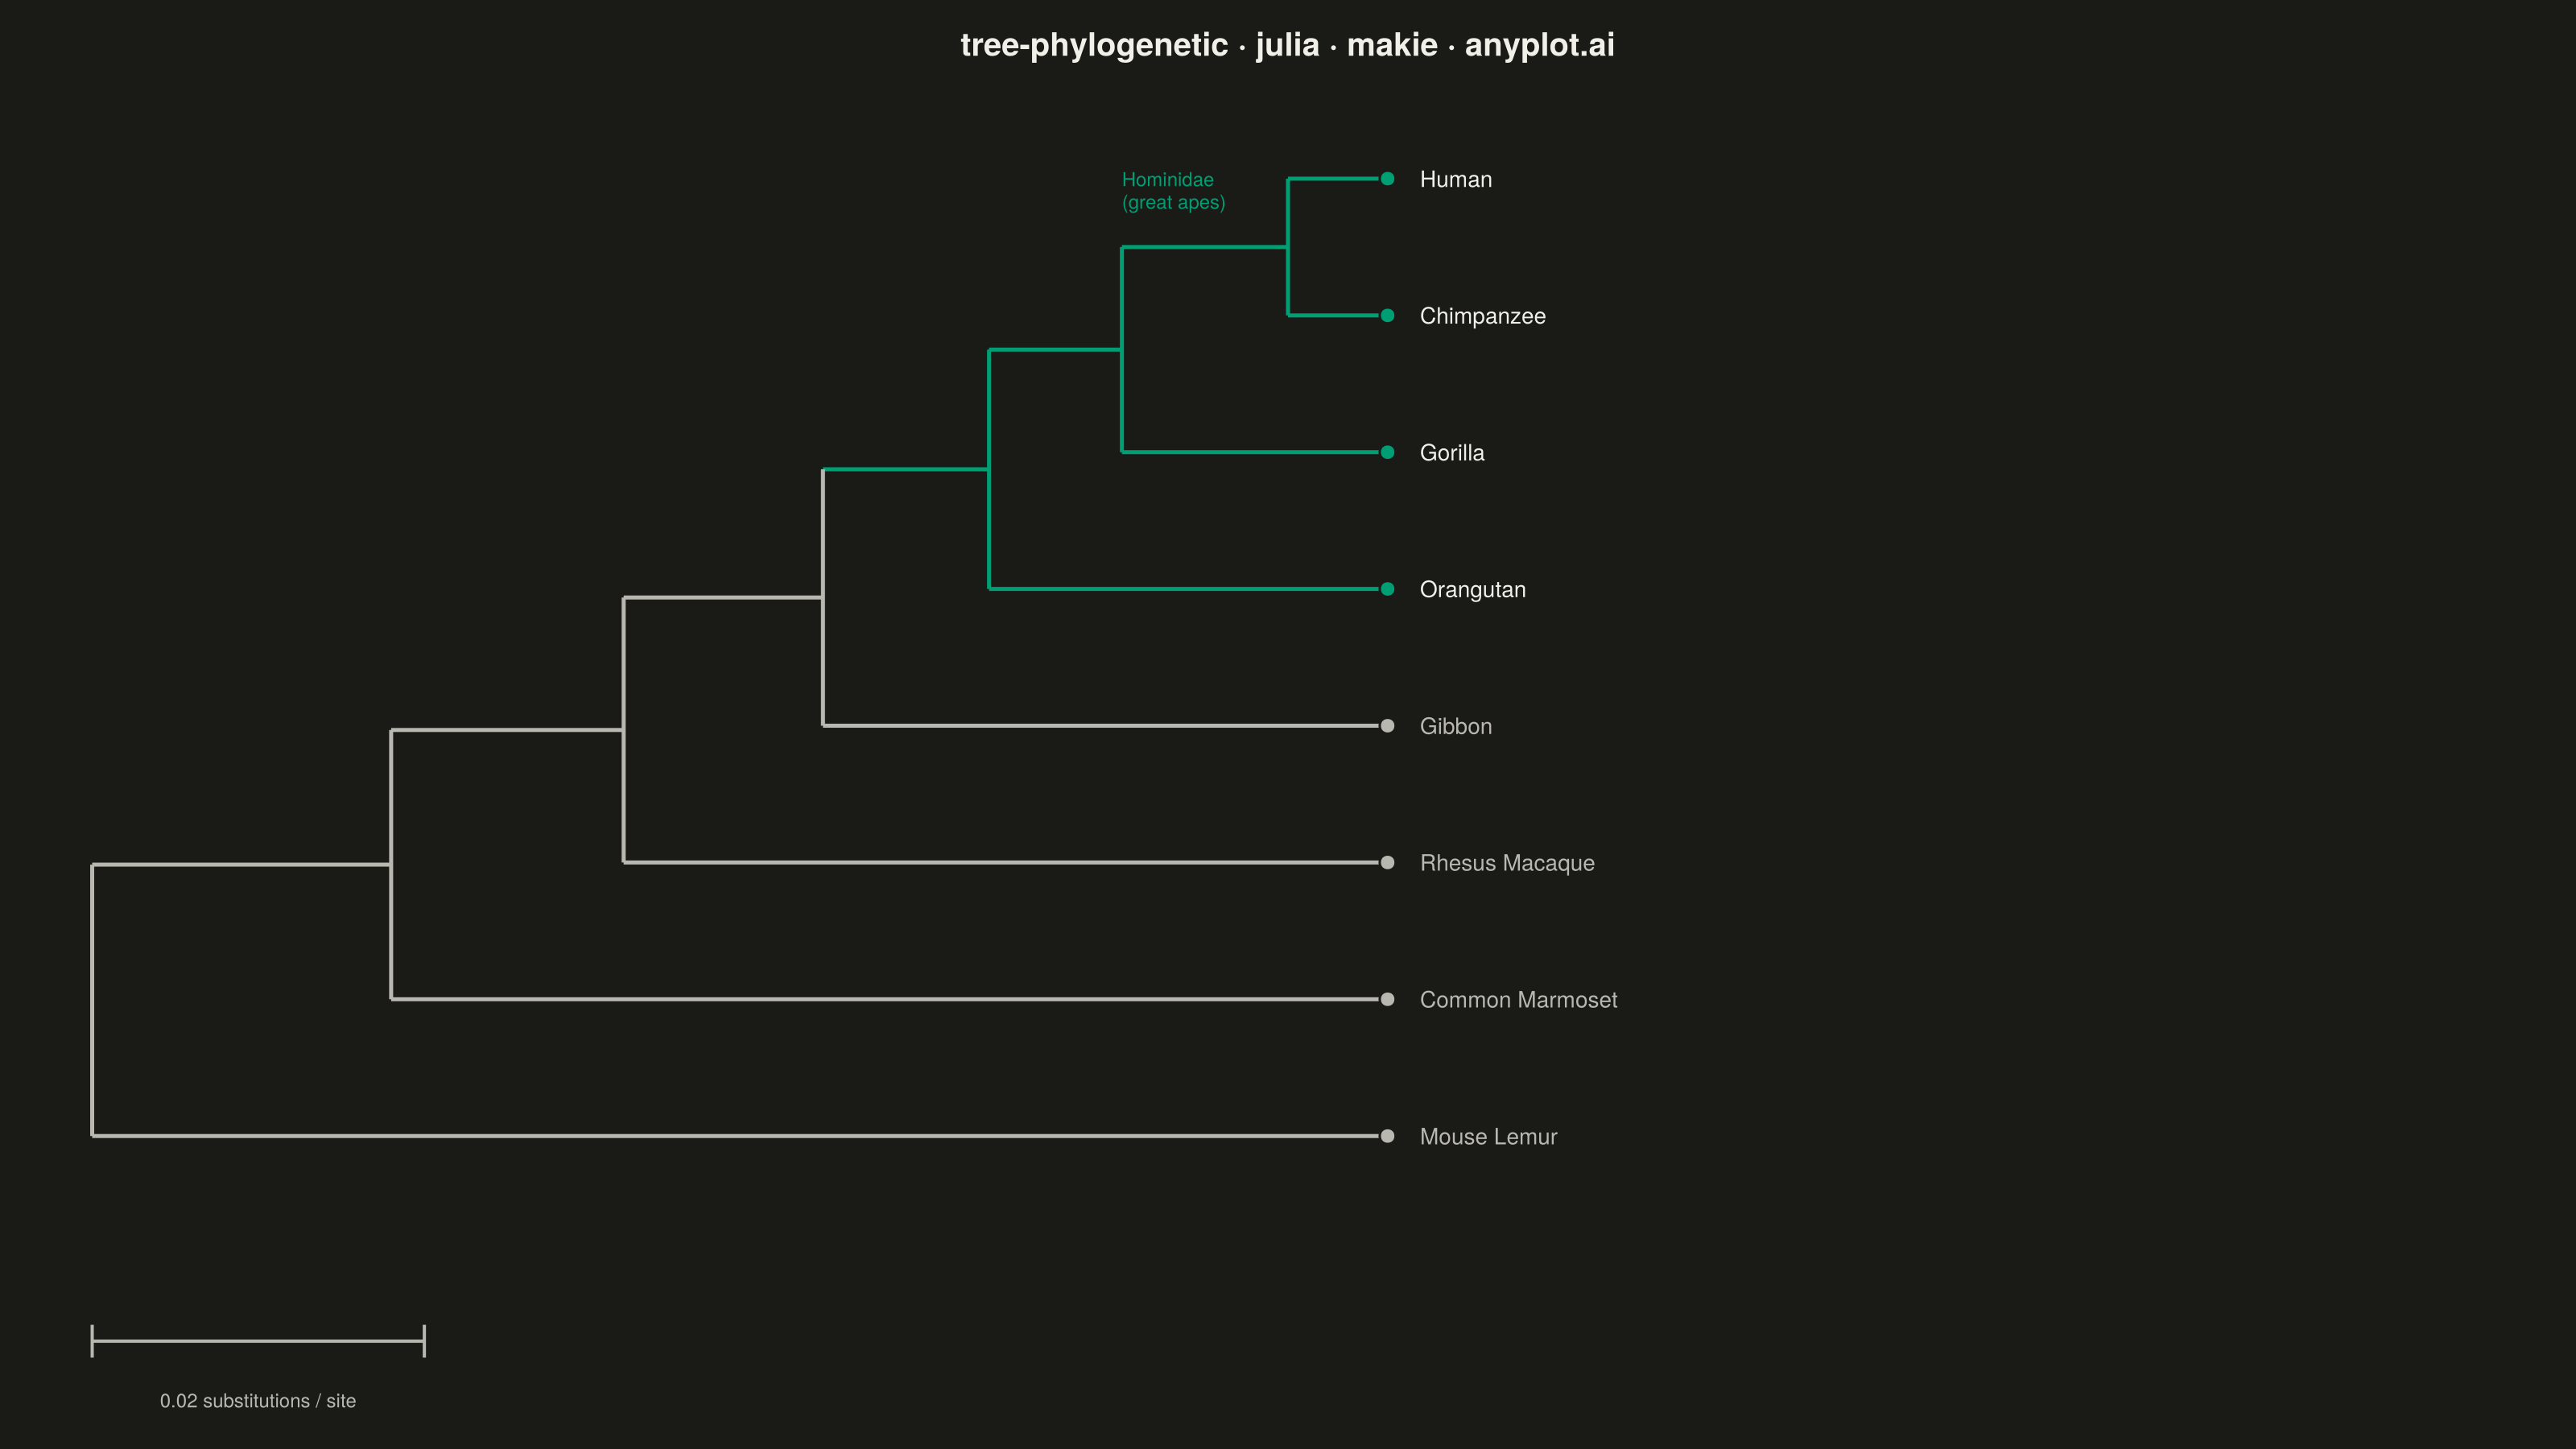
The same plot in 14 other libraries — Python: Altair, Bokeh, lets-plot, Matplotlib, Plotly, plotnine, Pygal, Seaborn; R: ggplot2; JavaScript: Chart.js, D3.js, Apache ECharts, Highcharts, MUI X Charts. Compare all 15 side by side: Phylogenetic Tree Diagram in Python, R, Julia and JavaScript.
A phylogenetic tree (evolutionary tree) visualization showing hierarchical relationships between species or sequences, with branch lengths proportional to evolutionary distance. This diagram reveals how organisms or genes evolved from common ancestors, with longer branches indicating greater divergence. Phylogenetic trees are essential for understanding evolutionary history, taxonomy, and molecular biology relationships.
# anyplot.ai
# tree-phylogenetic: Phylogenetic Tree Diagram
# Library: makie 0.21.9 | Julia 1.11.9
# Quality: 89/100 | Created: 2026-09-09

using CairoMakie
using Colors

# Theme tokens (see prompts/default-style-guide.md "Background" + "Theme-adaptive Chrome")
THEME = get(ENV, "ANYPLOT_THEME", "light")
PAGE_BG = THEME == "light" ? colorant"#FAF8F1" : colorant"#1A1A17"
INK = THEME == "light" ? colorant"#1A1A17" : colorant"#F0EFE8"
INK_SOFT = THEME == "light" ? colorant"#4A4A44" : colorant"#B8B7B0"

BRAND = colorant"#009E73"  # Imprint palette position 1 — highlighted clade (Hominidae)

# Data — simplified primate phylogeny from mitochondrial-DNA divergence,
# pectinate topology. Leaves are ids 1-8, internal nodes 9-15; each dict
# entry keys a node id to its children (internal) or its parent-branch
# length (substitutions per site). No Newick parser / Phylo.jl in the CI
# runtime, so the tree is expressed directly as id-based adjacency.
species = Dict(
    1 => "Human", 2 => "Chimpanzee", 3 => "Gorilla", 4 => "Orangutan",
    5 => "Gibbon", 6 => "Rhesus Macaque", 7 => "Common Marmoset", 8 => "Mouse Lemur",
)
children = Dict(
    9 => (1, 2), 10 => (9, 3), 11 => (10, 4), 12 => (11, 5),
    13 => (12, 6), 14 => (13, 7), 15 => (14, 8),
)
branch_length = Dict(
    1 => 0.006, 2 => 0.006, 9 => 0.010, 3 => 0.016, 10 => 0.008,
    4 => 0.024, 11 => 0.010, 5 => 0.034, 12 => 0.012, 6 => 0.046,
    13 => 0.014, 7 => 0.060, 14 => 0.018, 8 => 0.078,
)
root_id = 15
leaf_order = [1, 2, 3, 4, 5, 6, 7, 8]  # top-to-bottom drawing order
hominidae = Set([1, 2, 3, 4])  # great apes — the highlighted lineage

# Layout — x is cumulative branch length from the root (ancestor at x=0,
# present day at max x); y is leaf rank, with internal nodes placed at the
# mean of their children's y (standard cladogram convention).
node_x = Dict{Int,Float64}(root_id => 0.0)
for nid in root_id:-1:9
    i, j = children[nid]
    node_x[i] = node_x[nid] + branch_length[i]
    node_x[j] = node_x[nid] + branch_length[j]
end

node_y = Dict{Int,Float64}()
for (rank, leaf) in enumerate(leaf_order)
    node_y[leaf] = length(leaf_order) - rank + 1
end
for nid in 9:root_id
    i, j = children[nid]
    node_y[nid] = (node_y[i] + node_y[j]) / 2
end

# Pure-clade color propagation: a node is "in" Hominidae only if every leaf
# beneath it is a great ape, so the highlight stops exactly at the clade's
# stem branch (mirrors the standard dendrogram color_threshold convention).
in_clade = Dict{Int,Bool}(leaf => (leaf in hominidae) for leaf in leaf_order)
for nid in 9:root_id
    i, j = children[nid]
    in_clade[nid] = in_clade[i] && in_clade[j]
end

max_x = maximum(values(node_x))

# Plot — see default-style-guide.md "Visual Sizing Defaults" for the canvas + sizing values
title_text = "tree-phylogenetic · julia · makie · anyplot.ai"

fig = Figure(
    resolution = (1600, 900),
    fontsize = 14,
    backgroundcolor = PAGE_BG,
)

ax = Axis(
    fig[1, 1];
    title = title_text,
    titlesize = 20,
    titlecolor = INK,
    backgroundcolor = PAGE_BG,
)
hidedecorations!(ax)
hidespines!(ax)
limits!(ax, -0.004, max_x + 0.07, -1.1, 8.8)

# Branches — one horizontal segment per node (parent x to node x) plus one
# vertical connector per internal node joining its two children.
for nid in 9:root_id
    i, j = children[nid]
    xp, yp = node_x[nid], node_y[nid]
    for c in (i, j)
        edge_color = in_clade[c] ? BRAND : INK_SOFT
        lines!(ax, [xp, node_x[c]], [node_y[c], node_y[c]]; color = edge_color, linewidth = 2.5)
    end
    connector_color = in_clade[nid] ? BRAND : INK_SOFT
    lines!(ax, [xp, xp], [node_y[i], node_y[j]]; color = connector_color, linewidth = 2.5)
end

# Leaf tips and species labels.
for leaf in leaf_order
    tip_color = in_clade[leaf] ? BRAND : INK_SOFT
    label_color = in_clade[leaf] ? INK : INK_SOFT
    scatter!(
        ax, [node_x[leaf]], [node_y[leaf]];
        color = tip_color, markersize = 14, strokewidth = 1.5, strokecolor = PAGE_BG,
    )
    text!(
        ax, node_x[leaf] + max_x * 0.025, node_y[leaf];
        text = species[leaf], align = (:left, :center), fontsize = 14, color = label_color,
    )
end

# Clade callout — labels the highlighted great-ape lineage near its stem.
text!(
    ax, node_x[10], node_y[10] + 1.0;
    text = "Hominidae\n(great apes)", align = (:left, :bottom),
    fontsize = 12, color = BRAND, justification = :left,
)

# Scale bar — standard phylogenetic-tree convention for branch length units.
scale_len = 0.02
scale_y = -0.5
lines!(ax, [0.0, scale_len], [scale_y, scale_y]; color = INK_SOFT, linewidth = 2.0)
lines!(ax, [0.0, 0.0], [scale_y - 0.12, scale_y + 0.12]; color = INK_SOFT, linewidth = 2.0)
lines!(ax, [scale_len, scale_len], [scale_y - 0.12, scale_y + 0.12]; color = INK_SOFT, linewidth = 2.0)
text!(
    ax, scale_len / 2, scale_y - 0.35;
    text = "0.02 substitutions / site", align = (:center, :top), fontsize = 12, color = INK_SOFT,
)

# Save
save("plot-$(THEME).png", fig; px_per_unit = 2)
Runnable source as JSON, for any HTTP client: https://api.anyplot.ai/specs/tree-phylogenetic/makie/code. Any spec id and library id listed in llms-full.txt fit the same URL shape; every URL below is complete and callable.
{
  "spec_id": "tree-phylogenetic",
  "language": "julia",
  "library": "makie",
  "page": "https://anyplot.ai/tree-phylogenetic/julia/makie",
  "hub": "https://anyplot.ai/tree-phylogenetic",
  "code_json": "https://api.anyplot.ai/specs/tree-phylogenetic/makie/code",
  "spec_json": "https://api.anyplot.ai/specs/tree-phylogenetic",
  "render_light_png": "https://storage.googleapis.com/anyplot-images/plots/tree-phylogenetic/julia/makie/plot-light.png",
  "render_dark_png": "https://storage.googleapis.com/anyplot-images/plots/tree-phylogenetic/julia/makie/plot-dark.png",
  "quality_score": 89.0,
  "license": "MIT",
  "guide": "https://anyplot.ai/llms.txt"
}
Part of Phylogenetic Tree Diagram on anyplot.ai.