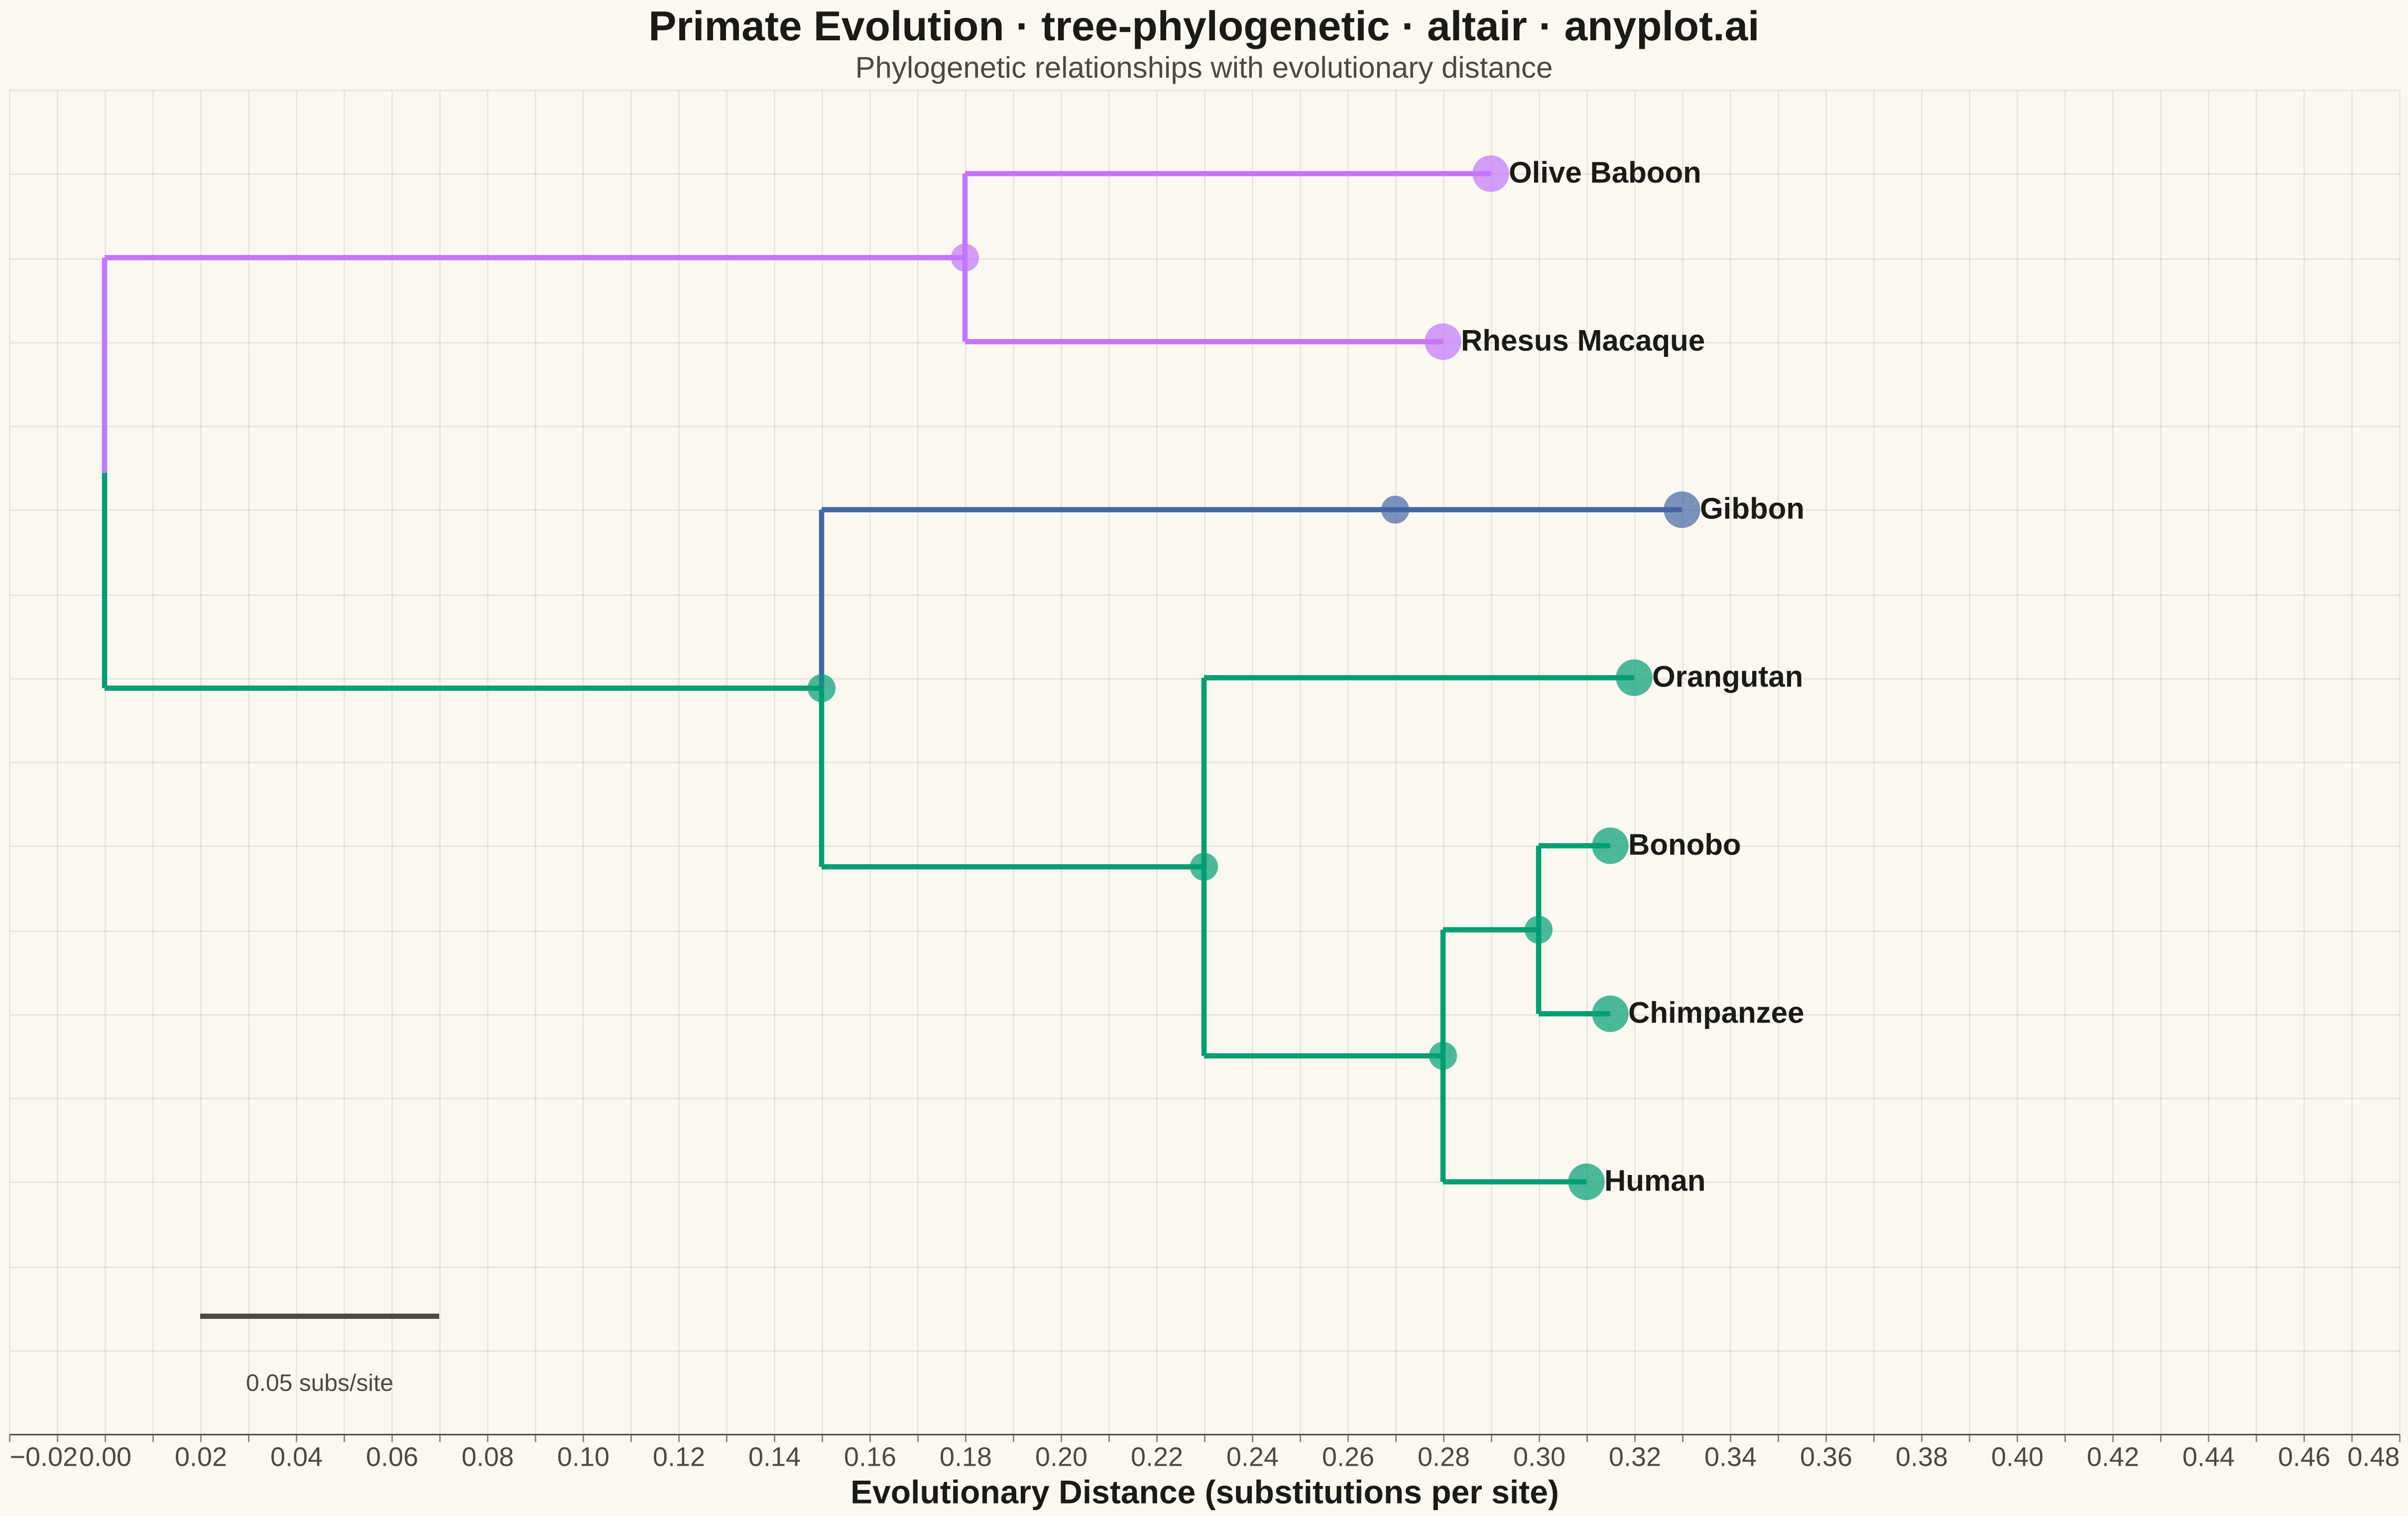
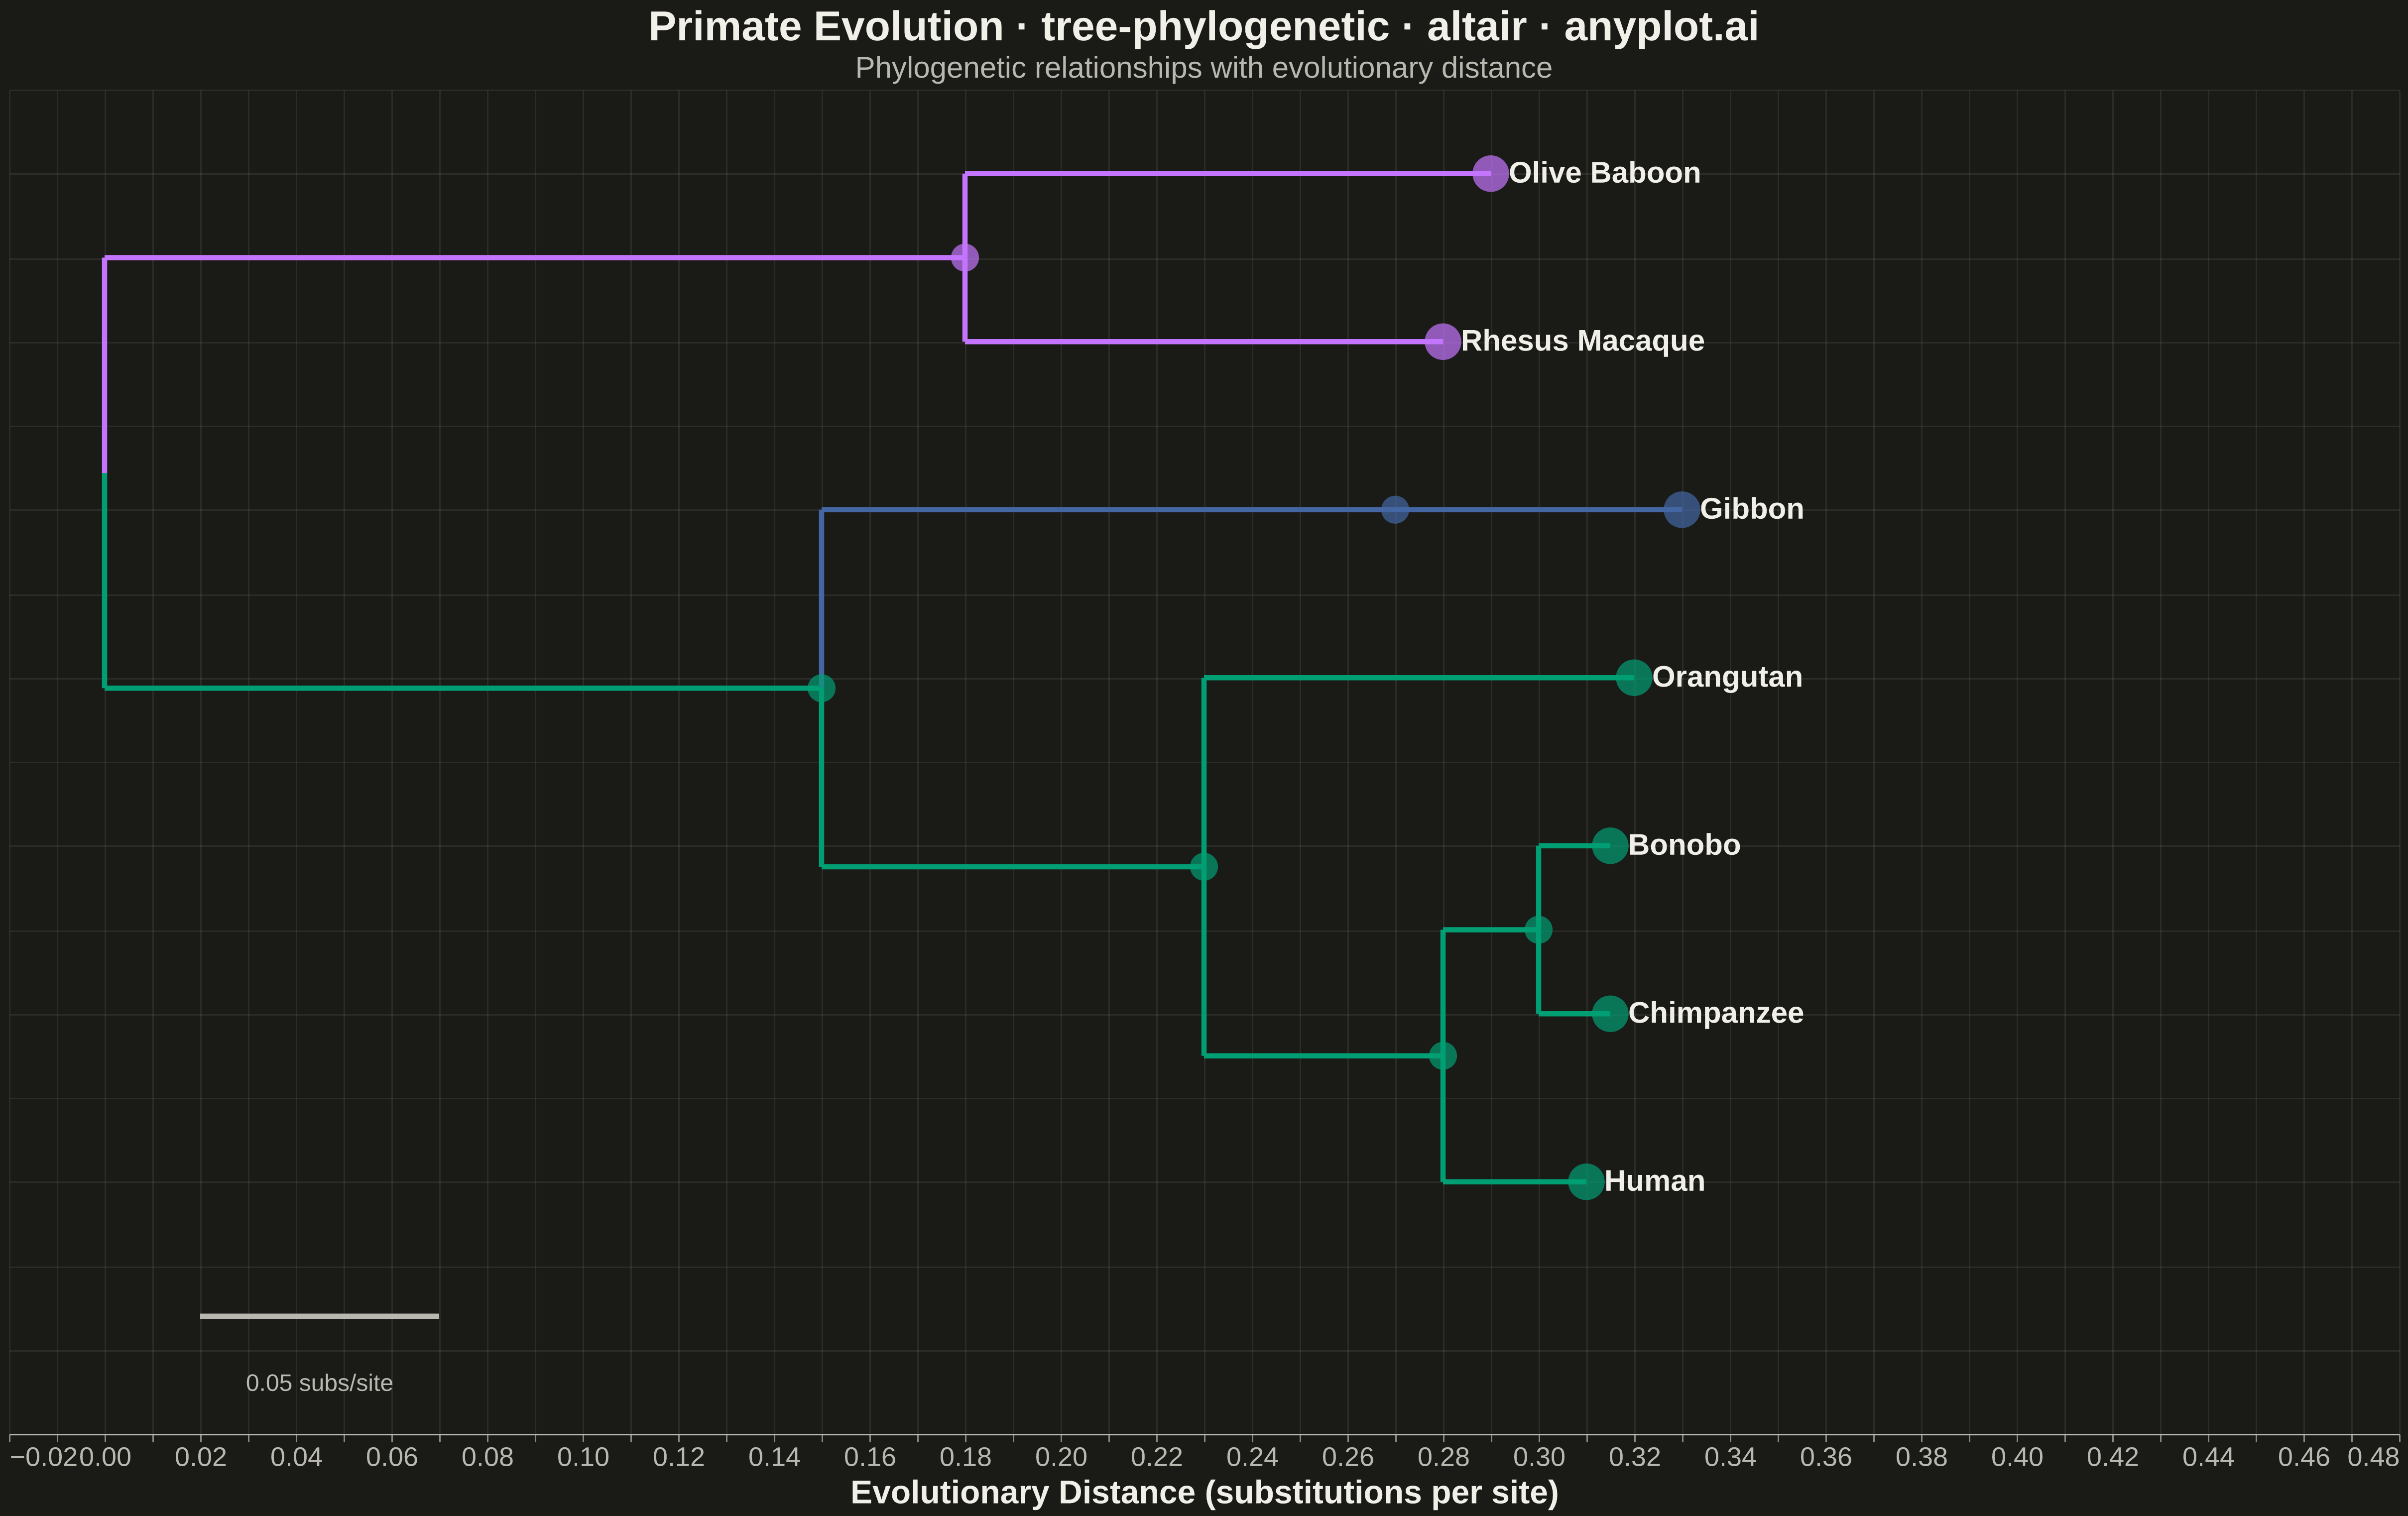
A phylogenetic tree (evolutionary tree) visualization showing hierarchical relationships between species or sequences, with branch lengths proportional to evolutionary distance. This diagram reveals how organisms or genes evolved from common ancestors, with longer branches indicating greater divergence. Phylogenetic trees are essential for understanding evolutionary history, taxonomy, and molecular biology relationships.
""" anyplot.ai
tree-phylogenetic: Phylogenetic Tree Diagram
Library: altair 6.1.0 | Python 3.13.13
Quality: 94/100 | Updated: 2026-05-15
"""

import os

import altair as alt
import numpy as np
import pandas as pd


# Theme tokens
THEME = os.getenv("ANYPLOT_THEME", "light")
PAGE_BG = "#FAF8F1" if THEME == "light" else "#1A1A17"
ELEVATED_BG = "#FFFDF6" if THEME == "light" else "#242420"
INK = "#1A1A17" if THEME == "light" else "#F0EFE8"
INK_SOFT = "#4A4A44" if THEME == "light" else "#B8B7B0"

# Okabe-Ito palette for clade coloring
IMPRINT = ["#009E73", "#C475FD", "#4467A3", "#BD8233", "#AE3030", "#2ABCCD"]

# Primate phylogenetic tree with clade assignments
np.random.seed(42)

edges = [
    ("Root", "Hominoidea", 0.15, "Apes"),
    ("Root", "Cercopithecidae", 0.18, "Old World Monkeys"),
    ("Hominoidea", "Hominidae", 0.08, "Apes"),
    ("Hominoidea", "Hylobatidae", 0.12, "Lesser Apes"),
    ("Hominidae", "Homininae", 0.05, "Apes"),
    ("Hominidae", "Pongo pygmaeus", 0.09, "Apes"),
    ("Homininae", "Homo sapiens", 0.03, "Apes"),
    ("Homininae", "Pan", 0.02, "Apes"),
    ("Pan", "Pan troglodytes", 0.015, "Apes"),
    ("Pan", "Pan paniscus", 0.015, "Apes"),
    ("Hylobatidae", "Hylobates lar", 0.06, "Lesser Apes"),
    ("Cercopithecidae", "Macaca mulatta", 0.10, "Old World Monkeys"),
    ("Cercopithecidae", "Papio anubis", 0.11, "Old World Monkeys"),
]

leaf_nodes = {
    "Homo sapiens": "Human",
    "Pan troglodytes": "Chimpanzee",
    "Pan paniscus": "Bonobo",
    "Pongo pygmaeus": "Orangutan",
    "Hylobates lar": "Gibbon",
    "Macaca mulatta": "Rhesus Macaque",
    "Papio anubis": "Olive Baboon",
}

# Build tree structure
children = {}
branch_lengths = {}
clade_map = {}
for parent, child, length, clade in edges:
    if parent not in children:
        children[parent] = []
    children[parent].append(child)
    branch_lengths[(parent, child)] = length
    clade_map[child] = clade


# Get leaf nodes
def get_leaves(node):
    if node not in children:
        return [node]
    leaves = []
    for child in children[node]:
        leaves.extend(get_leaves(child))
    return leaves


all_leaves = get_leaves("Root")
n_leaves = len(all_leaves)
leaf_y = {leaf: i for i, leaf in enumerate(all_leaves)}


# Calculate positions
def calc_x_positions(node, current_x=0):
    positions = {node: current_x}
    if node in children:
        for child in children[node]:
            child_x = current_x + branch_lengths[(node, child)]
            positions.update(calc_x_positions(child, child_x))
    return positions


def calc_y_positions(node):
    if node not in children:
        return {node: leaf_y[node]}
    positions = {}
    child_ys = []
    for child in children[node]:
        child_positions = calc_y_positions(child)
        positions.update(child_positions)
        child_ys.append(child_positions[child])
    positions[node] = np.mean(child_ys)
    return positions


x_positions = calc_x_positions("Root")
y_positions = calc_y_positions("Root")

# Build line segments
lines_data = []
for parent, child, _length, clade in edges:
    parent_x = x_positions[parent]
    parent_y = y_positions[parent]
    child_x = x_positions[child]
    child_y = y_positions[child]
    clade_idx = ["Apes", "Old World Monkeys", "Lesser Apes"].index(clade)
    color = IMPRINT[clade_idx]

    lines_data.append(
        {
            "x": parent_x,
            "y": parent_y,
            "x2": parent_x,
            "y2": child_y,
            "type": "vertical",
            "clade": clade,
            "color": color,
        }
    )
    lines_data.append(
        {
            "x": parent_x,
            "y": child_y,
            "x2": child_x,
            "y2": child_y,
            "type": "horizontal",
            "clade": clade,
            "color": color,
        }
    )

lines_df = pd.DataFrame(lines_data)

# Leaf nodes data
nodes_data = []
for node in all_leaves:
    label = leaf_nodes.get(node, node)
    clade = clade_map.get(node, "Unknown")
    clade_idx = (
        ["Apes", "Old World Monkeys", "Lesser Apes"].index(clade)
        if clade in ["Apes", "Old World Monkeys", "Lesser Apes"]
        else 0
    )
    color = IMPRINT[clade_idx]
    nodes_data.append(
        {
            "x": x_positions[node],
            "y": y_positions[node],
            "label": label,
            "species": node,
            "clade": clade,
            "color": color,
        }
    )

nodes_df = pd.DataFrame(nodes_data)

# Internal nodes data
internal_nodes = [n for n in x_positions.keys() if n not in all_leaves and n != "Root"]
internal_data = []
for n in internal_nodes:
    clade = clade_map.get(n, "Unknown")
    clade_idx = (
        ["Apes", "Old World Monkeys", "Lesser Apes"].index(clade)
        if clade in ["Apes", "Old World Monkeys", "Lesser Apes"]
        else 0
    )
    color = IMPRINT[clade_idx]
    internal_data.append({"x": x_positions[n], "y": y_positions[n], "name": n, "clade": clade, "color": color})
internal_df = pd.DataFrame(internal_data)

# Create branches with clade colors
branches = (
    alt.Chart(lines_df)
    .mark_rule(strokeWidth=3.5)
    .encode(
        x="x:Q",
        y="y:Q",
        x2="x2:Q",
        y2="y2:Q",
        color=alt.Color("color:N", scale=alt.Scale(domain=IMPRINT, range=IMPRINT), legend=None),
        tooltip=["clade:N"],
    )
)

# Create leaf node points
leaf_points = (
    alt.Chart(nodes_df)
    .mark_circle(size=600)
    .encode(
        x="x:Q",
        y="y:Q",
        color=alt.Color("color:N", scale=alt.Scale(domain=IMPRINT, range=IMPRINT), legend=None),
        tooltip=["species:N", "label:N", "clade:N"],
    )
)

# Create leaf labels
leaf_labels = (
    alt.Chart(nodes_df)
    .mark_text(align="left", baseline="middle", dx=12, fontSize=20, fontWeight="bold")
    .encode(x="x:Q", y="y:Q", text="label:N", color=alt.value(INK))
)

# Create internal node points (larger now)
internal_points = (
    alt.Chart(internal_df)
    .mark_circle(size=350)
    .encode(
        x="x:Q",
        y="y:Q",
        color=alt.Color("color:N", scale=alt.Scale(domain=IMPRINT, range=IMPRINT), legend=None),
        tooltip=["name:N", "clade:N"],
    )
)

# Create scale bar
max_x = max(x_positions.values())
scale_bar_length = 0.05
scale_bar_data = pd.DataFrame([{"x": 0.02, "y": -0.8, "x2": 0.02 + scale_bar_length, "y2": -0.8}])
scale_bar = (
    alt.Chart(scale_bar_data)
    .mark_rule(strokeWidth=3.5)
    .encode(x="x:Q", y="y:Q", x2="x2:Q", y2="y2:Q", color=alt.value(INK_SOFT))
)

scale_bar_label = (
    alt.Chart(pd.DataFrame([{"x": 0.02 + scale_bar_length / 2, "y": -1.2, "text": "0.05 subs/site"}]))
    .mark_text(fontSize=16, color=INK_SOFT)
    .encode(x="x:Q", y="y:Q", text="text:N")
)

# Combine layers
chart = (
    alt.layer(branches, internal_points, leaf_points, leaf_labels, scale_bar, scale_bar_label)
    .properties(
        width=1600,
        height=900,
        background=PAGE_BG,
        title=alt.Title(
            "Primate Evolution · tree-phylogenetic · altair · anyplot.ai",
            fontSize=28,
            anchor="middle",
            color=INK,
            subtitle="Phylogenetic relationships with evolutionary distance",
            subtitleFontSize=20,
            subtitleColor=INK_SOFT,
        ),
    )
    .configure_axis(
        labelFontSize=18,
        titleFontSize=22,
        titleColor=INK,
        labelColor=INK_SOFT,
        domainColor=INK_SOFT,
        gridColor=INK_SOFT,
        gridOpacity=0.10,
    )
    .configure_title(color=INK)
    .configure_view(fill=PAGE_BG, stroke=None)
)

# Set axes
chart = chart.encode(
    x=alt.X(
        "x:Q", title="Evolutionary Distance (substitutions per site)", scale=alt.Scale(domain=[-0.02, max_x + 0.15])
    ),
    y=alt.Y(
        "y:Q",
        title="",
        scale=alt.Scale(domain=[-1.5, n_leaves - 0.5]),
        axis=alt.Axis(labels=False, ticks=False, domain=False),
    ),
)

# Save outputs
chart.save(f"plot-{THEME}.png", scale_factor=3.0)
chart.save(f"plot-{THEME}.html")
Runnable source as JSON, for any HTTP client: https://api.anyplot.ai/specs/tree-phylogenetic/altair/code. Any spec id and library id listed in llms-full.txt fit the same URL shape; every URL below is complete and callable.
{
  "spec_id": "tree-phylogenetic",
  "language": "python",
  "library": "altair",
  "page": "https://anyplot.ai/tree-phylogenetic/python/altair",
  "hub": "https://anyplot.ai/tree-phylogenetic",
  "code_json": "https://api.anyplot.ai/specs/tree-phylogenetic/altair/code",
  "spec_json": "https://api.anyplot.ai/specs/tree-phylogenetic",
  "render_light_png": "https://storage.googleapis.com/anyplot-images/plots/tree-phylogenetic/python/altair/plot-light.png",
  "render_dark_png": "https://storage.googleapis.com/anyplot-images/plots/tree-phylogenetic/python/altair/plot-dark.png",
  "interactive_light_html": "https://storage.googleapis.com/anyplot-images/plots/tree-phylogenetic/python/altair/plot-light.html",
  "interactive_dark_html": "https://storage.googleapis.com/anyplot-images/plots/tree-phylogenetic/python/altair/plot-dark.html",
  "quality_score": 94.0,
  "license": "MIT",
  "guide": "https://anyplot.ai/llms.txt"
}
Part of Phylogenetic Tree Diagram on anyplot.ai.