The same plot in 14 other libraries — JavaScript: Chart.js, D3.js, Apache ECharts, Highcharts; Python: Altair, Bokeh, lets-plot, Matplotlib, Plotly, plotnine, Pygal, Seaborn; R: ggplot2; Julia: Makie.jl. Compare all 15 side by side: Phylogenetic Tree Diagram in Python, R, Julia and JavaScript.
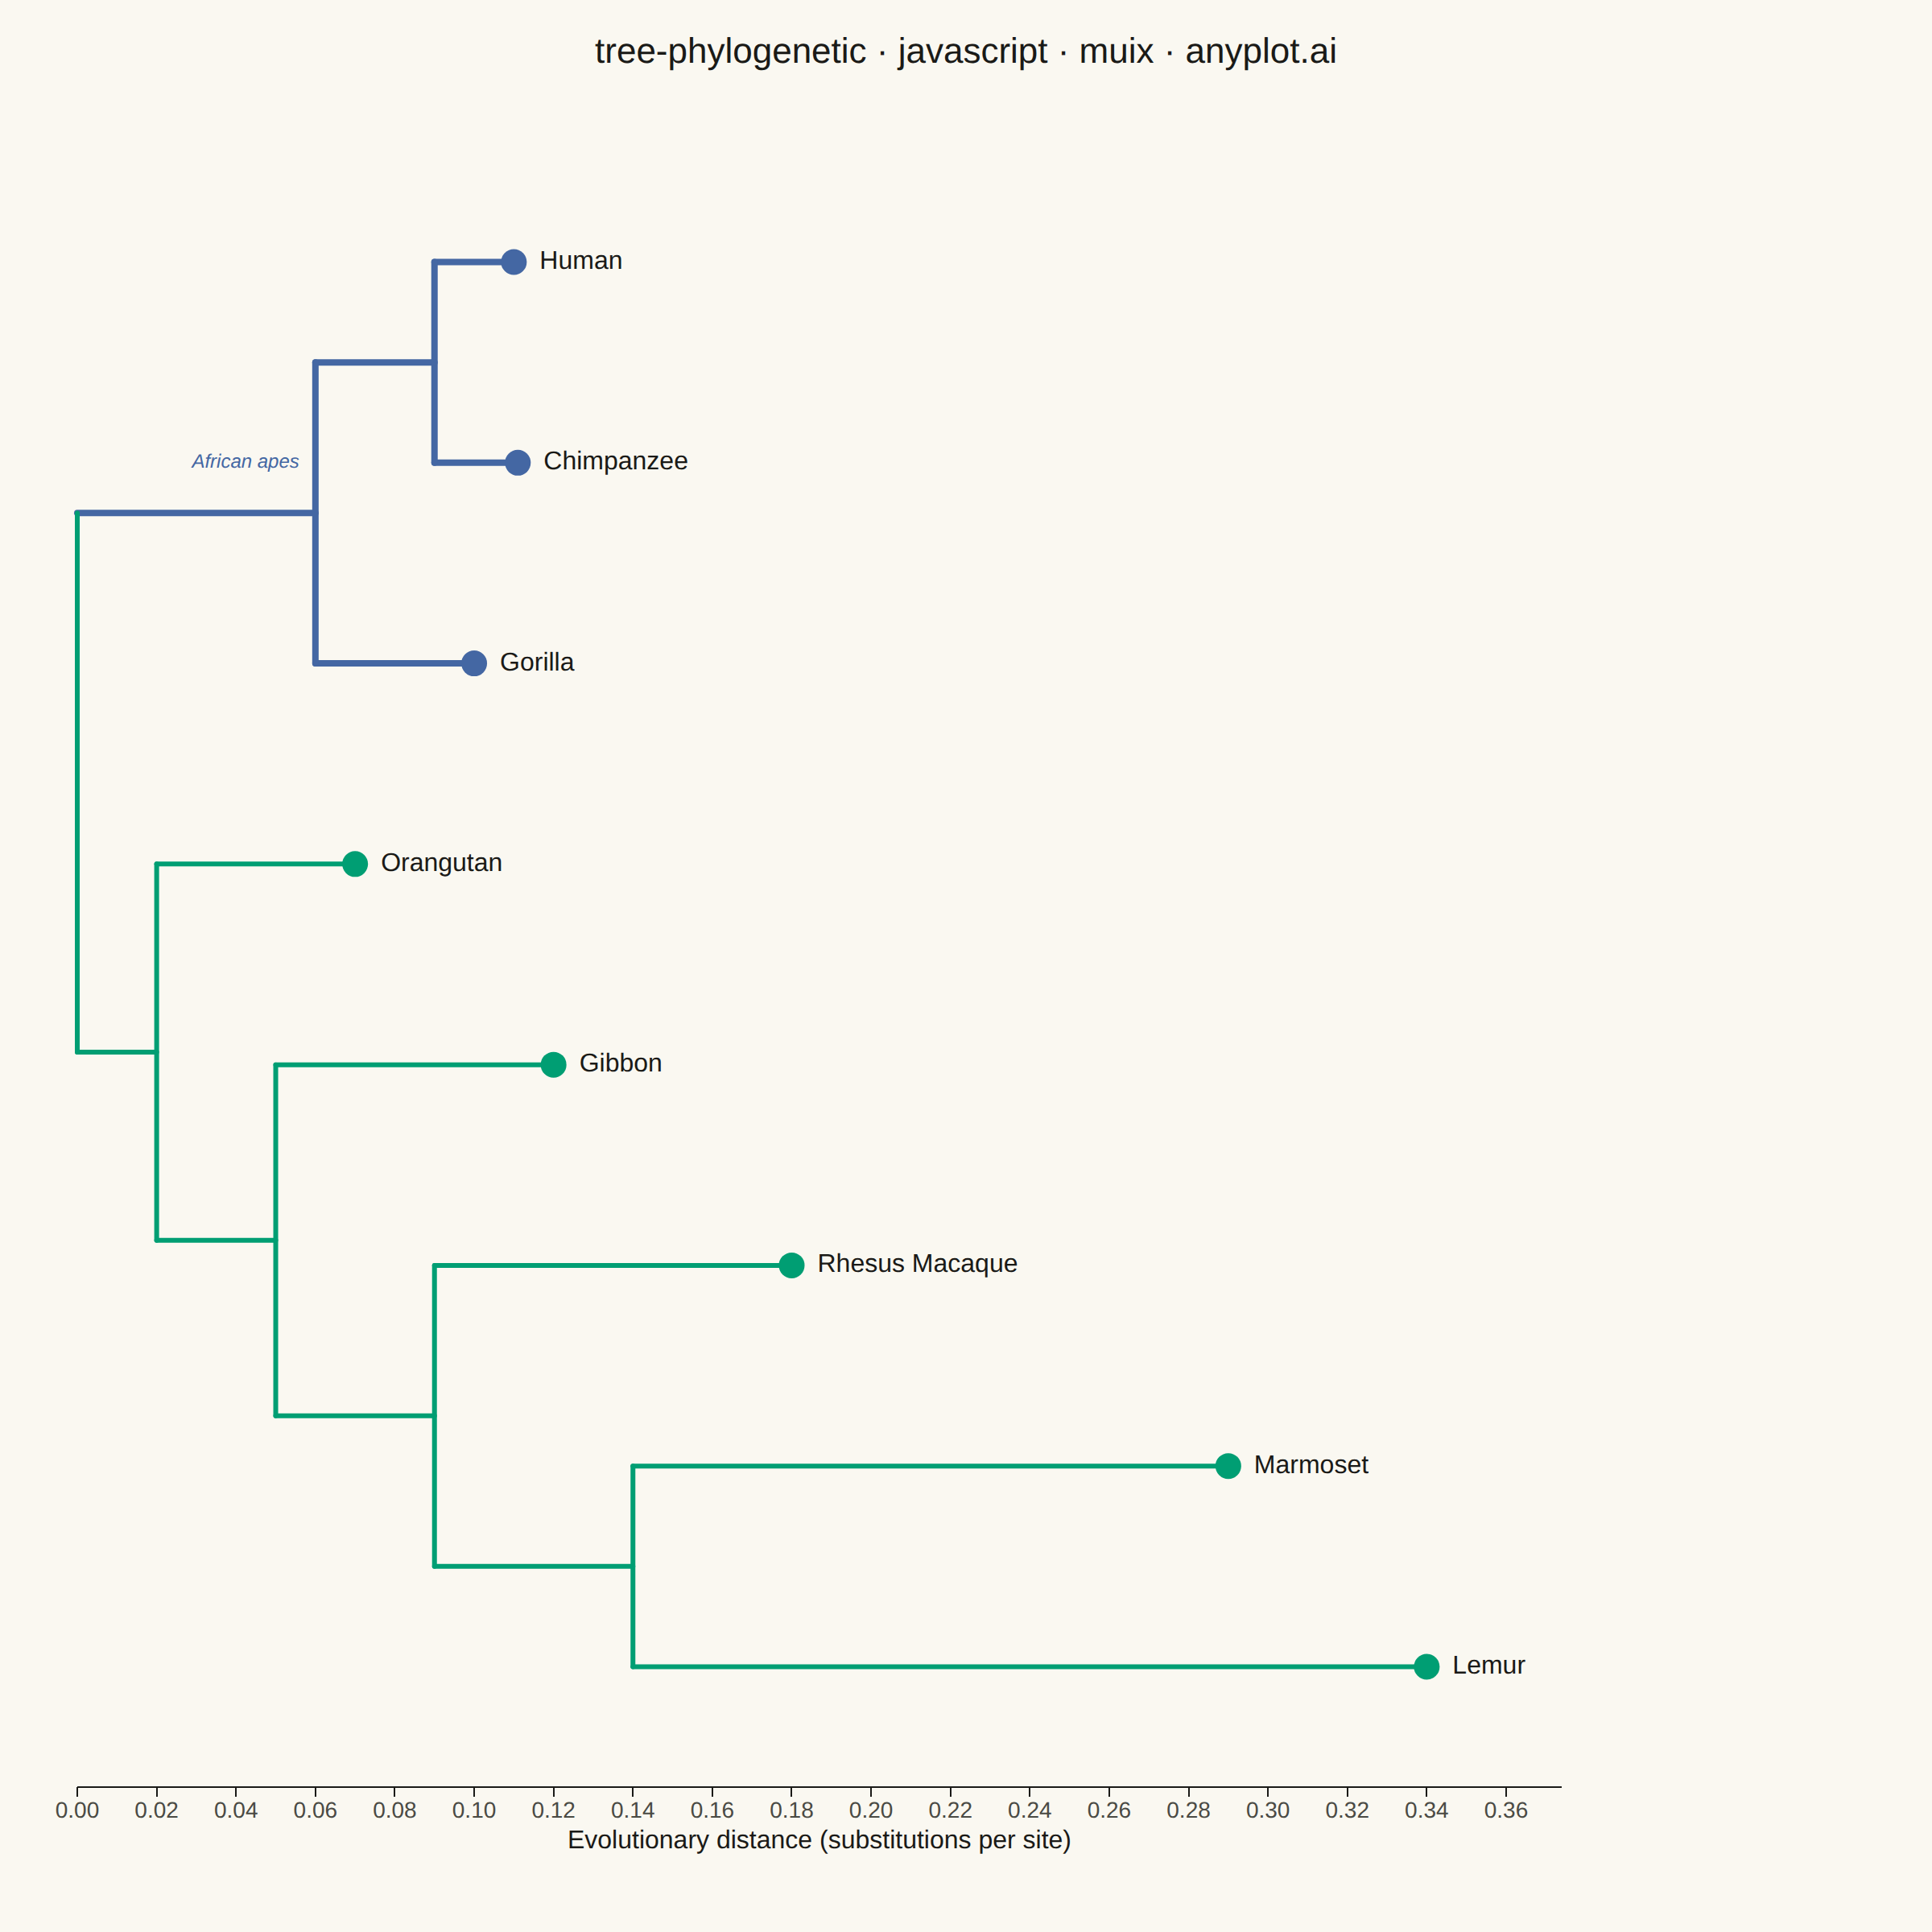
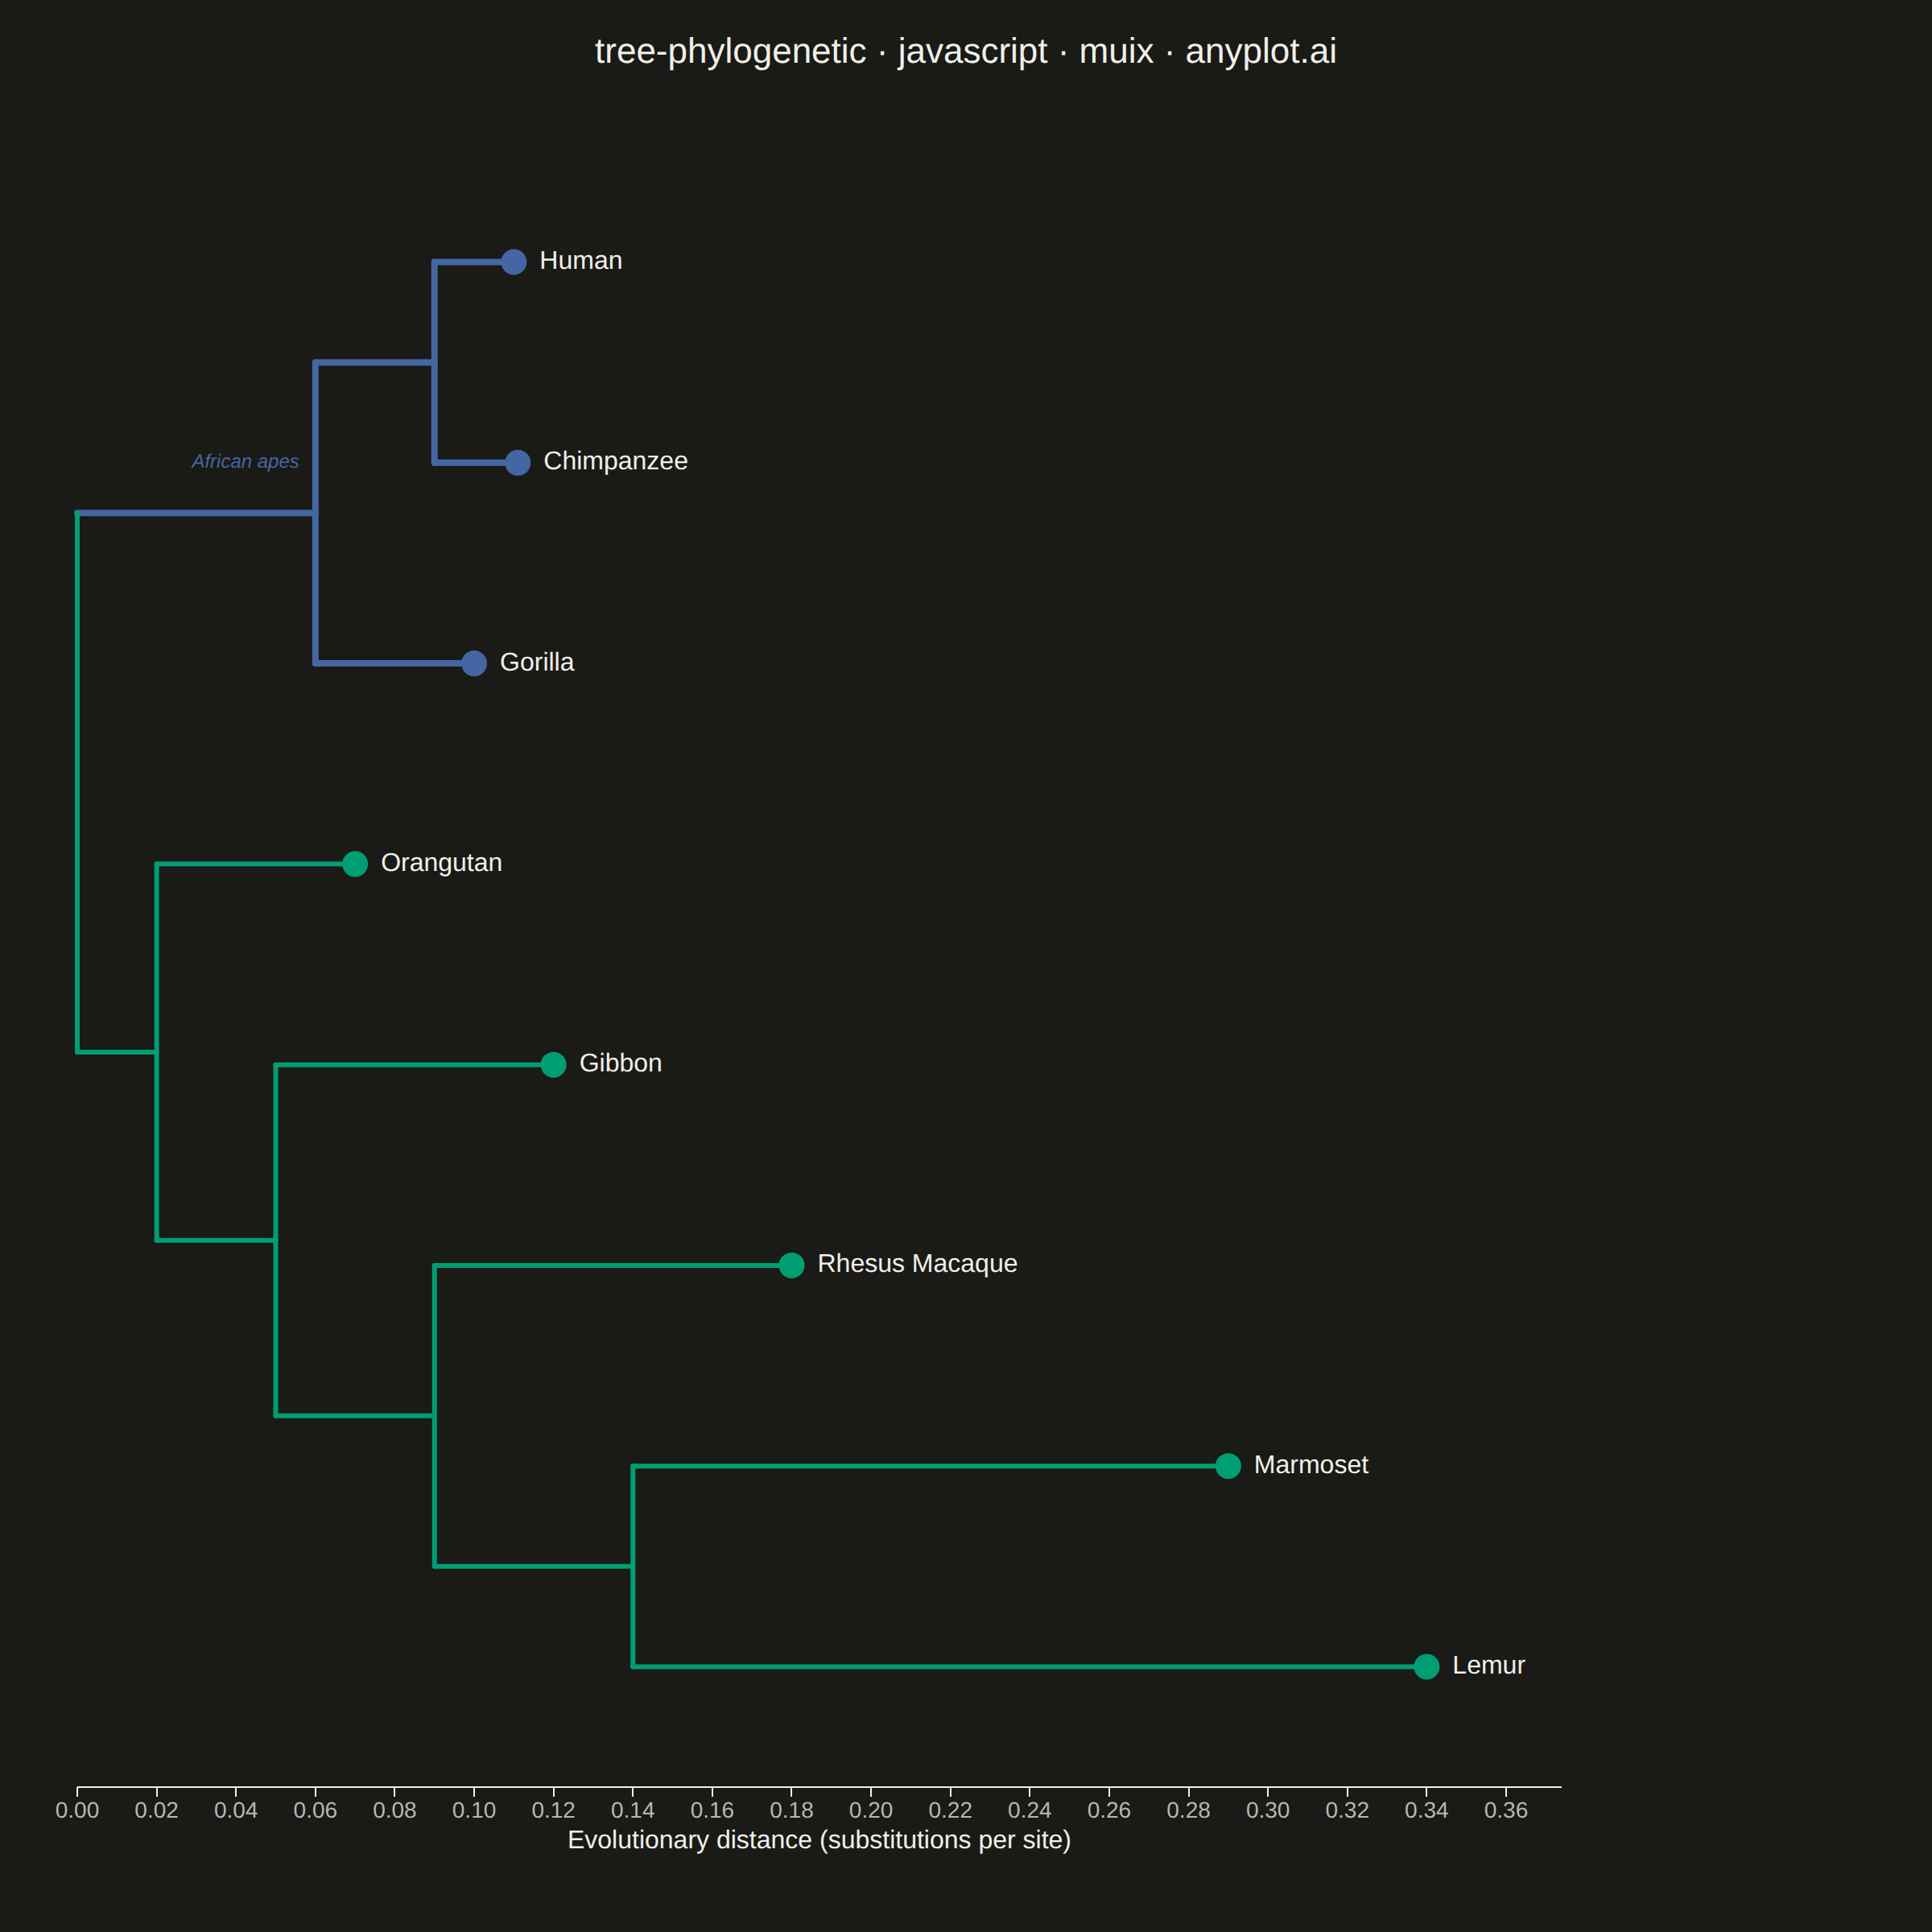
A phylogenetic tree (evolutionary tree) visualization showing hierarchical relationships between species or sequences, with branch lengths proportional to evolutionary distance. This diagram reveals how organisms or genes evolved from common ancestors, with longer branches indicating greater divergence. Phylogenetic trees are essential for understanding evolutionary history, taxonomy, and molecular biology relationships.
// anyplot.ai
// tree-phylogenetic: Phylogenetic Tree Diagram
// Library: muix 7.29.1 | JavaScript 22.23.2
// Quality: 88/100 | Created: 2026-09-09
//# anyplot-orientation: square
import { ChartContainer } from "@mui/x-charts/ChartContainer";
import { ScatterPlot } from "@mui/x-charts/ScatterChart";
import { ChartsXAxis } from "@mui/x-charts/ChartsXAxis";
import { useXScale, useYScale } from "@mui/x-charts/hooks";

const t = window.ANYPLOT_TOKENS;

// --- Data: a primate mitochondrial-DNA phylogeny (in-memory, deterministic).
// Nested objects mirror a Newick tree — each node's `length` is its branch
// length (substitutions per site) above its parent; leaves carry `name`. The
// Human/Chimpanzee/Gorilla node carries a `clade` tag so its subtree can be
// highlighted as a distinct lineage. --------------------------------------
const HIGHLIGHT_CLADE = "homininae";
const tree = {
  length: 0,
  children: [
    {
      length: 0.06,
      clade: HIGHLIGHT_CLADE,
      children: [
        {
          length: 0.03,
          children: [
            { name: "Human", length: 0.02 },
            { name: "Chimpanzee", length: 0.021 },
          ],
        },
        { name: "Gorilla", length: 0.04 },
      ],
    },
    {
      length: 0.02,
      children: [
        { name: "Orangutan", length: 0.05 },
        {
          length: 0.03,
          children: [
            { name: "Gibbon", length: 0.07 },
            {
              length: 0.04,
              children: [
                { name: "Rhesus Macaque", length: 0.09 },
                {
                  length: 0.05,
                  children: [
                    { name: "Marmoset", length: 0.15 },
                    { name: "Lemur", length: 0.2 },
                  ],
                },
              ],
            },
          ],
        },
      ],
    },
  ],
};

// --- Rectangular-cladogram layout: x is the cumulative branch length from
// the root (evolutionary distance), y is an evenly spaced slot per leaf, and
// each internal node sits at the mean y of its children. A horizontal branch
// carries each child out to its own x; a vertical connector at the parent's x
// joins the children's y range, giving the classic elbowed tree shape. Each
// node inherits `clade` from its parent unless it declares its own. --------
let nextLeafSlot = 0;
const leaves = [];
const branches = [];

function layout(node, parentX, inheritedClade) {
  const clade = node.clade ?? inheritedClade;
  const x = parentX + node.length;
  node.x = x;
  if (!node.children) {
    node.y = nextLeafSlot;
    nextLeafSlot += 1;
    leaves.push({ name: node.name, x, y: node.y, clade });
    return;
  }
  node.children.forEach((child) => {
    layout(child, x, clade);
    branches.push({ x1: x, y1: child.y, x2: child.x, y2: child.y, clade: child.clade ?? clade });
  });
  const childYs = node.children.map((child) => child.y);
  node.y = (Math.min(...childYs) + Math.max(...childYs)) / 2;
  branches.push({ x1: x, y1: Math.min(...childYs), x2: x, y2: Math.max(...childYs), clade });
}
layout(tree, 0, undefined);

const maxDistance = Math.max(...leaves.map((leaf) => leaf.x));
const xDomainMax = maxDistance * 1.1;
const leafCount = leaves.length;

const cladeLeaves = leaves.filter((leaf) => leaf.clade === HIGHLIGHT_CLADE);
const otherLeaves = leaves.filter((leaf) => leaf.clade !== HIGHLIGHT_CLADE);
const cladeOriginX = tree.children[0].x;
const cladeLabelY = (Math.min(...cladeLeaves.map((l) => l.y)) + Math.max(...cladeLeaves.map((l) => l.y))) / 2;

const TITLE = "tree-phylogenetic · javascript · muix · anyplot.ai";
const TITLE_HEIGHT = 64;
// Square canvas gives 8 sparse leaf rows more vertical room per row than a
// wide landscape frame would, so the short-branch rows read as a balanced
// composition instead of mostly empty space.
const MARGIN = { top: 24, right: 230, bottom: 90, left: 48 };

// --- Custom overlay: branch lines, tip markers, leaf labels, and a clade
// callout — all mapped through the chart's own linear scales so everything
// stays pixel-aligned at any render size. ------------------------------------
function BranchLayer() {
  const xScale = useXScale();
  const yScale = useYScale();

  return (
    <g>
      {branches.map((b, i) => (
        <line
          key={i}
          x1={xScale(b.x1)}
          y1={yScale(b.y1)}
          x2={xScale(b.x2)}
          y2={yScale(b.y2)}
          stroke={b.clade === HIGHLIGHT_CLADE ? t.palette[2] : t.palette[0]}
          strokeWidth={b.clade === HIGHLIGHT_CLADE ? 4 : 3}
          strokeLinecap="round"
        />
      ))}
      {leaves.map((leaf) => (
        <text
          key={leaf.name}
          x={xScale(leaf.x) + 16}
          y={yScale(leaf.y)}
          dominantBaseline="middle"
          textAnchor="start"
          fontSize={16}
          fill={t.ink}
        >
          {leaf.name}
        </text>
      ))}
      <text
        x={xScale(cladeOriginX) - 10}
        y={yScale(cladeLabelY)}
        dominantBaseline="middle"
        textAnchor="end"
        fontSize={12}
        fontStyle="italic"
        fill={t.palette[2]}
      >
        African apes
      </text>
    </g>
  );
}

// --- Chart (default-exported component — the harness mounts it) -------------
export default function Chart() {
  const { width, height } = window.ANYPLOT_SIZE;

  return (
    <div style={{ width, height, display: "flex", flexDirection: "column" }}>
      <div
        style={{
          height: TITLE_HEIGHT,
          display: "flex",
          alignItems: "center",
          justifyContent: "center",
          fontSize: 22,
          fontWeight: 500,
          color: t.ink,
        }}
      >
        {TITLE}
      </div>
      <ChartContainer
        width={width}
        height={height - TITLE_HEIGHT}
        margin={MARGIN}
        skipAnimation
        xAxis={[{ id: "distance", scaleType: "linear", min: 0, max: xDomainMax }]}
        yAxis={[{ id: "leaf", scaleType: "linear", min: -0.6, max: leafCount - 0.4, reverse: true }]}
        series={[
          {
            type: "scatter",
            id: "leaves",
            data: otherLeaves.map((leaf, i) => ({ x: leaf.x, y: leaf.y, id: `leaf-${i}` })),
            color: t.palette[0],
            markerSize: 8,
          },
          {
            type: "scatter",
            id: "clade-leaves",
            data: cladeLeaves.map((leaf, i) => ({ x: leaf.x, y: leaf.y, id: `clade-leaf-${i}` })),
            color: t.palette[2],
            markerSize: 8,
          },
        ]}
      >
        <BranchLayer />
        <ScatterPlot />
        <ChartsXAxis
          axisId="distance"
          label="Evolutionary distance (substitutions per site)"
          labelStyle={{ fontSize: 16, fill: t.ink }}
          tickLabelStyle={{ fontSize: 14, fill: t.inkSoft }}
        />
      </ChartContainer>
    </div>
  );
}
Runnable source as JSON, for any HTTP client: https://api.anyplot.ai/specs/tree-phylogenetic/muix/code. Any spec id and library id listed in llms-full.txt fit the same URL shape; every URL below is complete and callable.
{
  "spec_id": "tree-phylogenetic",
  "language": "javascript",
  "library": "muix",
  "page": "https://anyplot.ai/tree-phylogenetic/javascript/muix",
  "hub": "https://anyplot.ai/tree-phylogenetic",
  "code_json": "https://api.anyplot.ai/specs/tree-phylogenetic/muix/code",
  "spec_json": "https://api.anyplot.ai/specs/tree-phylogenetic",
  "render_light_png": "https://storage.googleapis.com/anyplot-images/plots/tree-phylogenetic/javascript/muix/plot-light.png",
  "render_dark_png": "https://storage.googleapis.com/anyplot-images/plots/tree-phylogenetic/javascript/muix/plot-dark.png",
  "interactive_light_html": "https://storage.googleapis.com/anyplot-images/plots/tree-phylogenetic/javascript/muix/plot-light.html",
  "interactive_dark_html": "https://storage.googleapis.com/anyplot-images/plots/tree-phylogenetic/javascript/muix/plot-dark.html",
  "quality_score": 88.0,
  "license": "MIT",
  "guide": "https://anyplot.ai/llms.txt"
}
Part of Phylogenetic Tree Diagram on anyplot.ai.