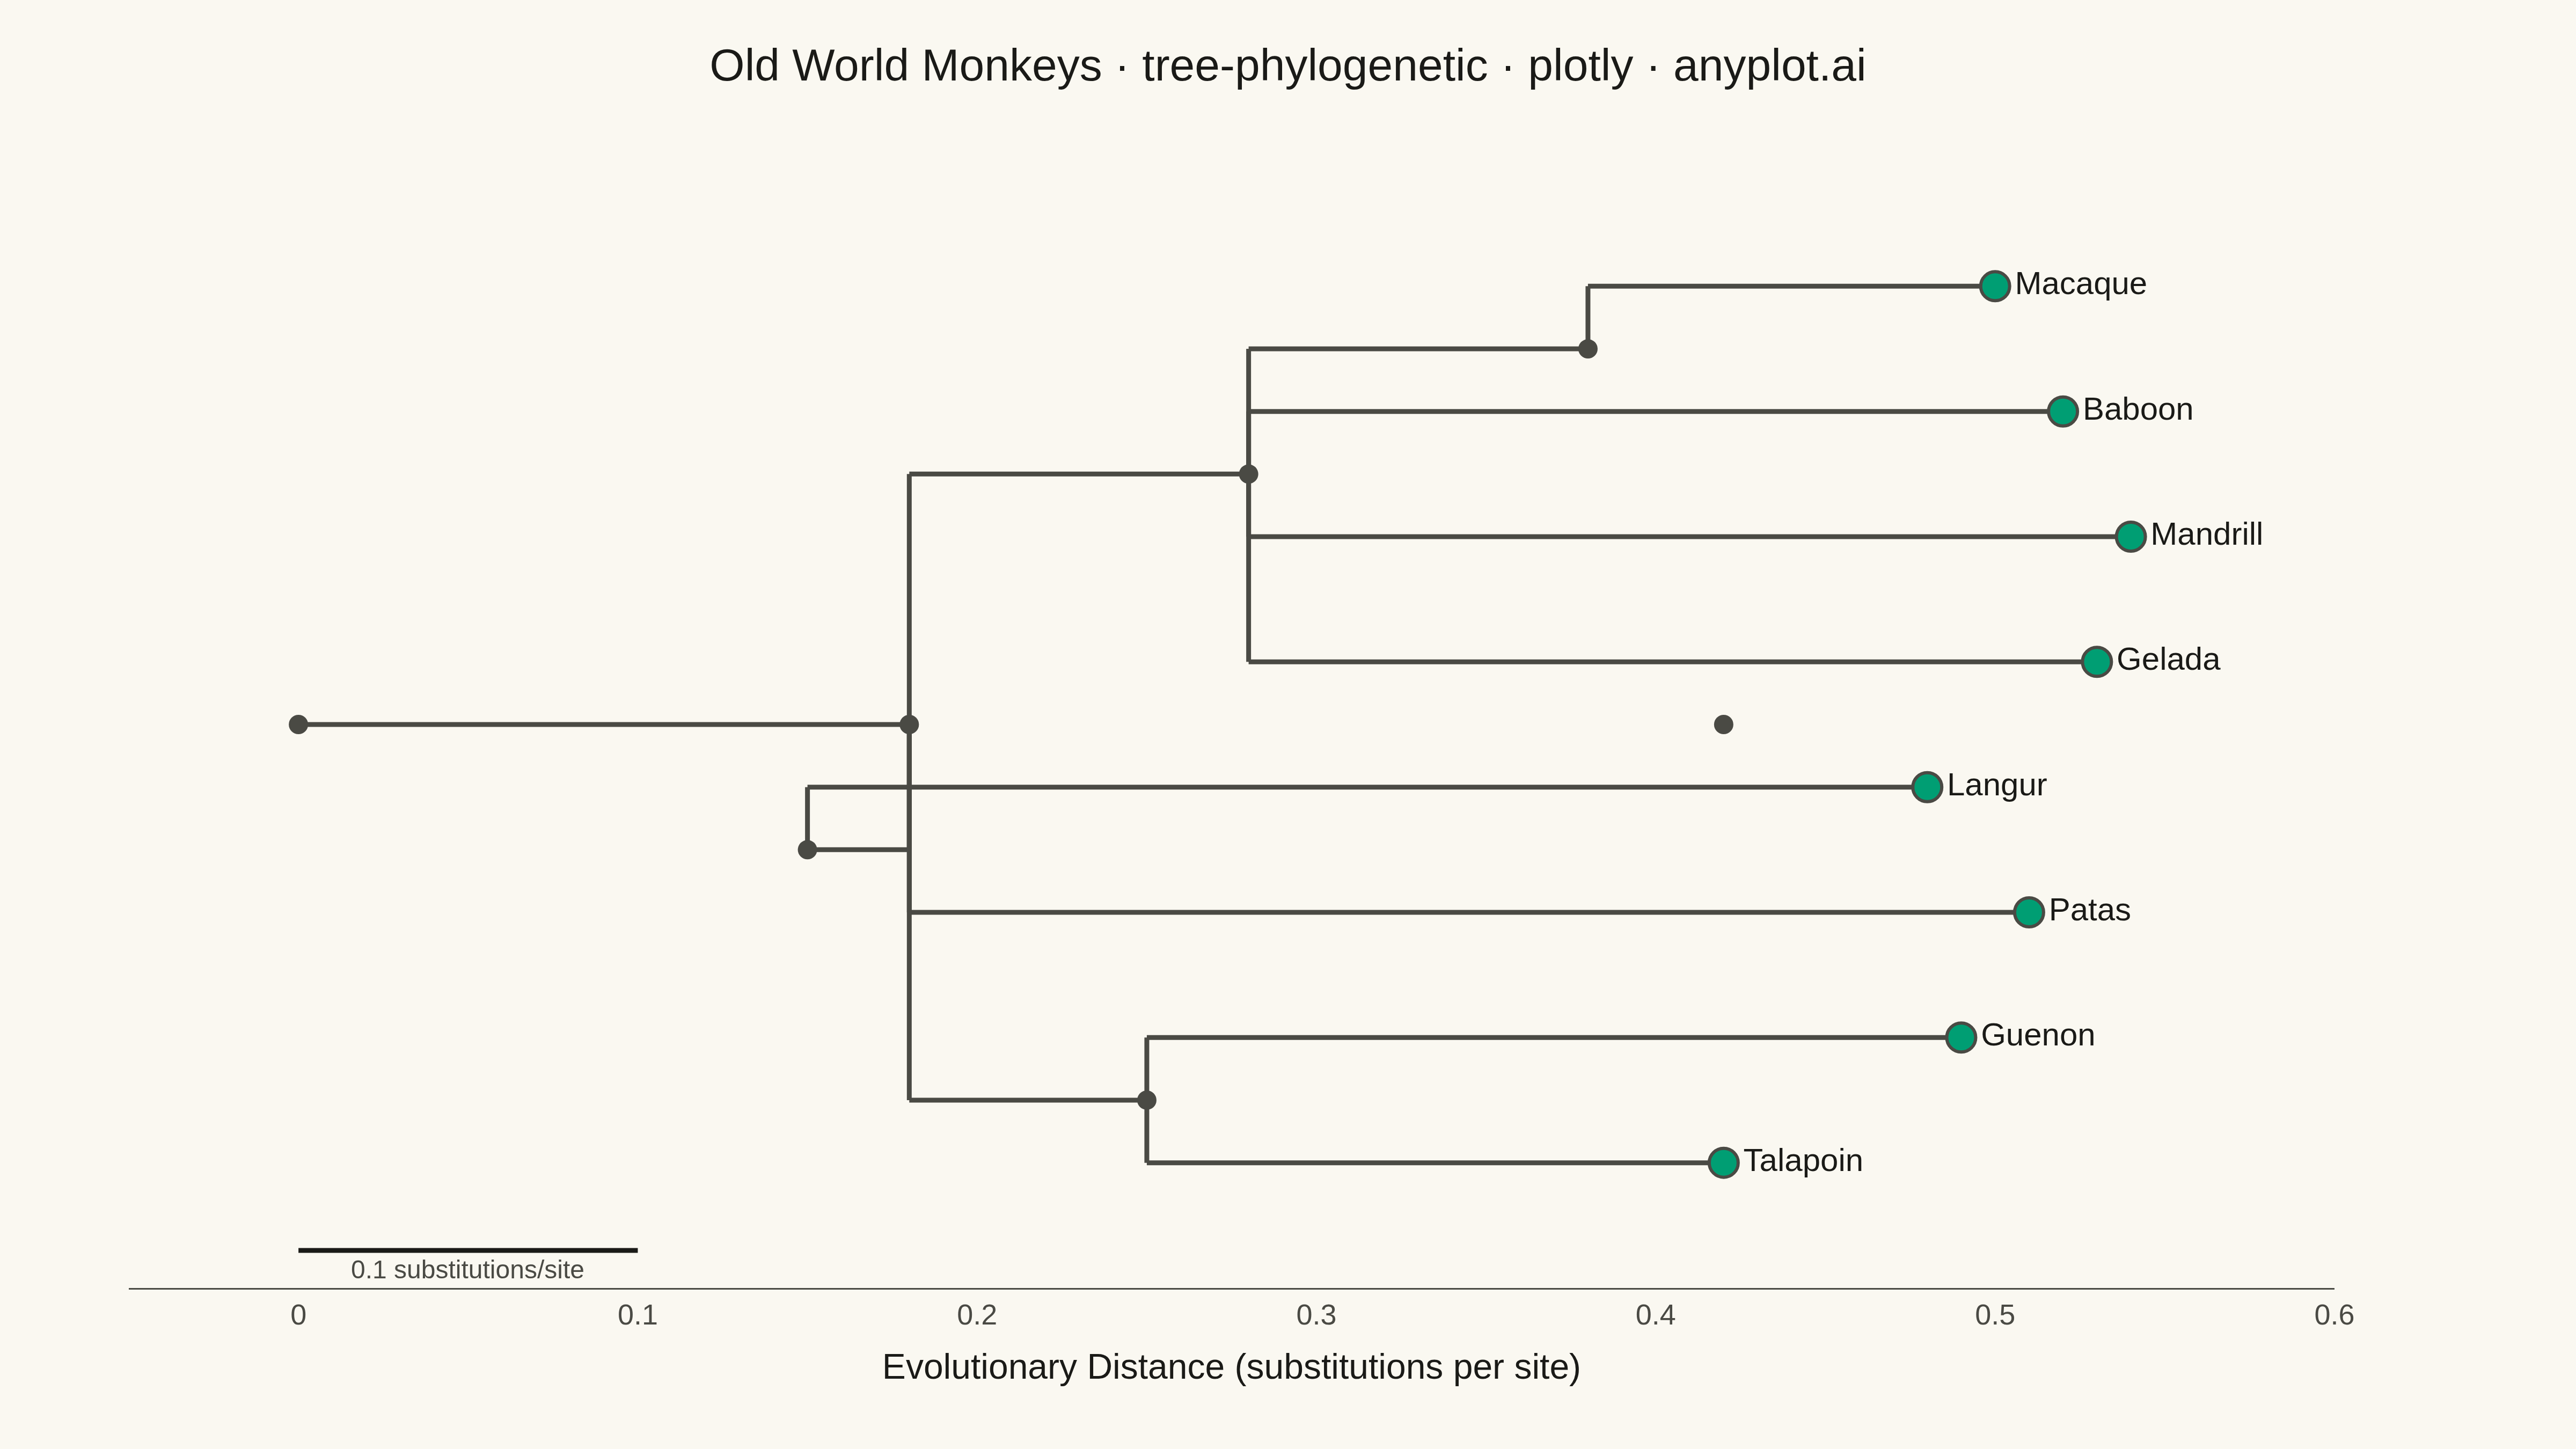
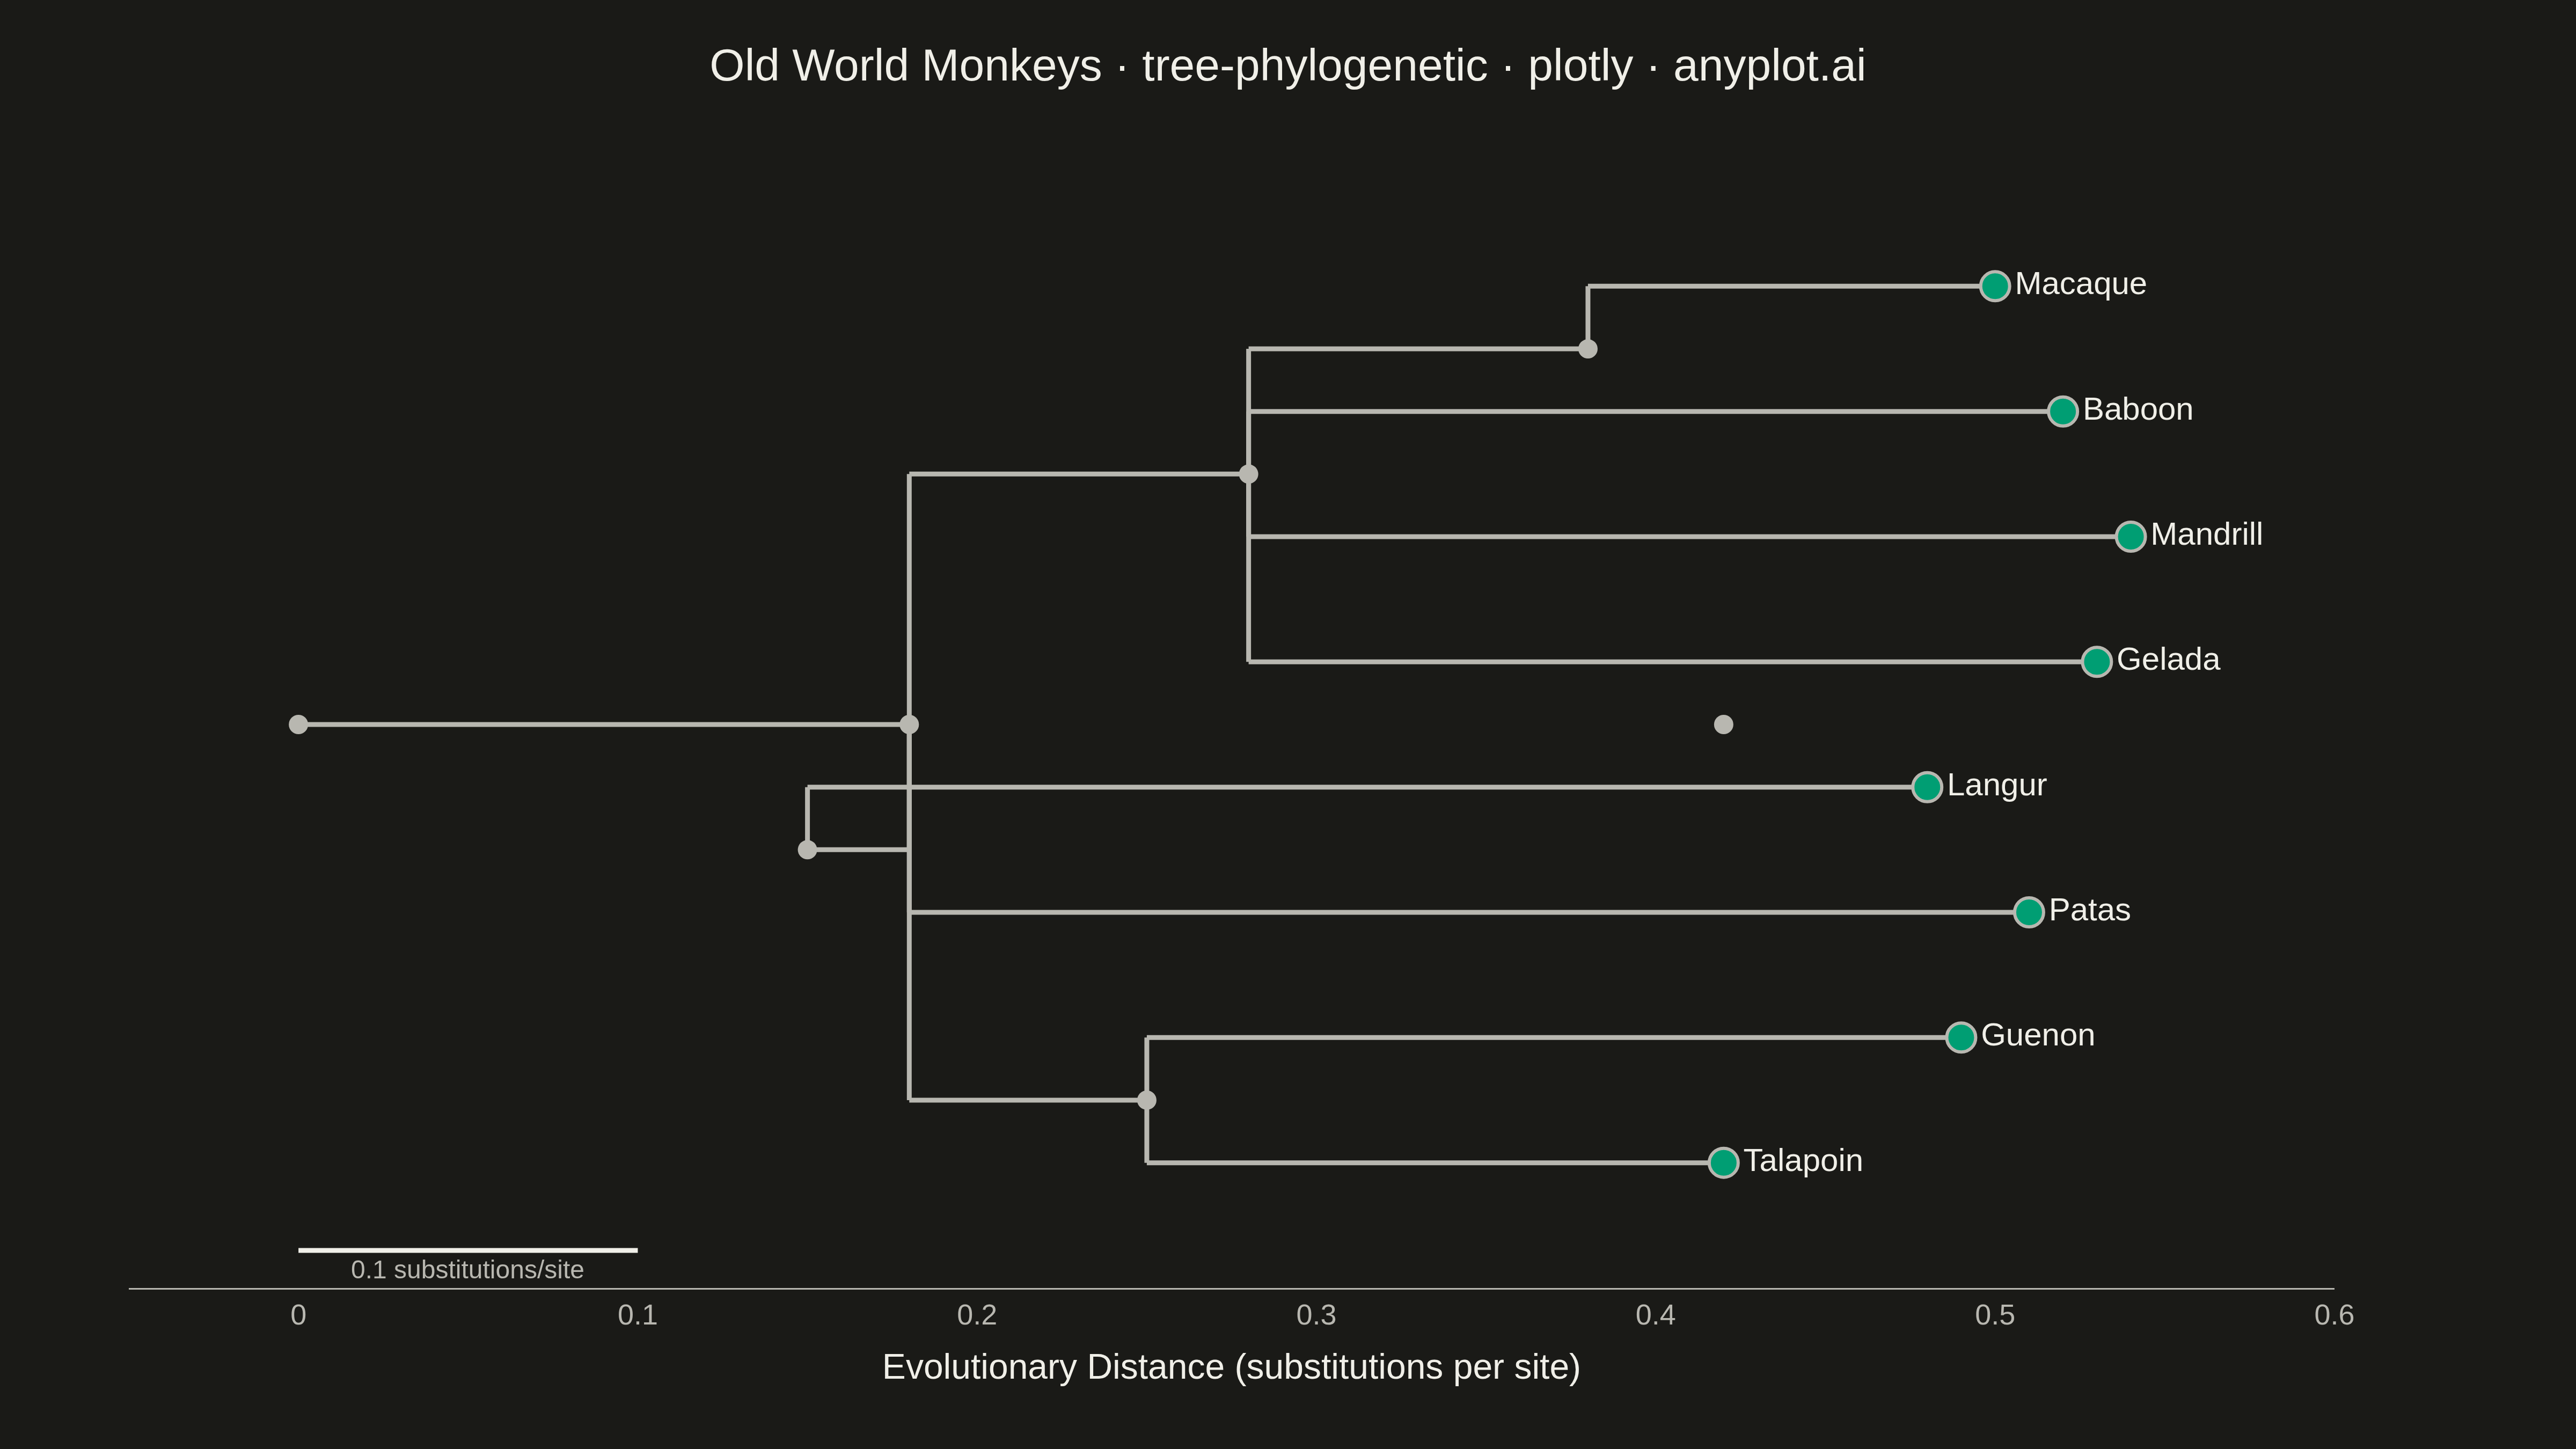
A phylogenetic tree (evolutionary tree) visualization showing hierarchical relationships between species or sequences, with branch lengths proportional to evolutionary distance. This diagram reveals how organisms or genes evolved from common ancestors, with longer branches indicating greater divergence. Phylogenetic trees are essential for understanding evolutionary history, taxonomy, and molecular biology relationships.
""" anyplot.ai
tree-phylogenetic: Phylogenetic Tree Diagram
Library: plotly 6.7.0 | Python 3.13.13
Quality: 91/100 | Updated: 2026-05-15
"""

import os
import sys

# Fix import conflict: remove current directory from sys.path
_script_dir = os.path.dirname(os.path.abspath(__file__))
sys.path = [p for p in sys.path if os.path.abspath(p) != _script_dir]

import plotly.graph_objects as go


# Theme tokens
THEME = os.getenv("ANYPLOT_THEME", "light")
PAGE_BG = "#FAF8F1" if THEME == "light" else "#1A1A17"
INK = "#1A1A17" if THEME == "light" else "#F0EFE8"
INK_SOFT = "#4A4A44" if THEME == "light" else "#B8B7B0"
GRID = "rgba(26,26,23,0.10)" if THEME == "light" else "rgba(240,239,232,0.10)"
BRAND = "#009E73"  # Okabe-Ito position 1

# Old World monkeys phylogenetic tree based on mitochondrial DNA
# Diverse group showing 8 species with varying evolutionary distances

species = ["Macaque", "Baboon", "Mandrill", "Gelada", "Langur", "Patas", "Guenon", "Talapoin"]

# Cumulative distances from root for rectangular phylogram
distances_from_root = {
    "Macaque": 0.5,
    "Baboon": 0.52,
    "Mandrill": 0.54,
    "Gelada": 0.53,
    "Langur": 0.48,
    "Patas": 0.51,
    "Guenon": 0.49,
    "Talapoin": 0.42,
}

# Internal node positions
internal_x = {
    "Root": 0.0,
    "Cercopithecinae": 0.18,
    "Papionini": 0.28,
    "Macaque_group": 0.38,
    "Baboon_group": 0.42,
    "Colobinae": 0.15,
    "Guenon_group": 0.25,
}

# Y positions for species (leaf nodes)
species_y = {"Macaque": 8, "Baboon": 7, "Mandrill": 6, "Gelada": 5, "Langur": 4, "Patas": 3, "Guenon": 2, "Talapoin": 1}

# Y positions for internal nodes
internal_y = {
    "Macaque_group": (species_y["Macaque"] + species_y["Baboon"]) / 2,
    "Papionini": (species_y["Macaque"] + species_y["Baboon"] + species_y["Mandrill"] + species_y["Gelada"]) / 4,
    "Cercopithecinae": (
        (species_y["Macaque"] + species_y["Baboon"] + species_y["Mandrill"] + species_y["Gelada"]) / 4
        + (species_y["Langur"] + species_y["Patas"] + species_y["Guenon"] + species_y["Talapoin"]) / 4
    )
    / 2,
    "Colobinae": (species_y["Langur"] + species_y["Patas"]) / 2,
    "Guenon_group": (species_y["Guenon"] + species_y["Talapoin"]) / 2,
    "Root": 4.5,
}

# Tree structure connections
connections = [
    ("Macaque", "Macaque_group"),
    ("Baboon", "Papionini"),
    ("Mandrill", "Papionini"),
    ("Gelada", "Papionini"),
    ("Macaque_group", "Papionini"),
    ("Langur", "Colobinae"),
    ("Patas", "Cercopithecinae"),
    ("Guenon", "Guenon_group"),
    ("Talapoin", "Guenon_group"),
    ("Colobinae", "Cercopithecinae"),
    ("Guenon_group", "Cercopithecinae"),
    ("Papionini", "Cercopithecinae"),
    ("Cercopithecinae", "Root"),
]

# Create edge traces for rectangular phylogram
edge_x = []
edge_y = []

for child, parent in connections:
    child_x = distances_from_root[child] if child in species else internal_x[child]
    child_y = species_y[child] if child in species else internal_y[child]

    parent_x = internal_x[parent]
    parent_y = internal_y[parent]

    # Horizontal line
    edge_x.extend([child_x, parent_x, None])
    edge_y.extend([child_y, child_y, None])

    # Vertical line
    edge_x.extend([parent_x, parent_x, None])
    edge_y.extend([child_y, parent_y, None])

# Create figure
fig = go.Figure()

# Add branch lines
fig.add_trace(
    go.Scatter(
        x=edge_x, y=edge_y, mode="lines", line={"color": INK_SOFT, "width": 3}, hoverinfo="skip", showlegend=False
    )
)

# Add leaf nodes (species)
leaf_x = [distances_from_root[s] for s in species]
leaf_y = [species_y[s] for s in species]

fig.add_trace(
    go.Scatter(
        x=leaf_x,
        y=leaf_y,
        mode="markers+text",
        marker={"size": 18, "color": BRAND, "line": {"width": 2, "color": INK_SOFT}},
        text=species,
        textposition="middle right",
        textfont={"size": 20, "color": INK},
        hovertemplate="%{text}<br>Distance: %{x:.2f}<extra></extra>",
        showlegend=False,
    )
)

# Add internal nodes
internal_nodes_x = list(internal_x.values())
internal_nodes_y = [internal_y.get(n, 4.5) for n in internal_x.keys()]
internal_labels = list(internal_x.keys())

fig.add_trace(
    go.Scatter(
        x=internal_nodes_x,
        y=internal_nodes_y,
        mode="markers",
        marker={"size": 12, "color": INK_SOFT, "symbol": "circle"},
        hovertemplate="%{text}<br>Distance: %{x:.2f}<extra></extra>",
        text=internal_labels,
        showlegend=False,
    )
)

# Add scale bar
scale_bar_y = 0.3
scale_bar_length = 0.1
fig.add_trace(
    go.Scatter(
        x=[0, scale_bar_length],
        y=[scale_bar_y, scale_bar_y],
        mode="lines",
        line={"color": INK, "width": 3},
        showlegend=False,
        hoverinfo="skip",
    )
)

# Scale bar label
fig.add_annotation(
    x=scale_bar_length / 2,
    y=scale_bar_y - 0.15,
    text="0.1 substitutions/site",
    showarrow=False,
    font={"size": 16, "color": INK_SOFT},
)

# Update layout
fig.update_layout(
    title={
        "text": "Old World Monkeys · tree-phylogenetic · plotly · anyplot.ai",
        "font": {"size": 28, "color": INK},
        "x": 0.5,
        "xanchor": "center",
    },
    xaxis={
        "title": {"text": "Evolutionary Distance (substitutions per site)", "font": {"size": 22, "color": INK}},
        "tickfont": {"size": 18, "color": INK_SOFT},
        "range": [-0.05, 0.60],
        "showgrid": False,
        "zeroline": False,
        "linecolor": INK_SOFT,
    },
    yaxis={
        "title": {"text": "", "font": {"size": 22}},
        "tickfont": {"size": 18, "color": INK_SOFT},
        "range": [0, 9],
        "showticklabels": False,
        "showgrid": False,
        "zeroline": False,
    },
    plot_bgcolor=PAGE_BG,
    paper_bgcolor=PAGE_BG,
    margin={"l": 80, "r": 150, "t": 100, "b": 100},
    showlegend=False,
)

# Save outputs
fig.write_image(f"plot-{THEME}.png", width=1600, height=900, scale=3)
fig.write_html(f"plot-{THEME}.html", include_plotlyjs="cdn")
Runnable source as JSON, for any HTTP client: https://api.anyplot.ai/specs/tree-phylogenetic/plotly/code. Any spec id and library id listed in llms-full.txt fit the same URL shape; every URL below is complete and callable.
{
  "spec_id": "tree-phylogenetic",
  "language": "python",
  "library": "plotly",
  "page": "https://anyplot.ai/tree-phylogenetic/python/plotly",
  "hub": "https://anyplot.ai/tree-phylogenetic",
  "code_json": "https://api.anyplot.ai/specs/tree-phylogenetic/plotly/code",
  "spec_json": "https://api.anyplot.ai/specs/tree-phylogenetic",
  "render_light_png": "https://storage.googleapis.com/anyplot-images/plots/tree-phylogenetic/python/plotly/plot-light.png",
  "render_dark_png": "https://storage.googleapis.com/anyplot-images/plots/tree-phylogenetic/python/plotly/plot-dark.png",
  "interactive_light_html": "https://storage.googleapis.com/anyplot-images/plots/tree-phylogenetic/python/plotly/plot-light.html",
  "interactive_dark_html": "https://storage.googleapis.com/anyplot-images/plots/tree-phylogenetic/python/plotly/plot-dark.html",
  "quality_score": 91.0,
  "license": "MIT",
  "guide": "https://anyplot.ai/llms.txt"
}
Part of Phylogenetic Tree Diagram on anyplot.ai.