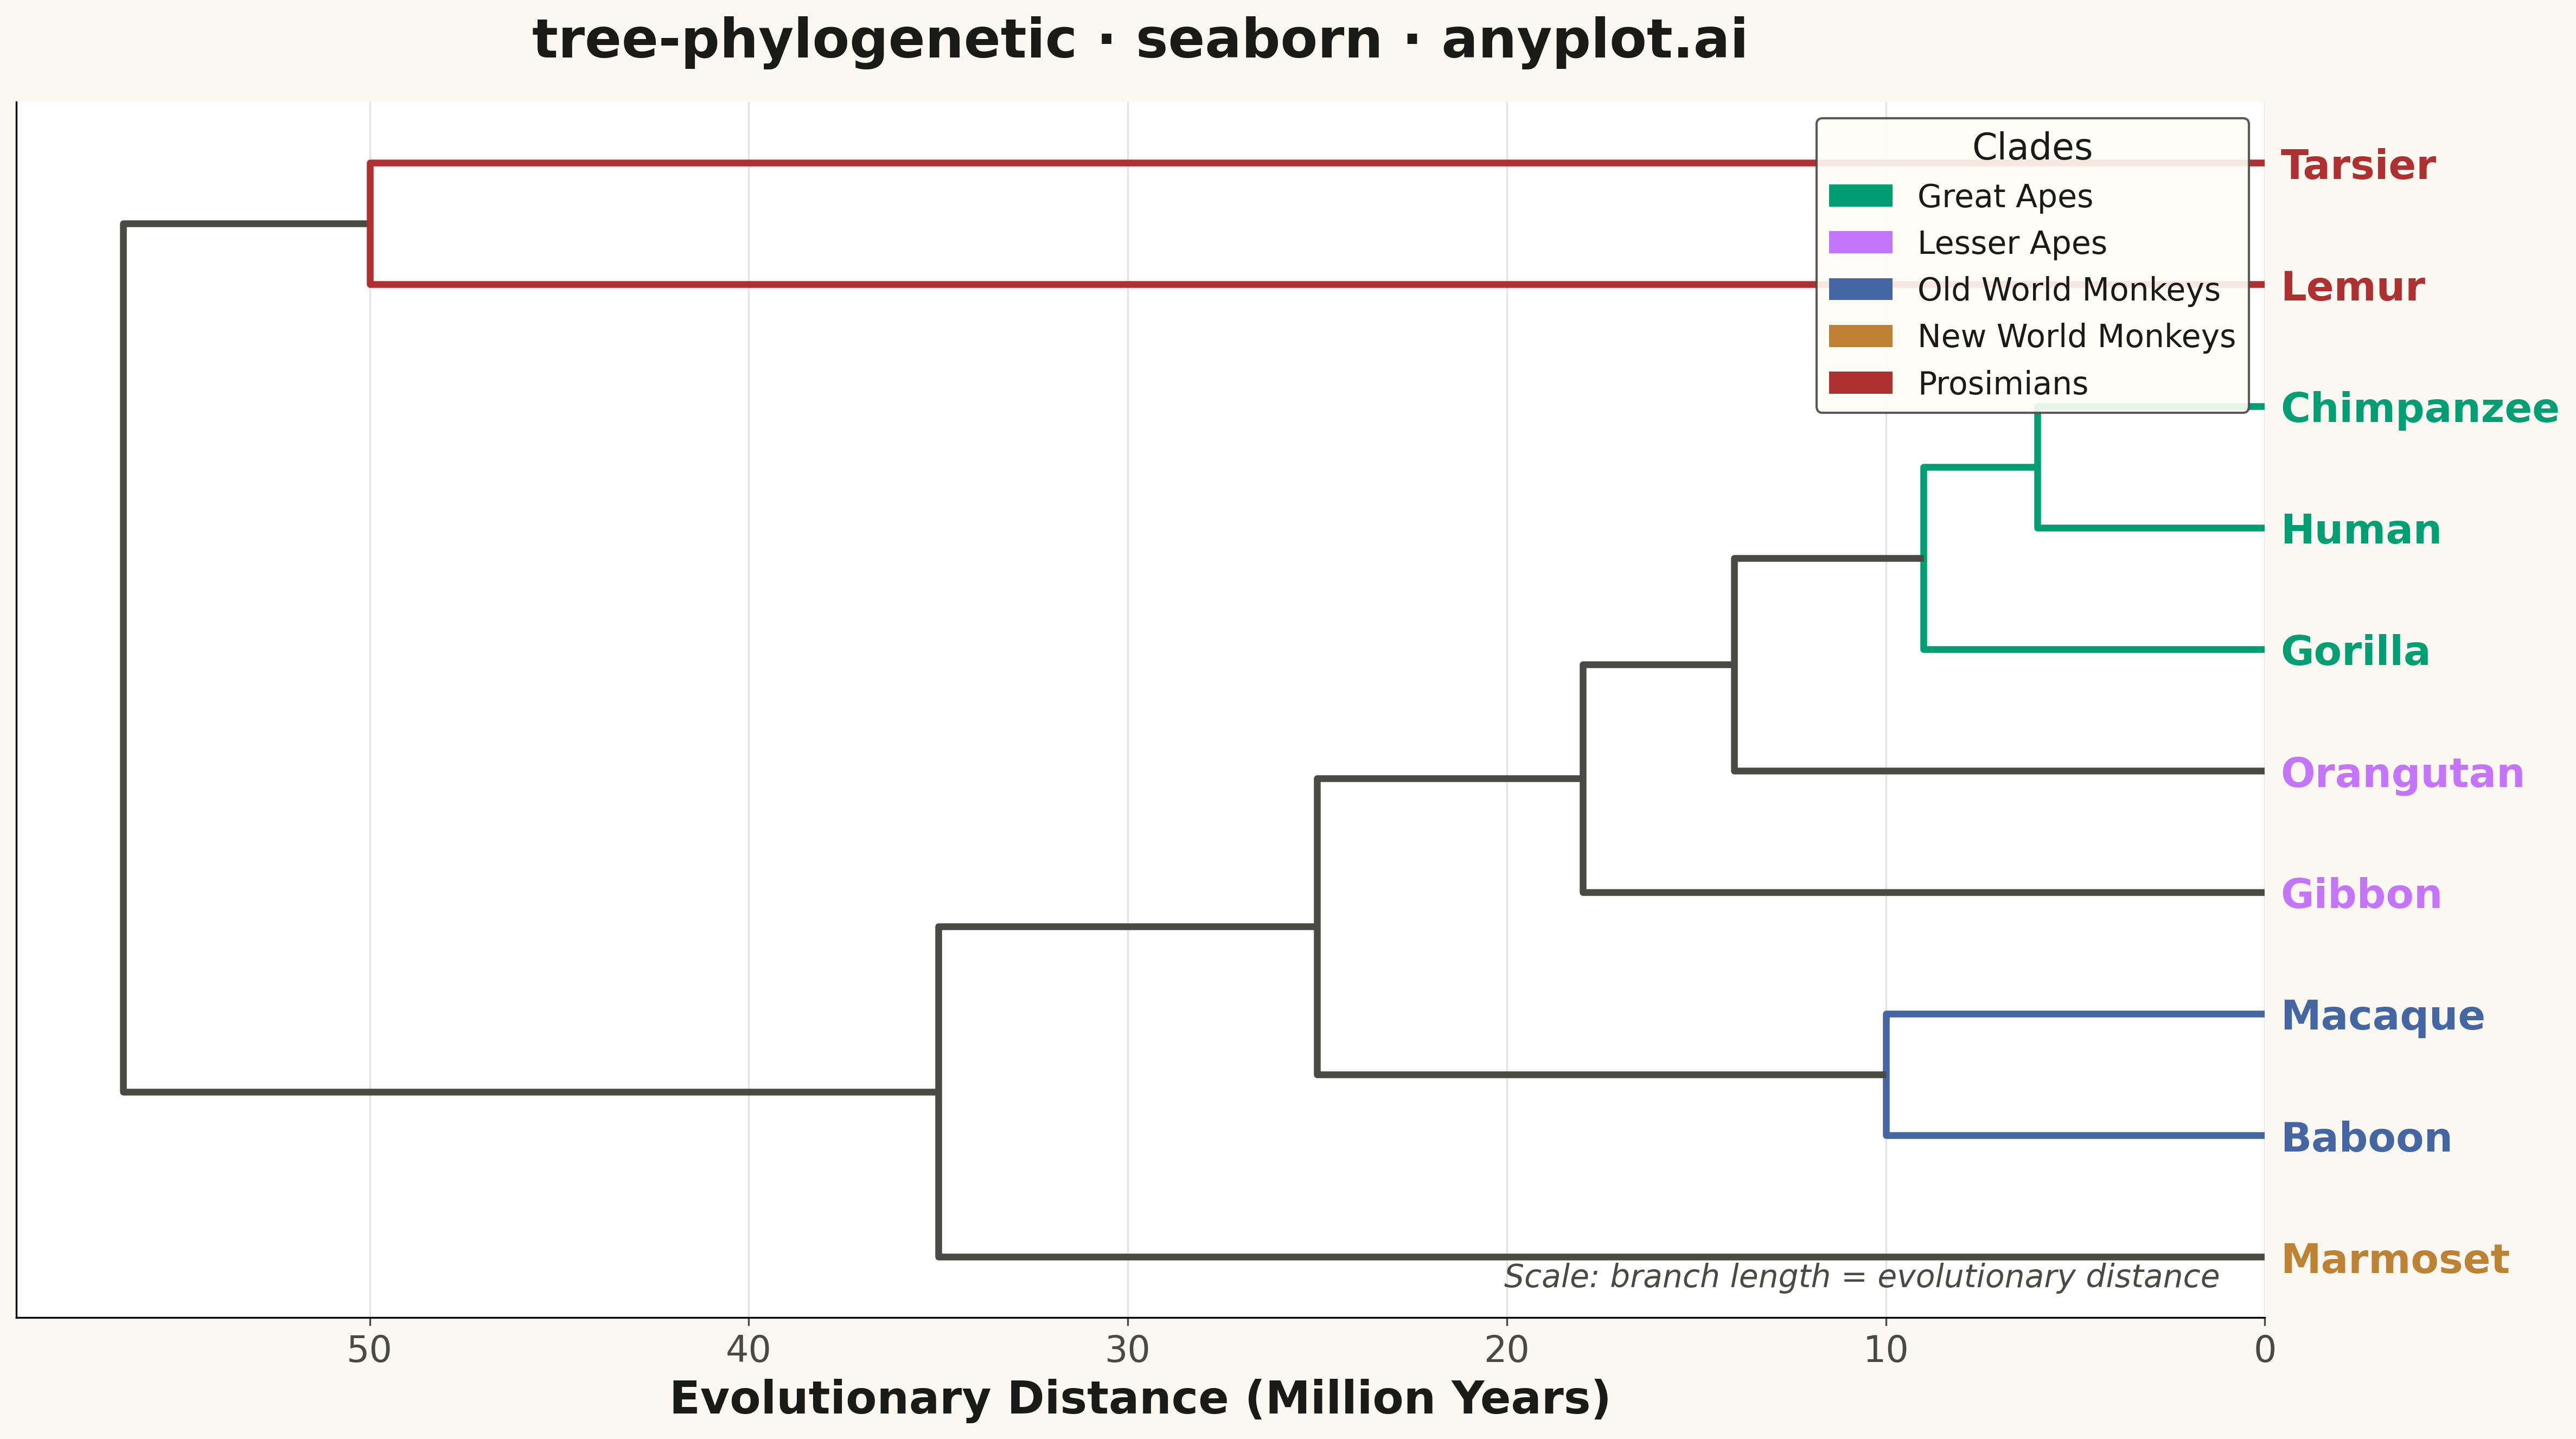
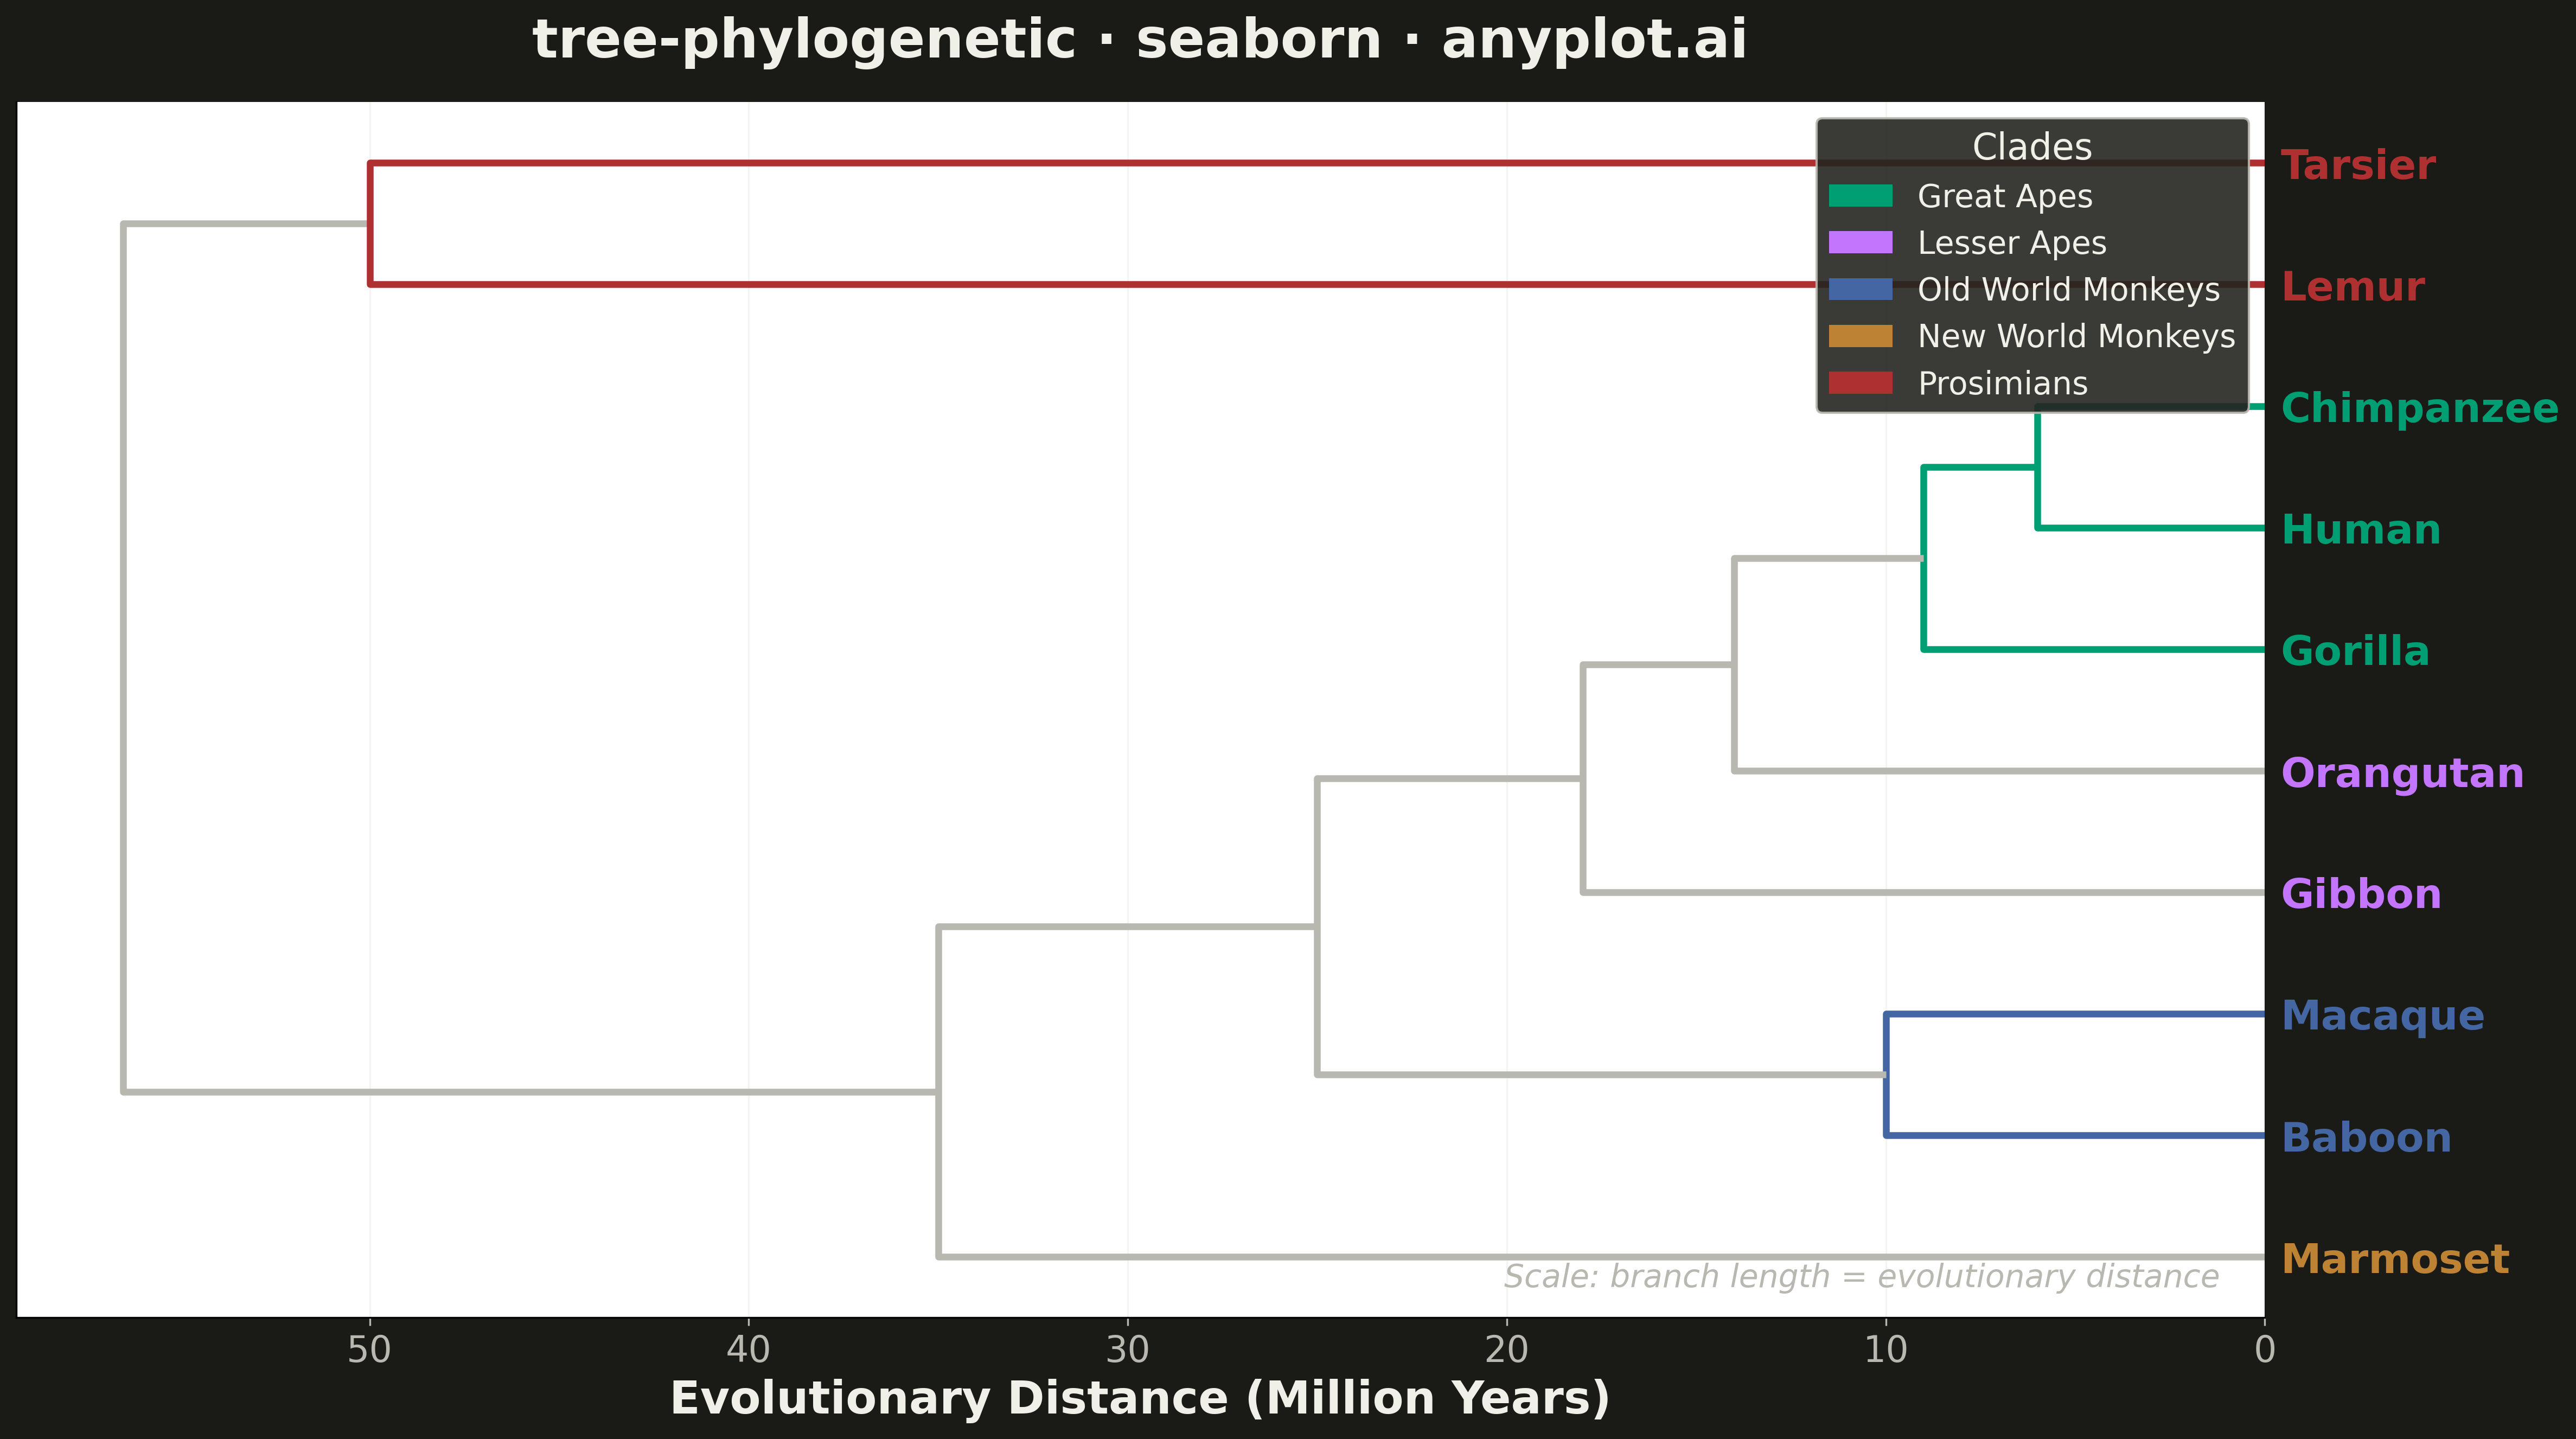
A phylogenetic tree (evolutionary tree) visualization showing hierarchical relationships between species or sequences, with branch lengths proportional to evolutionary distance. This diagram reveals how organisms or genes evolved from common ancestors, with longer branches indicating greater divergence. Phylogenetic trees are essential for understanding evolutionary history, taxonomy, and molecular biology relationships.
""" anyplot.ai
tree-phylogenetic: Phylogenetic Tree Diagram
Library: seaborn 0.13.2 | Python 3.13.13
Quality: 94/100 | Updated: 2026-05-15
"""

import os

import matplotlib.pyplot as plt
import numpy as np
import seaborn as sns
from matplotlib.patches import Patch
from scipy.cluster.hierarchy import dendrogram, linkage
from scipy.spatial.distance import squareform


THEME = os.getenv("ANYPLOT_THEME", "light")
PAGE_BG = "#FAF8F1" if THEME == "light" else "#1A1A17"
ELEVATED_BG = "#FFFDF6" if THEME == "light" else "#242420"
INK = "#1A1A17" if THEME == "light" else "#F0EFE8"
INK_SOFT = "#4A4A44" if THEME == "light" else "#B8B7B0"

# Okabe-Ito palette for 5 clades
IMPRINT = ["#009E73", "#C475FD", "#4467A3", "#BD8233", "#AE3030"]

# Define primate species for phylogenetic tree
species = ["Human", "Chimpanzee", "Gorilla", "Orangutan", "Gibbon", "Baboon", "Macaque", "Marmoset", "Lemur", "Tarsier"]

# Create evolutionary distance matrix (symmetric)
# Based on approximate mitochondrial DNA divergence (millions of years ago)
base_distances = np.array(
    [
        [0, 6, 9, 14, 18, 25, 25, 35, 55, 58],  # Human
        [6, 0, 9, 14, 18, 25, 25, 35, 55, 58],  # Chimpanzee
        [9, 9, 0, 14, 18, 25, 25, 35, 55, 58],  # Gorilla
        [14, 14, 14, 0, 18, 25, 25, 35, 55, 58],  # Orangutan
        [18, 18, 18, 18, 0, 25, 25, 35, 55, 58],  # Gibbon
        [25, 25, 25, 25, 25, 0, 10, 35, 55, 58],  # Baboon
        [25, 25, 25, 25, 25, 10, 0, 35, 55, 58],  # Macaque
        [35, 35, 35, 35, 35, 35, 35, 0, 55, 58],  # Marmoset
        [55, 55, 55, 55, 55, 55, 55, 55, 0, 50],  # Lemur
        [58, 58, 58, 58, 58, 58, 58, 58, 50, 0],  # Tarsier
    ]
)

# Convert distance matrix to condensed form for hierarchical clustering
condensed_distances = squareform(base_distances)

# Perform hierarchical clustering using UPGMA (average linkage)
linkage_matrix = linkage(condensed_distances, method="average")

# Map species to clade index for consistent coloring
clade_mapping = {
    "Human": 0,  # Great Apes -> Okabe-Ito[0]
    "Chimpanzee": 0,
    "Gorilla": 0,
    "Orangutan": 1,  # Lesser Apes -> Okabe-Ito[1]
    "Gibbon": 1,
    "Baboon": 2,  # Old World Monkeys -> Okabe-Ito[2]
    "Macaque": 2,
    "Marmoset": 3,  # New World Monkeys -> Okabe-Ito[3]
    "Lemur": 4,  # Prosimians -> Okabe-Ito[4]
    "Tarsier": 4,
}

clade_names = ["Great Apes", "Lesser Apes", "Old World Monkeys", "New World Monkeys", "Prosimians"]
clade_colors = [IMPRINT[i] for i in range(5)]

# Build color mapping for dendrogram links
leaf_colors = [IMPRINT[clade_mapping[s]] for s in species]
n = len(species)

# Create inline link color list for all links in dendrogram
link_colors = []
for i in range(len(linkage_matrix)):
    cluster_idx = i
    left_child = int(linkage_matrix[cluster_idx, 0])
    right_child = int(linkage_matrix[cluster_idx, 1])

    # Get colors of both children
    def get_color(node_id):
        if node_id < n:
            return leaf_colors[node_id]
        else:
            child_idx = int(node_id - n)
            left_id = int(linkage_matrix[child_idx, 0])
            right_id = int(linkage_matrix[child_idx, 1])
            left_color = get_color(left_id)
            right_color = get_color(right_id)
            return left_color if left_color == right_color else INK_SOFT

    left_color = get_color(left_child)
    right_color = get_color(right_child)
    link_colors.append(left_color if left_color == right_color else INK_SOFT)

# Create figure with theme-adaptive styling
fig, ax = plt.subplots(figsize=(16, 9), facecolor=PAGE_BG)

sns.set_theme(
    style="ticks",
    rc={
        "figure.facecolor": PAGE_BG,
        "axes.facecolor": PAGE_BG,
        "axes.edgecolor": INK_SOFT,
        "axes.labelcolor": INK,
        "text.color": INK,
        "xtick.color": INK_SOFT,
        "ytick.color": INK_SOFT,
        "grid.color": INK,
        "grid.alpha": 0.10,
        "legend.facecolor": ELEVATED_BG,
        "legend.edgecolor": INK_SOFT,
    },
)

# Plot dendrogram (phylogenetic tree) with custom clade colors
dendro = dendrogram(
    linkage_matrix,
    labels=species,
    orientation="left",
    ax=ax,
    leaf_font_size=18,
    link_color_func=lambda k: link_colors[k - n] if k >= n else leaf_colors[k],
)

# Make branch lines thicker for improved visibility
for line_collection in ax.collections:
    line_collection.set_linewidth(3)

# Style the dendrogram
ax.set_xlabel("Evolutionary Distance (Million Years)", fontsize=20, fontweight="bold", color=INK)
ax.set_title("tree-phylogenetic · seaborn · anyplot.ai", fontsize=24, fontweight="bold", pad=20, color=INK)

# Adjust tick parameters for readability
ax.tick_params(axis="x", labelsize=16, colors=INK_SOFT)
ax.tick_params(axis="y", labelsize=18, colors=INK_SOFT)

# Add subtle grid on x-axis only
ax.grid(axis="x", alpha=0.15, linestyle="-", linewidth=0.8, color=INK_SOFT)
ax.set_axisbelow(True)

# Add scale bar annotation
ax.annotate(
    "Scale: branch length = evolutionary distance",
    xy=(0.98, 0.02),
    xycoords="axes fraction",
    fontsize=14,
    ha="right",
    va="bottom",
    style="italic",
    color=INK_SOFT,
)

# Color the species labels based on clade
for label in ax.get_yticklabels():
    species_name = label.get_text()
    if species_name in clade_mapping:
        label.set_color(IMPRINT[clade_mapping[species_name]])
        label.set_fontweight("bold")

# Add legend for clades (positioned to avoid overlap with tree)
legend_elements = [Patch(facecolor=IMPRINT[i], edgecolor="none", label=clade_names[i]) for i in range(5)]
ax.legend(
    handles=legend_elements,
    loc="upper right",
    fontsize=14,
    title="Clades",
    title_fontsize=16,
    framealpha=0.9,
    facecolor=ELEVATED_BG,
    edgecolor=INK_SOFT,
)

# Remove top and right spines for cleaner look
sns.despine(ax=ax, top=True, right=True)

# Adjust layout
plt.tight_layout()
plt.savefig(f"plot-{THEME}.png", dpi=300, bbox_inches="tight", facecolor=PAGE_BG)
Runnable source as JSON, for any HTTP client: https://api.anyplot.ai/specs/tree-phylogenetic/seaborn/code. Any spec id and library id listed in llms-full.txt fit the same URL shape; every URL below is complete and callable.
{
  "spec_id": "tree-phylogenetic",
  "language": "python",
  "library": "seaborn",
  "page": "https://anyplot.ai/tree-phylogenetic/python/seaborn",
  "hub": "https://anyplot.ai/tree-phylogenetic",
  "code_json": "https://api.anyplot.ai/specs/tree-phylogenetic/seaborn/code",
  "spec_json": "https://api.anyplot.ai/specs/tree-phylogenetic",
  "render_light_png": "https://storage.googleapis.com/anyplot-images/plots/tree-phylogenetic/python/seaborn/plot-light.png",
  "render_dark_png": "https://storage.googleapis.com/anyplot-images/plots/tree-phylogenetic/python/seaborn/plot-dark.png",
  "quality_score": 94.0,
  "license": "MIT",
  "guide": "https://anyplot.ai/llms.txt"
}
Part of Phylogenetic Tree Diagram on anyplot.ai.