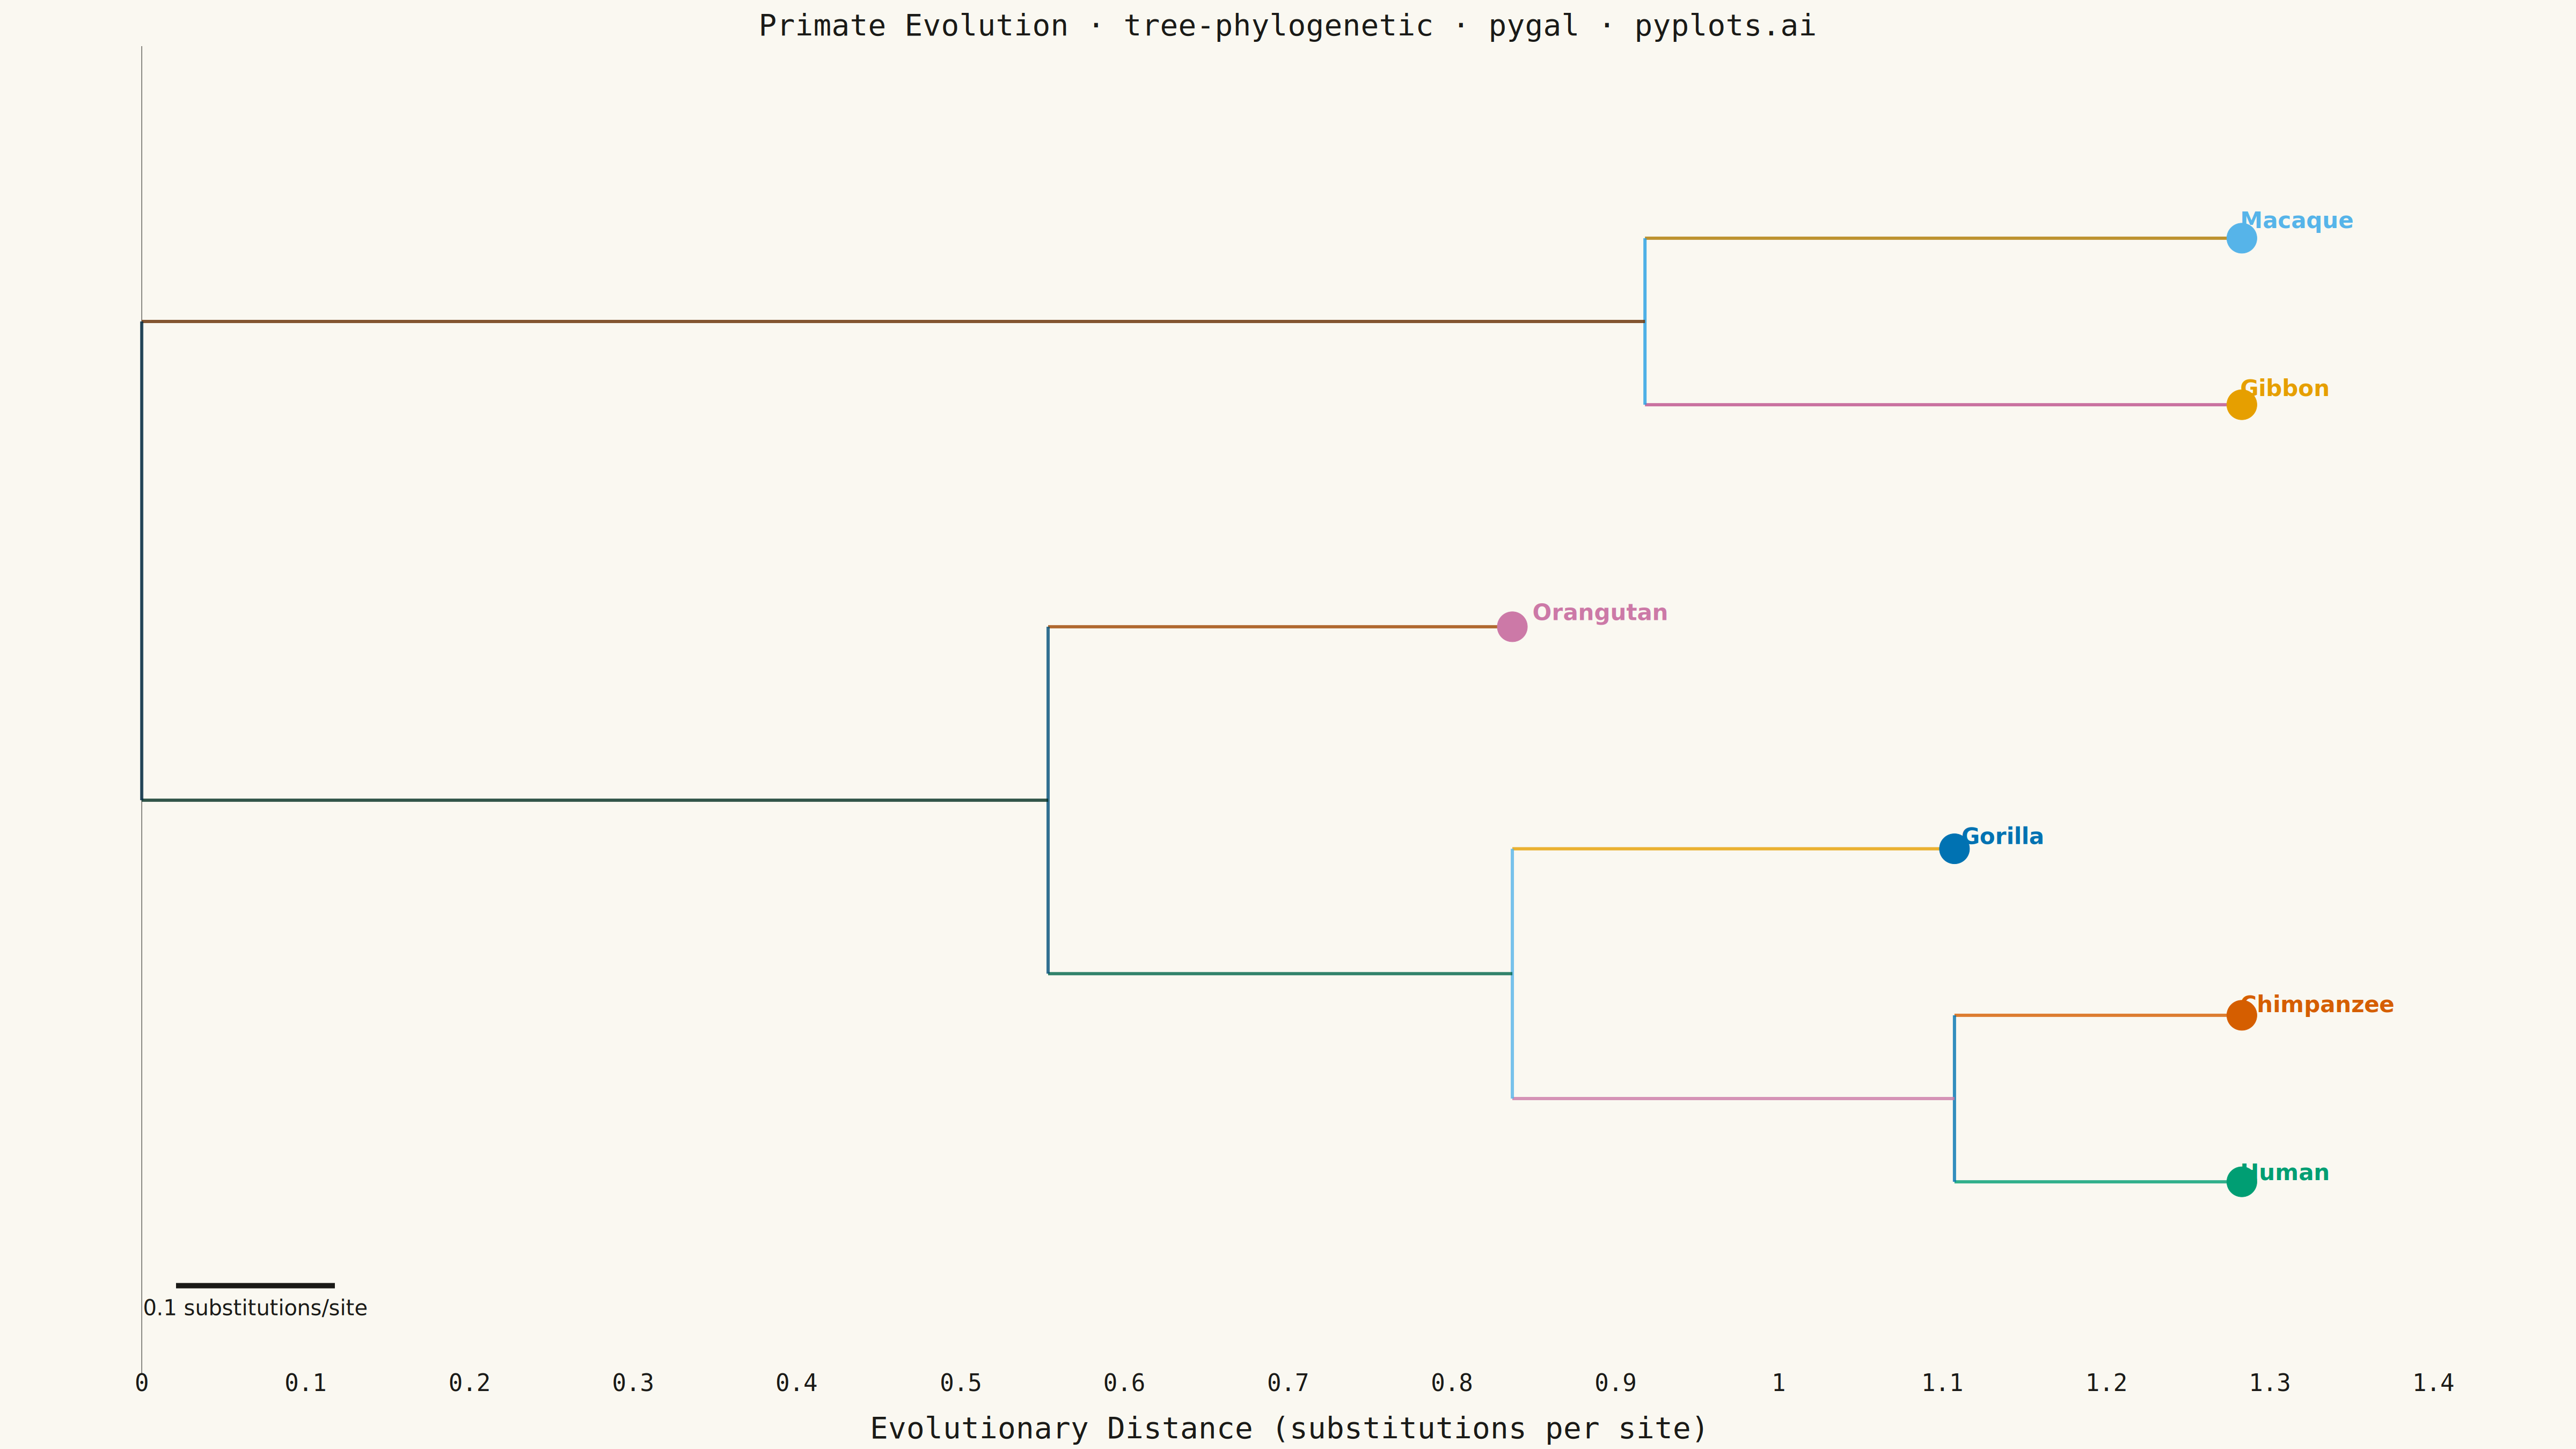
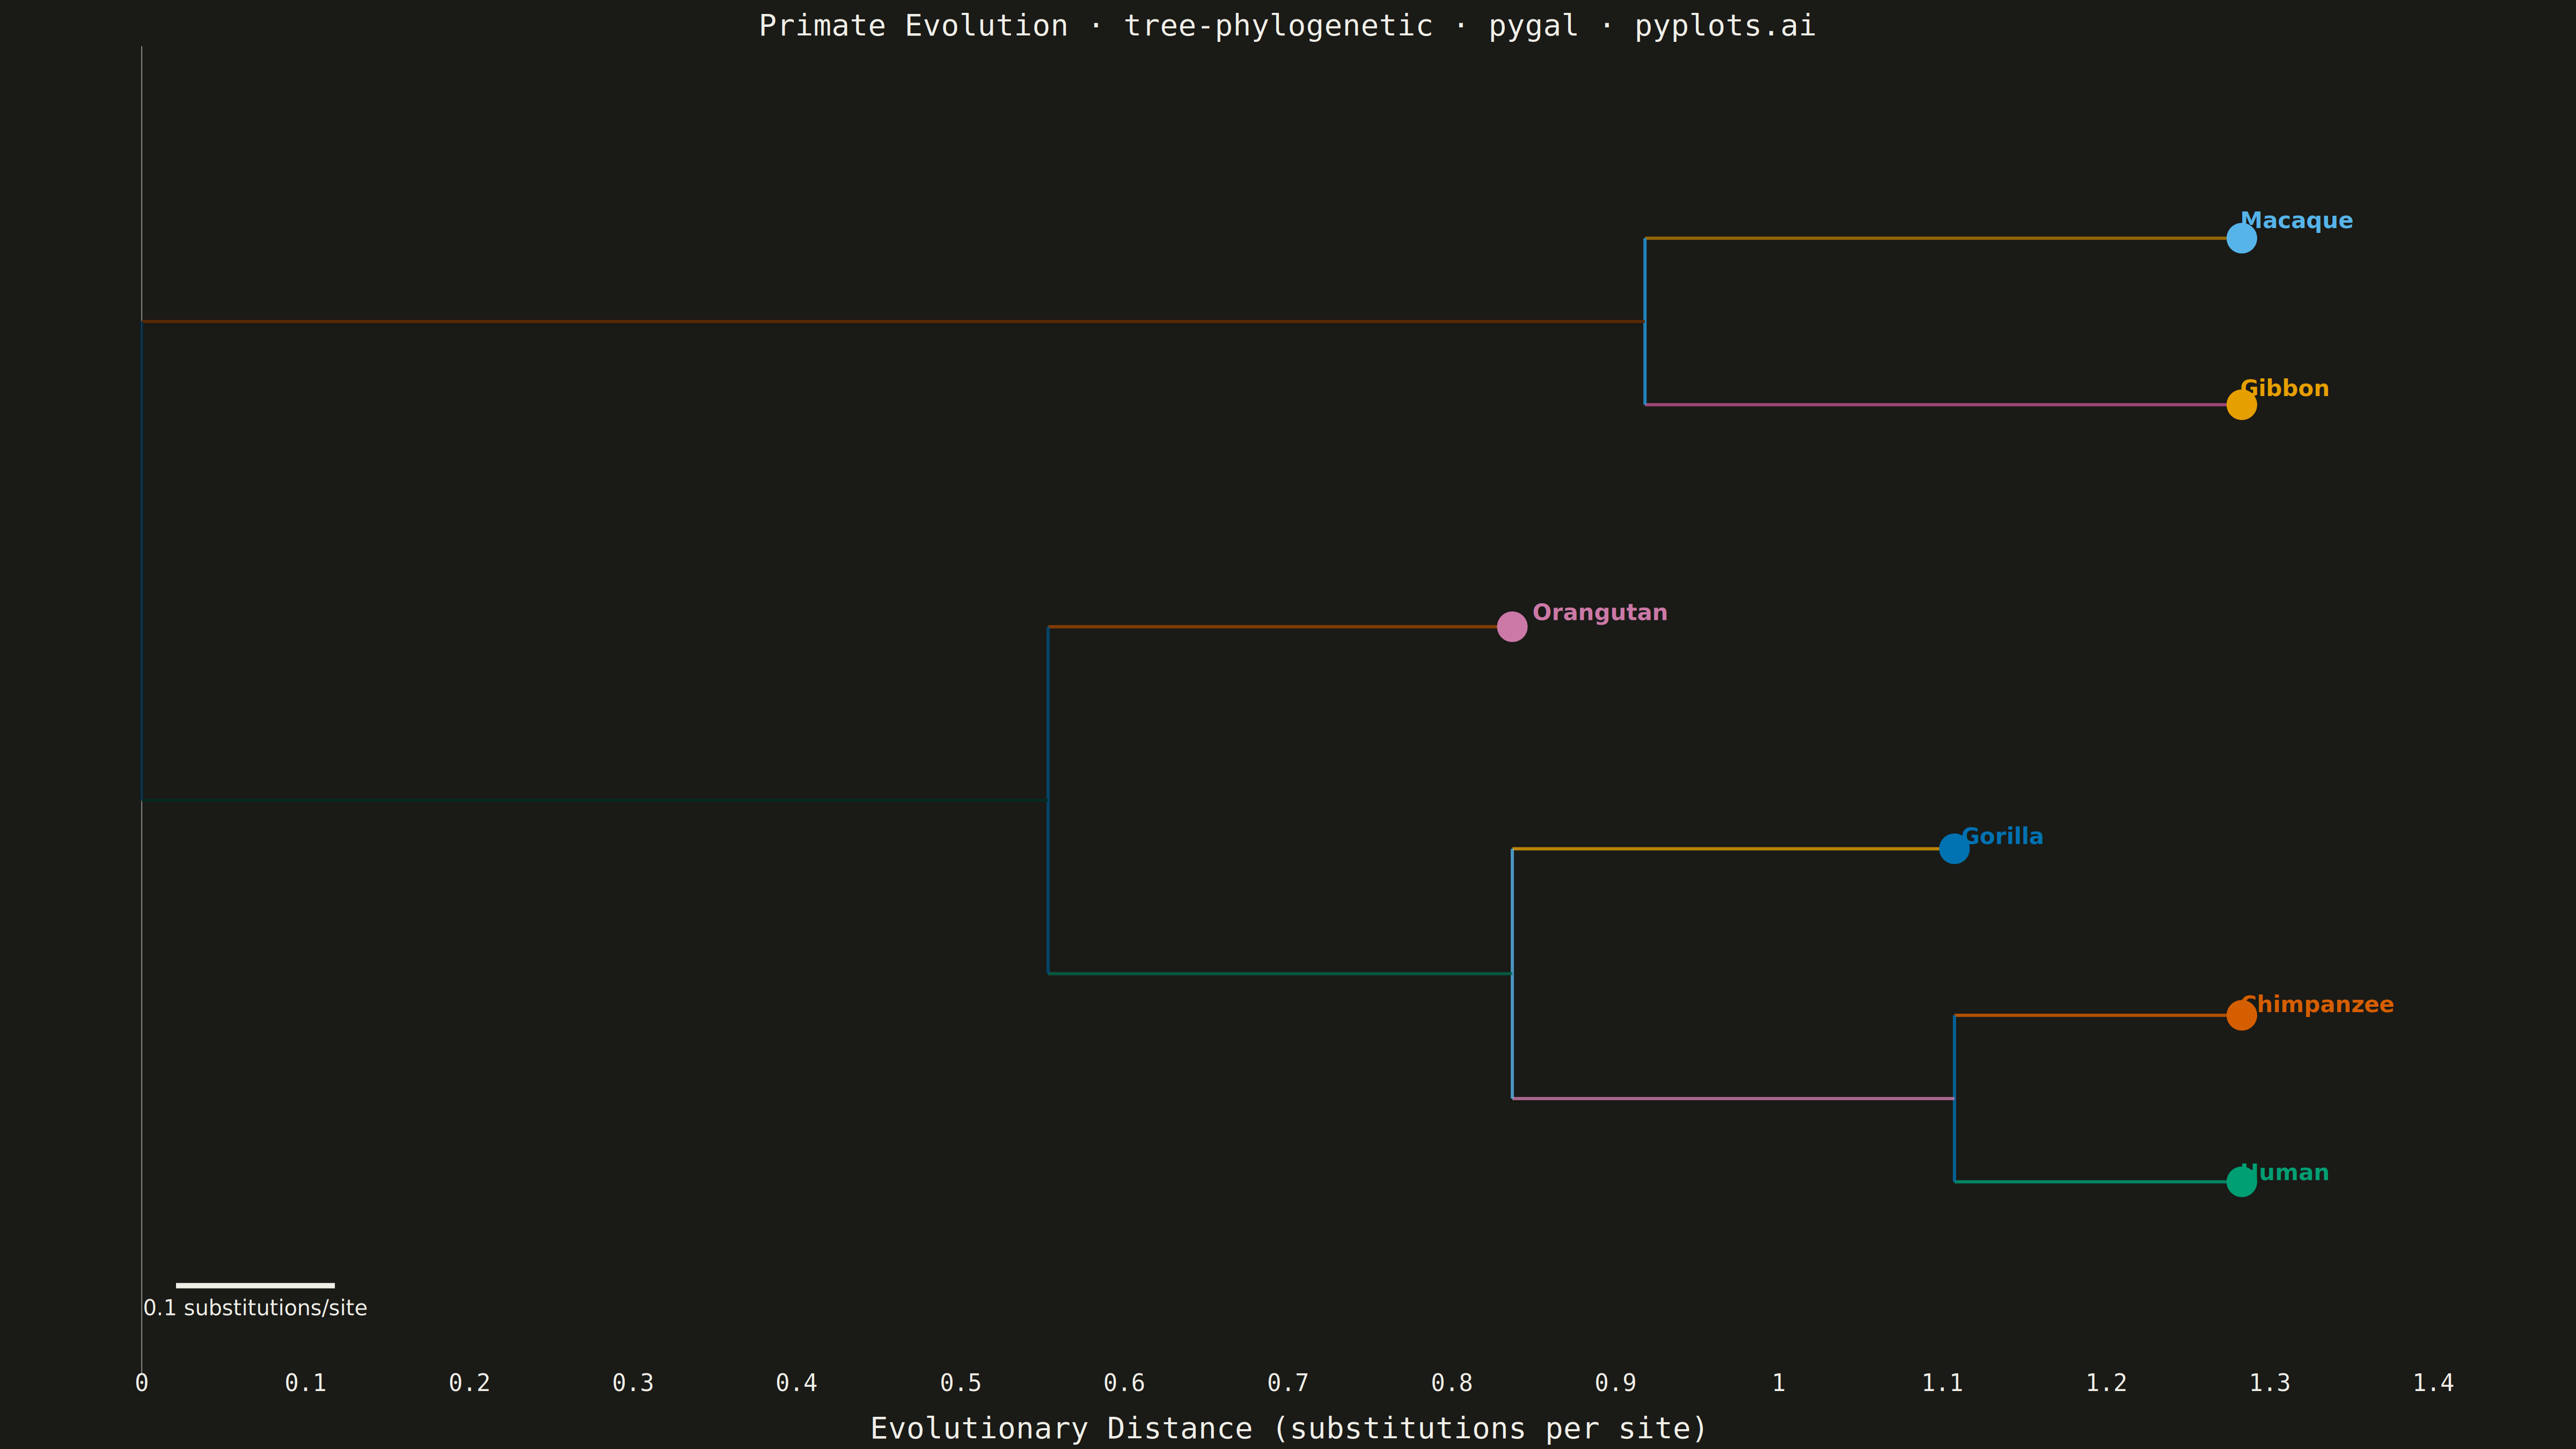
A phylogenetic tree (evolutionary tree) visualization showing hierarchical relationships between species or sequences, with branch lengths proportional to evolutionary distance. This diagram reveals how organisms or genes evolved from common ancestors, with longer branches indicating greater divergence. Phylogenetic trees are essential for understanding evolutionary history, taxonomy, and molecular biology relationships.
""" anyplot.ai
tree-phylogenetic: Phylogenetic Tree Diagram
Library: pygal 3.1.0 | Python 3.13.13
Quality: 68/100 | Updated: 2026-05-15
"""

import cairosvg
import pygal
from pygal.style import Style


# Primate phylogenetic tree based on mitochondrial DNA divergence (simplified)
# Tree structure: ((((Human, Chimpanzee), Gorilla), Orangutan), (Gibbon, Macaque))
# Scaled to use more canvas width - multiply x positions to spread tree wider
scale_factor = 1.35
species_data = [
    ("Human", 0.95 * scale_factor, 0),
    ("Chimpanzee", 0.95 * scale_factor, 1.5),
    ("Gorilla", 0.82 * scale_factor, 3),
    ("Orangutan", 0.62 * scale_factor, 5),
    ("Gibbon", 0.95 * scale_factor, 7),
    ("Macaque", 0.95 * scale_factor, 8.5),
]

# Y positions from species data
species_y = {name: y for name, _, y in species_data}
species_x = {name: x for name, x, _ in species_data}

# Define tree connections
tree_segments = []

# Human-Chimpanzee clade (most recent common ancestor)
hc_ancestor_x = 0.82 * scale_factor
hc_ancestor_y = (species_y["Human"] + species_y["Chimpanzee"]) / 2
tree_segments.append([(hc_ancestor_x, species_y["Human"]), (species_x["Human"], species_y["Human"])])
tree_segments.append([(hc_ancestor_x, species_y["Chimpanzee"]), (species_x["Chimpanzee"], species_y["Chimpanzee"])])
tree_segments.append([(hc_ancestor_x, species_y["Human"]), (hc_ancestor_x, species_y["Chimpanzee"])])

# Human-Chimp-Gorilla clade
hcg_ancestor_x = 0.62 * scale_factor
hcg_ancestor_y = (hc_ancestor_y + species_y["Gorilla"]) / 2
tree_segments.append([(hcg_ancestor_x, hc_ancestor_y), (hc_ancestor_x, hc_ancestor_y)])
tree_segments.append([(hcg_ancestor_x, species_y["Gorilla"]), (species_x["Gorilla"], species_y["Gorilla"])])
tree_segments.append([(hcg_ancestor_x, hc_ancestor_y), (hcg_ancestor_x, species_y["Gorilla"])])

# Great apes clade including Orangutan
great_apes_x = 0.41 * scale_factor
great_apes_y = (hcg_ancestor_y + species_y["Orangutan"]) / 2
tree_segments.append([(great_apes_x, hcg_ancestor_y), (hcg_ancestor_x, hcg_ancestor_y)])
tree_segments.append([(great_apes_x, species_y["Orangutan"]), (species_x["Orangutan"], species_y["Orangutan"])])
tree_segments.append([(great_apes_x, hcg_ancestor_y), (great_apes_x, species_y["Orangutan"])])

# Gibbon-Macaque clade
gm_ancestor_x = 0.68 * scale_factor
gm_ancestor_y = (species_y["Gibbon"] + species_y["Macaque"]) / 2
tree_segments.append([(gm_ancestor_x, species_y["Gibbon"]), (species_x["Gibbon"], species_y["Gibbon"])])
tree_segments.append([(gm_ancestor_x, species_y["Macaque"]), (species_x["Macaque"], species_y["Macaque"])])
tree_segments.append([(gm_ancestor_x, species_y["Gibbon"]), (gm_ancestor_x, species_y["Macaque"])])

# Root: connects great apes and gibbon-macaque clades (x=0)
root_x = 0.0
root_y = (great_apes_y + gm_ancestor_y) / 2
tree_segments.append([(root_x, great_apes_y), (great_apes_x, great_apes_y)])
tree_segments.append([(root_x, gm_ancestor_y), (gm_ancestor_x, gm_ancestor_y)])
tree_segments.append([(root_x, great_apes_y), (root_x, gm_ancestor_y)])

# Colorblind-friendly palette for species markers
species_colors = ["#E63946", "#457B9D", "#2A9D8F", "#E9C46A", "#F4A261", "#9C6644"]

# Branch color - pyplots blue
branch_color = "#306998"

# Custom style for pyplots - larger fonts for 4800x2700 canvas
custom_style = Style(
    background="white",
    plot_background="white",
    foreground="#333",
    foreground_strong="#333",
    foreground_subtle="#999",
    colors=(branch_color,),
    title_font_size=56,
    label_font_size=44,
    major_label_font_size=40,
    legend_font_size=44,
    value_font_size=36,
    tooltip_font_size=28,
    stroke_width=6,
    opacity=1.0,
    guide_stroke_color="#ddd",
)

# Create XY chart for phylogenetic tree
chart = pygal.XY(
    width=4800,
    height=2700,
    style=custom_style,
    title="Primate Evolution · tree-phylogenetic · pygal · pyplots.ai",
    x_title="Evolutionary Distance (substitutions per site)",
    y_title="",
    show_legend=False,
    show_dots=False,
    stroke_style={"width": 6},
    fill=False,
    show_x_guides=False,
    show_y_guides=False,
    show_y_labels=False,
    range=(-1.5, 10),
    xrange=(-0.05, 1.45),
    print_values=False,
)

# Add all tree branches as unnamed series
for seg in tree_segments:
    chart.add(None, seg, show_dots=False, stroke_style={"width": 6})

# Add species markers (dots only, labels added via SVG)
for i, (_name, x_pos, y_pos) in enumerate(species_data):
    color = species_colors[i % len(species_colors)]
    chart.add(
        None, [{"value": (x_pos, y_pos), "color": color}], show_dots=True, dots_size=28, stroke_style={"width": 0}
    )

# Render to SVG string first
svg_content = chart.render().decode("utf-8")

# Calculate pixel positions for species labels
# Plot area bounds for coordinate conversion
plot_x_min, plot_x_max = 180, 4620
plot_y_min, plot_y_max = 100, 2500
data_x_min, data_x_max = -0.05, 1.45
data_y_min, data_y_max = -1.5, 10

# Generate species label SVG elements positioned directly next to leaf nodes
species_labels_svg = '<g class="species-labels">\n'
for i, (name, x_pos, y_pos) in enumerate(species_data):
    # Inline coordinate conversion (data to pixel)
    px = plot_x_min + (x_pos - data_x_min) / (data_x_max - data_x_min) * (plot_x_max - plot_x_min)
    py = plot_y_max - (y_pos - data_y_min) / (data_y_max - data_y_min) * (plot_y_max - plot_y_min)
    color = species_colors[i % len(species_colors)]
    # Position label to the right of the marker
    species_labels_svg += f'  <text x="{px + 50}" y="{py + 12}" font-size="42" fill="{color}" '
    species_labels_svg += f'font-family="sans-serif" font-weight="bold">{name}</text>\n'
species_labels_svg += "</g>\n"

# Add scale bar with label - inline coordinate conversion
scale_x_data, scale_y_data = 0.0, -1.0
scale_px = plot_x_min + (scale_x_data - data_x_min) / (data_x_max - data_x_min) * (plot_x_max - plot_x_min)
scale_py = plot_y_max - (scale_y_data - data_y_min) / (data_y_max - data_y_min) * (plot_y_max - plot_y_min)
scale_end_x_data = 0.1
scale_end_px = plot_x_min + (scale_end_x_data - data_x_min) / (data_x_max - data_x_min) * (plot_x_max - plot_x_min)
scale_width = scale_end_px - scale_px

scale_bar_svg = f"""
<g class="scale-bar">
  <line x1="{scale_px}" y1="{scale_py}" x2="{scale_end_px}" y2="{scale_py}" stroke="#333" stroke-width="10"/>
  <text x="{scale_px + scale_width / 2}" y="{scale_py + 55}" text-anchor="middle" font-size="40" fill="#333" font-family="sans-serif">0.1 substitutions/site</text>
</g>
"""

# Insert labels and scale bar before closing </svg> tag
svg_content = svg_content.replace("</svg>", species_labels_svg + scale_bar_svg + "</svg>")

# Save SVG
with open("plot.svg", "w") as f:
    f.write(svg_content)

# For HTML, use the modified SVG
html_content = f"""<!DOCTYPE html>
<html>
<head>
    <meta charset="utf-8">
    <title>Phylogenetic Tree - pygal</title>
    <style>body {{ margin: 0; display: flex; justify-content: center; align-items: center; min-height: 100vh; }}</style>
</head>
<body>
{svg_content}
</body>
</html>"""
with open("plot.html", "w") as f:
    f.write(html_content)

# Convert to PNG using cairosvg
cairosvg.svg2png(bytestring=svg_content.encode("utf-8"), write_to="plot.png")
Runnable source as JSON, for any HTTP client: https://api.anyplot.ai/specs/tree-phylogenetic/pygal/code. Any spec id and library id listed in llms-full.txt fit the same URL shape; every URL below is complete and callable.
{
  "spec_id": "tree-phylogenetic",
  "language": "python",
  "library": "pygal",
  "page": "https://anyplot.ai/tree-phylogenetic/python/pygal",
  "hub": "https://anyplot.ai/tree-phylogenetic",
  "code_json": "https://api.anyplot.ai/specs/tree-phylogenetic/pygal/code",
  "spec_json": "https://api.anyplot.ai/specs/tree-phylogenetic",
  "render_light_png": "https://storage.googleapis.com/anyplot-images/plots/tree-phylogenetic/python/pygal/plot-light.png",
  "render_dark_png": "https://storage.googleapis.com/anyplot-images/plots/tree-phylogenetic/python/pygal/plot-dark.png",
  "interactive_light_html": "https://storage.googleapis.com/anyplot-images/plots/tree-phylogenetic/python/pygal/plot-light.html",
  "interactive_dark_html": "https://storage.googleapis.com/anyplot-images/plots/tree-phylogenetic/python/pygal/plot-dark.html",
  "quality_score": 68.0,
  "license": "MIT",
  "guide": "https://anyplot.ai/llms.txt"
}
Part of Phylogenetic Tree Diagram on anyplot.ai.