The same plot in 14 other libraries — JavaScript: Chart.js, D3.js, Highcharts, MUI X Charts; Python: Altair, Bokeh, lets-plot, Matplotlib, Plotly, plotnine, Pygal, Seaborn; R: ggplot2; Julia: Makie.jl. Compare all 15 side by side: Phylogenetic Tree Diagram in Python, R, Julia and JavaScript.
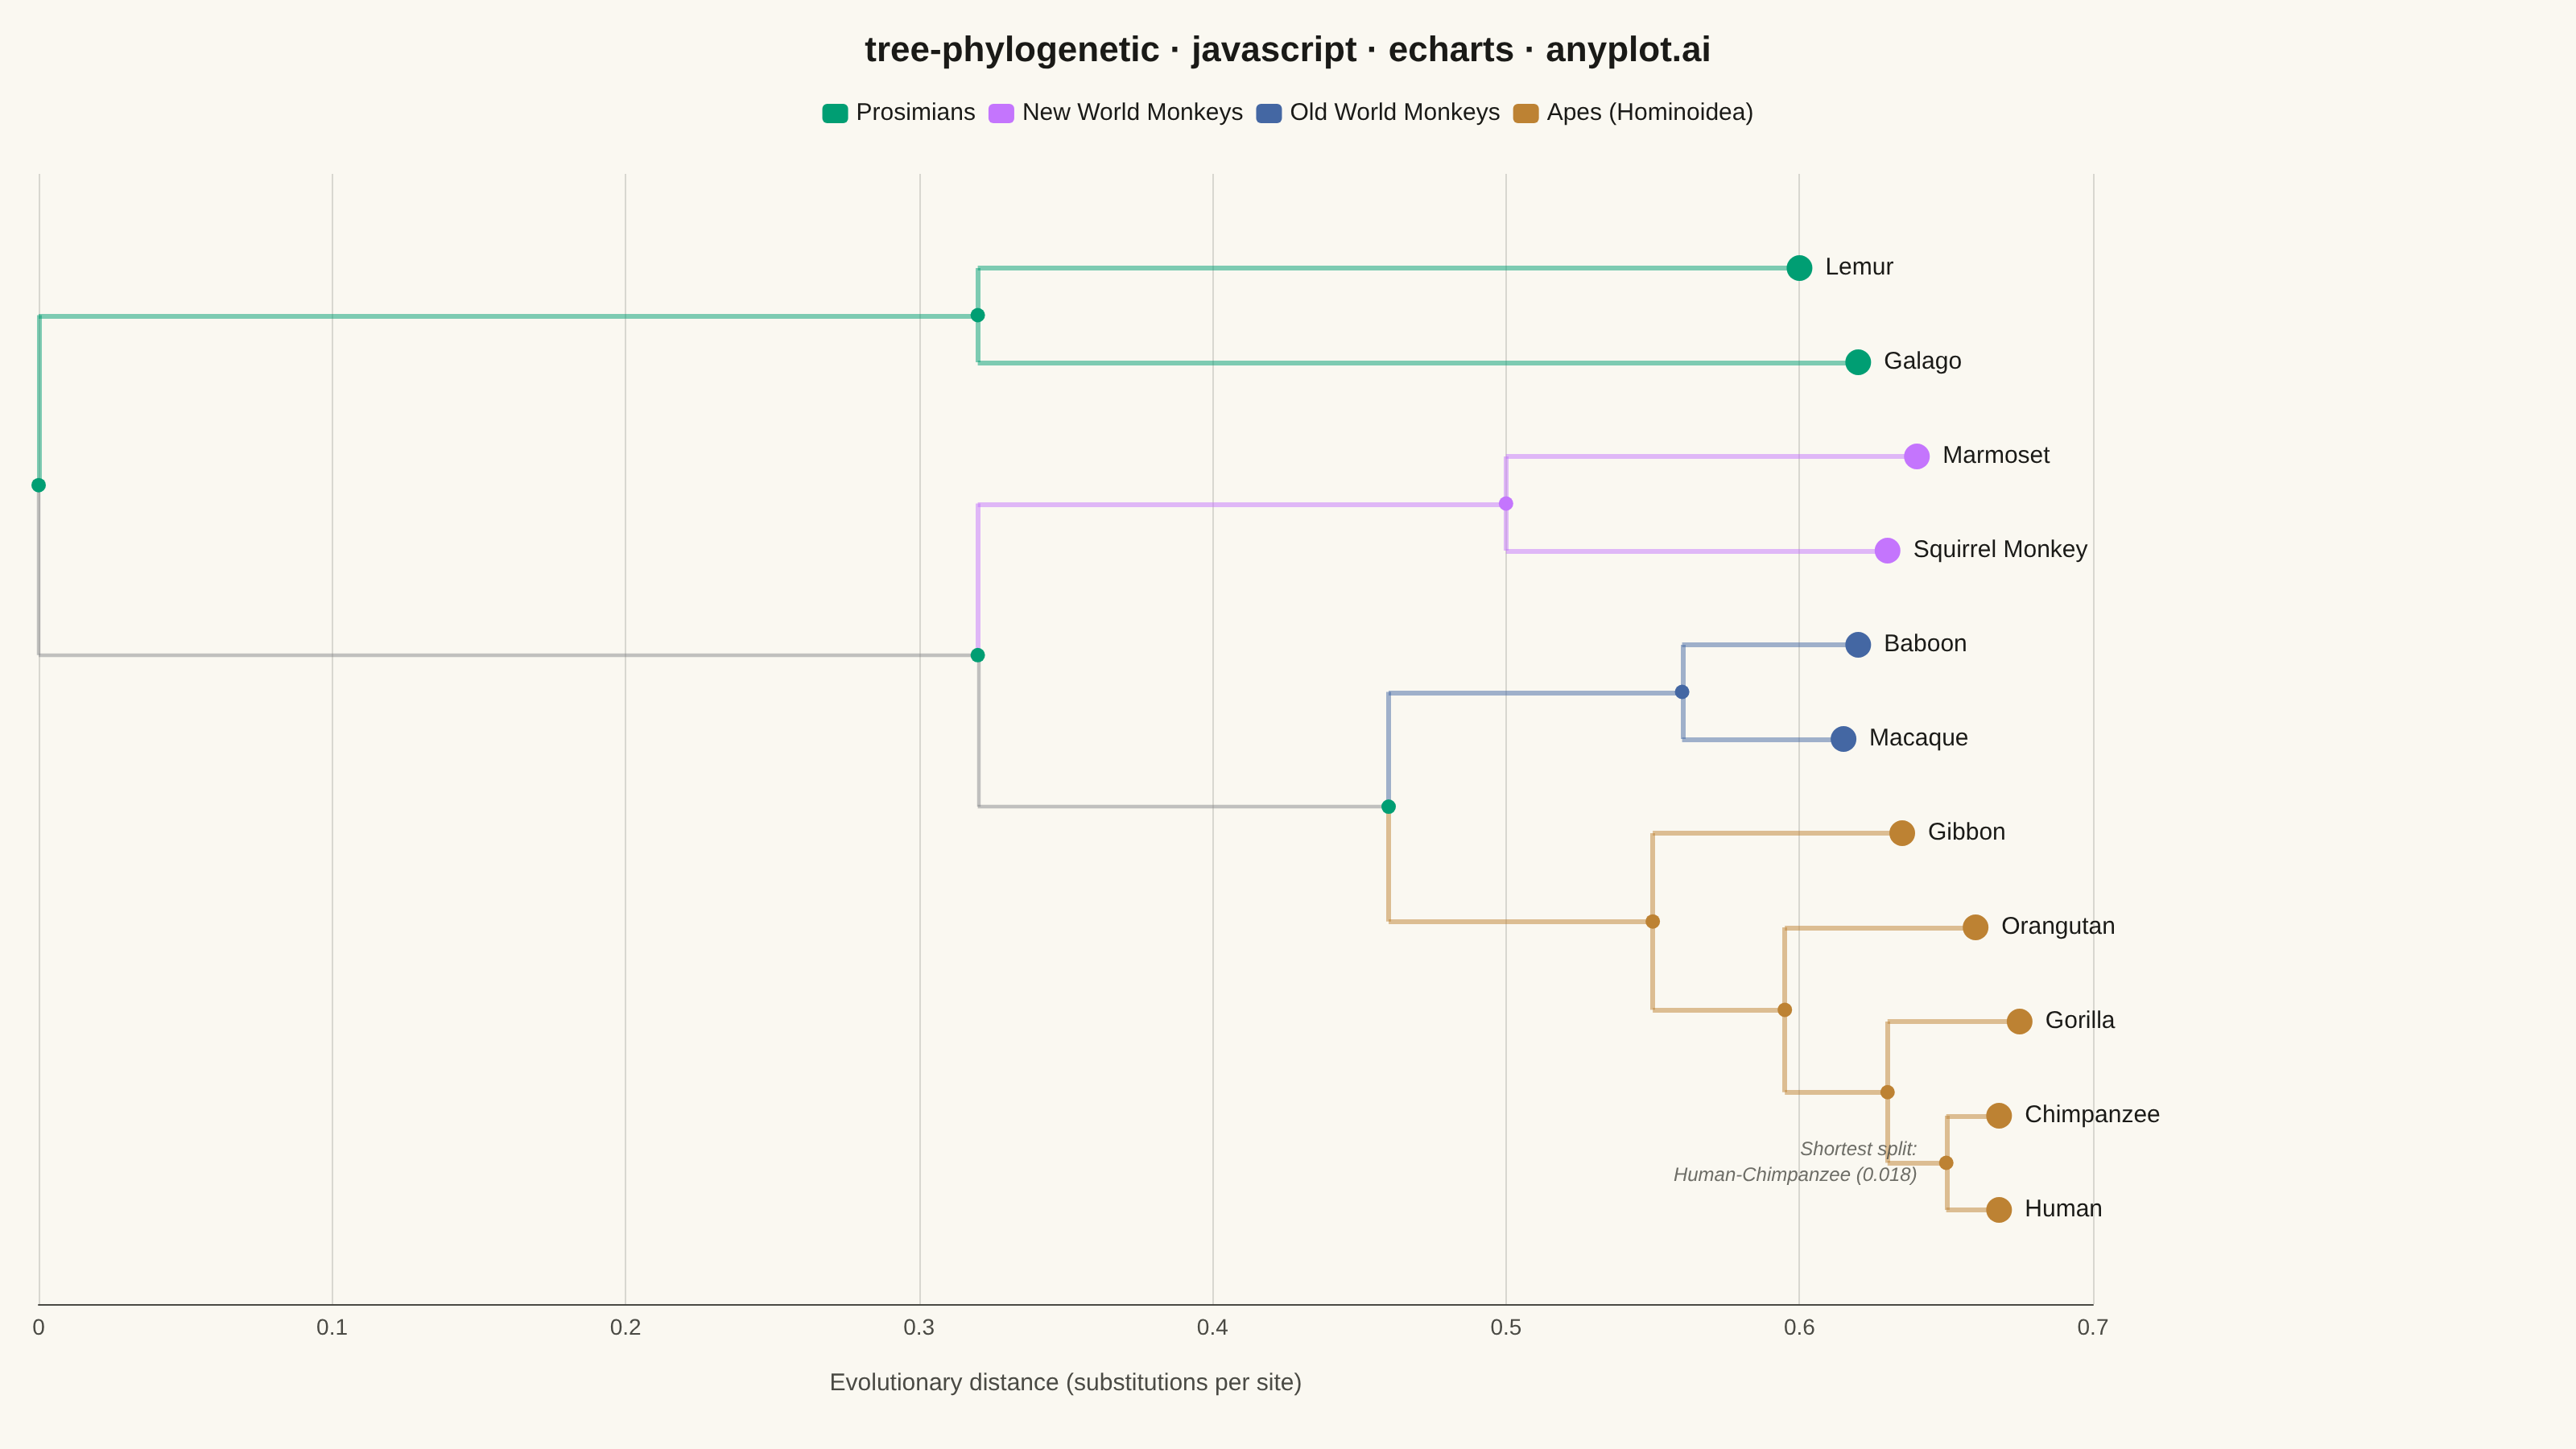
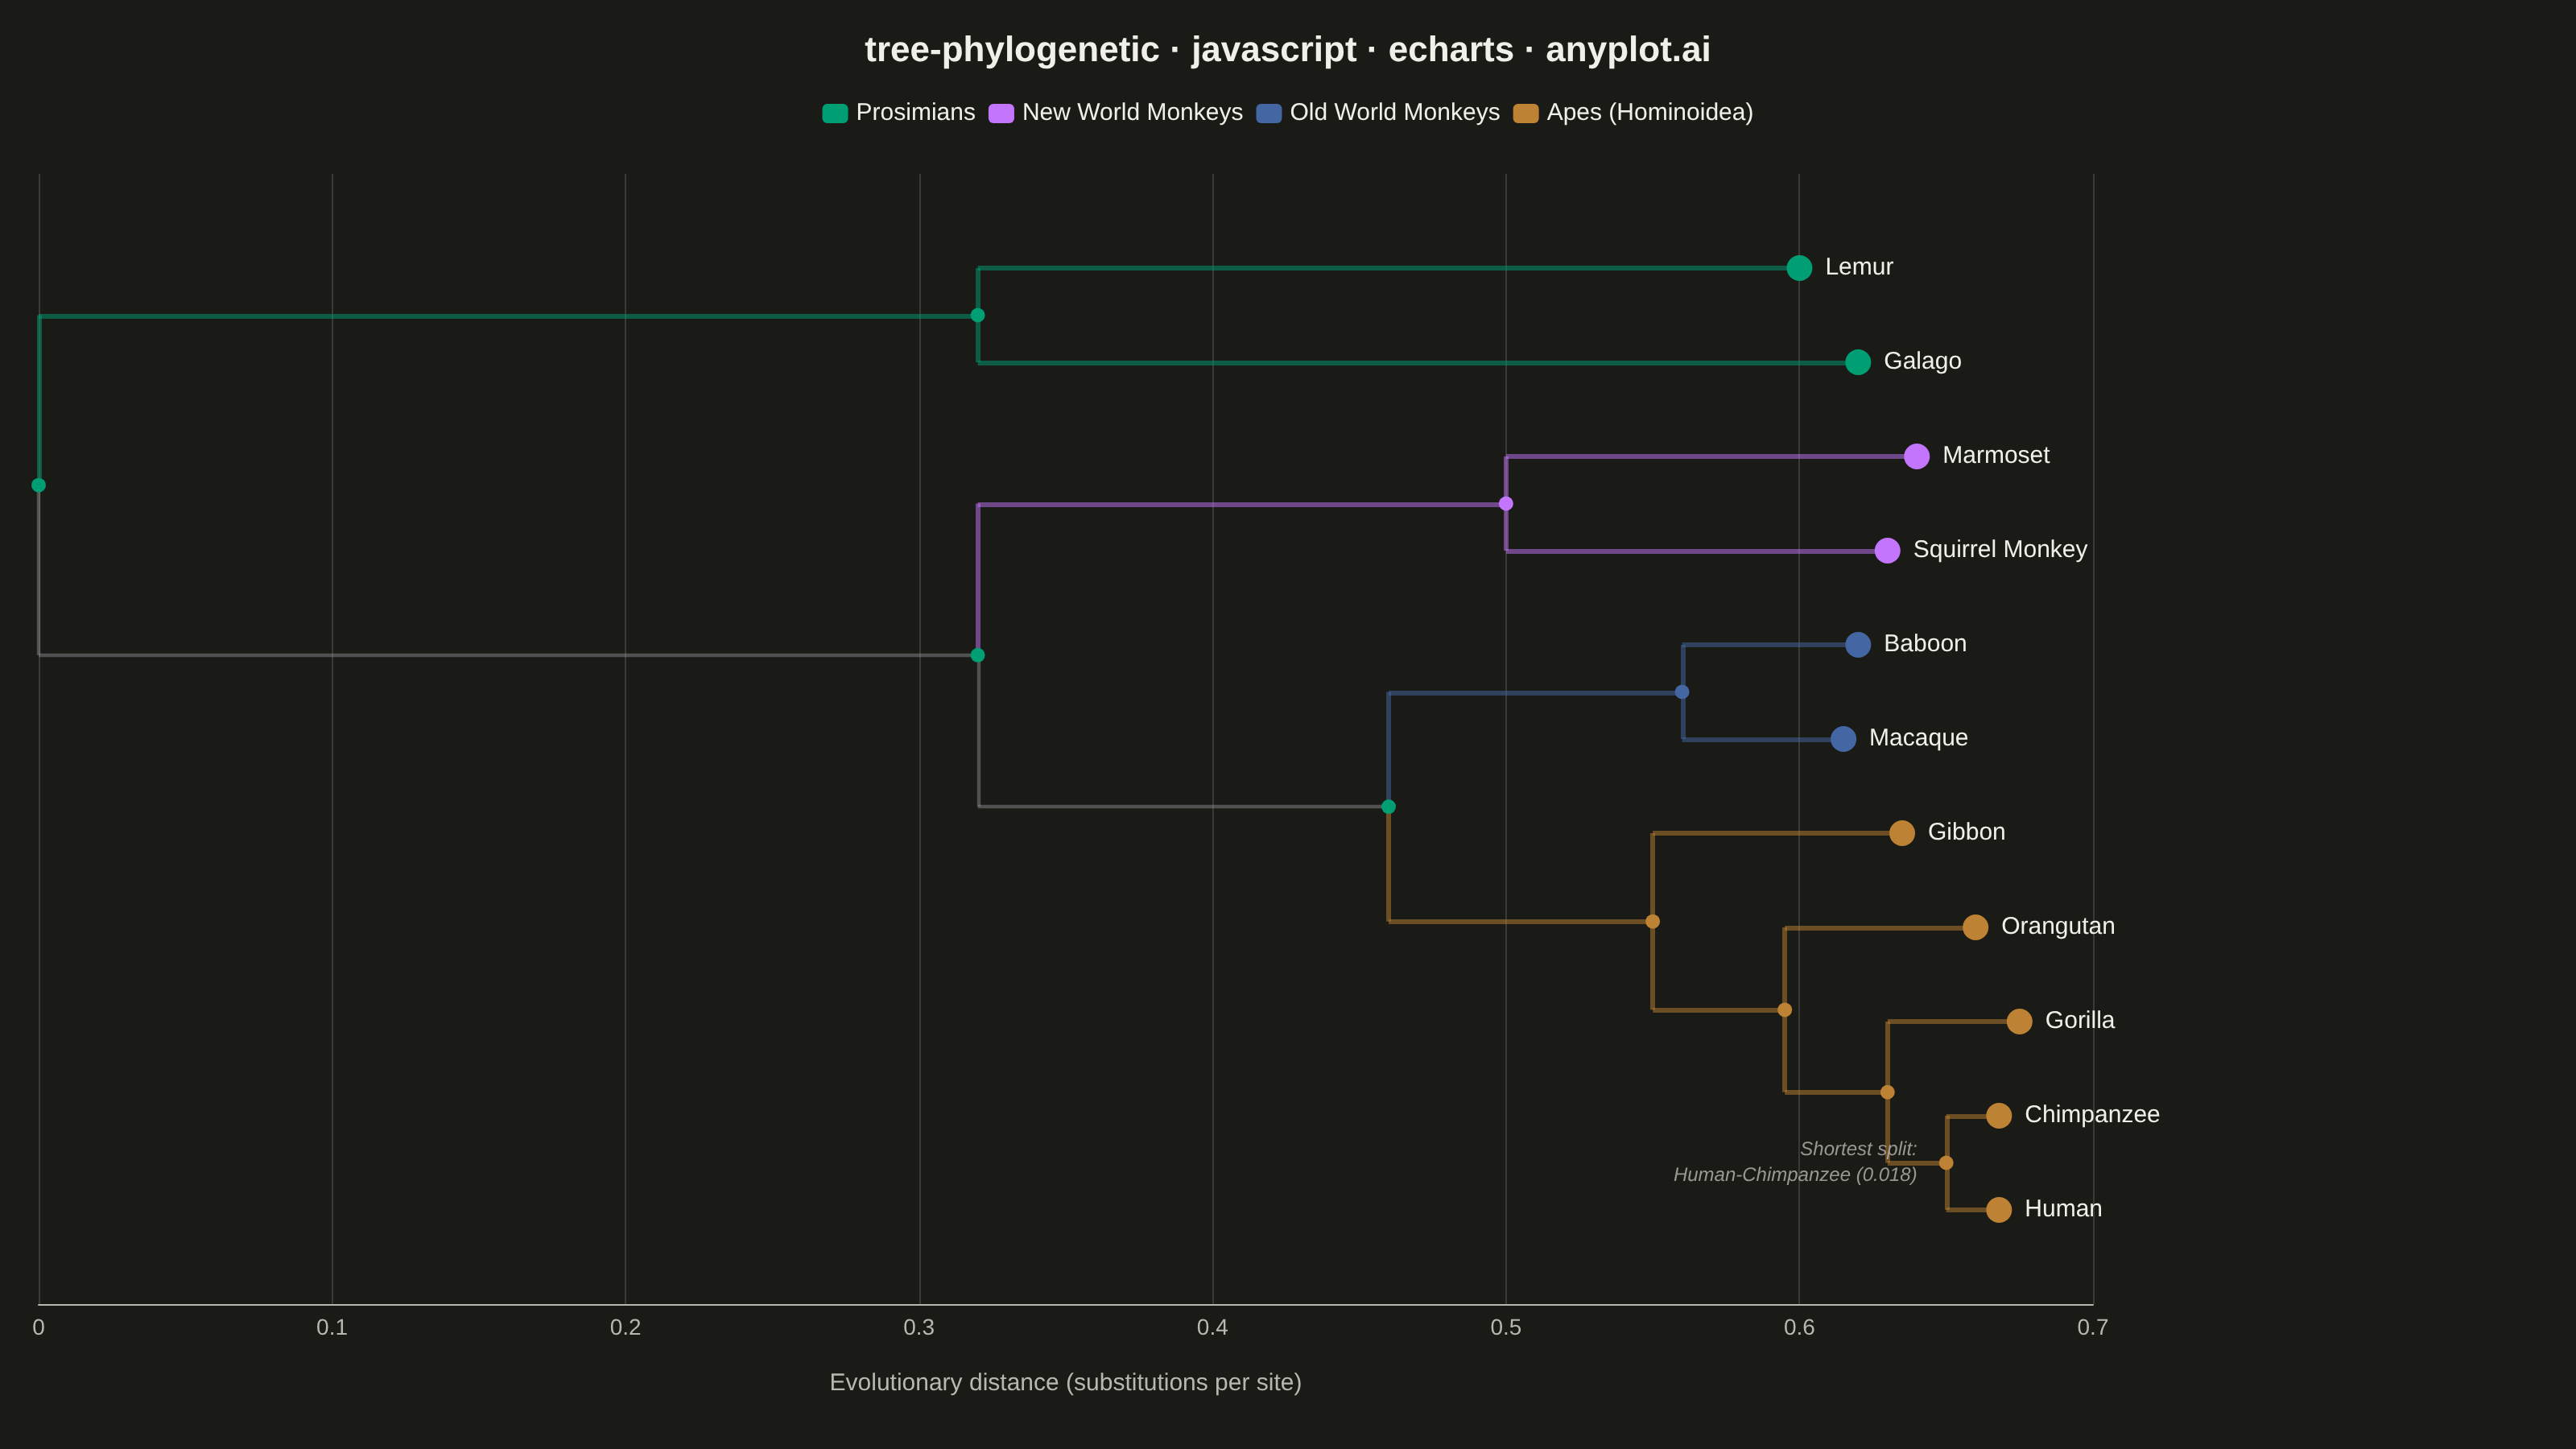
A phylogenetic tree (evolutionary tree) visualization showing hierarchical relationships between species or sequences, with branch lengths proportional to evolutionary distance. This diagram reveals how organisms or genes evolved from common ancestors, with longer branches indicating greater divergence. Phylogenetic trees are essential for understanding evolutionary history, taxonomy, and molecular biology relationships.
// anyplot.ai
// tree-phylogenetic: Phylogenetic Tree Diagram
// Library: echarts 6.1.0 | JavaScript 22.23.2
// Quality: 95/100 | Created: 2026-09-09

const t = window.ANYPLOT_TOKENS;

// --- Data: primate phylogeny from mitochondrial DNA divergence --------------
// Each node carries `length` = branch length to its parent, in substitutions
// per site. `clade` marks the root of one of the four highlighted lineages;
// descendants inherit it. Values are illustrative, not a literal alignment.
const TREE = {
  name: "Root",
  length: 0,
  children: [
    {
      name: "Prosimians",
      length: 0.32,
      clade: 0,
      children: [
        { name: "Lemur", length: 0.28, children: [] },
        { name: "Galago", length: 0.3, children: [] },
      ],
    },
    {
      name: "Anthropoidea",
      length: 0.32,
      children: [
        {
          name: "New World Monkeys",
          length: 0.18,
          clade: 1,
          children: [
            { name: "Marmoset", length: 0.14, children: [] },
            { name: "Squirrel Monkey", length: 0.13, children: [] },
          ],
        },
        {
          name: "Catarrhini",
          length: 0.14,
          children: [
            {
              name: "Old World Monkeys",
              length: 0.1,
              clade: 2,
              children: [
                { name: "Baboon", length: 0.06, children: [] },
                { name: "Macaque", length: 0.055, children: [] },
              ],
            },
            {
              name: "Apes",
              length: 0.09,
              clade: 3,
              children: [
                { name: "Gibbon", length: 0.085, children: [] },
                {
                  name: "Great Apes",
                  length: 0.045,
                  children: [
                    { name: "Orangutan", length: 0.065, children: [] },
                    {
                      name: "African Apes",
                      length: 0.035,
                      children: [
                        { name: "Gorilla", length: 0.045, children: [] },
                        {
                          name: "Human-Chimp",
                          length: 0.02,
                          children: [
                            { name: "Chimpanzee", length: 0.018, children: [] },
                            { name: "Human", length: 0.018, children: [] },
                          ],
                        },
                      ],
                    },
                  ],
                },
              ],
            },
          ],
        },
      ],
    },
  ],
};

const CLADE_NAMES = ["Prosimians", "New World Monkeys", "Old World Monkeys", "Apes (Hominoidea)"];

// --- Layout: cumulative branch length -> x, leaf order -> y -----------------
// Rectangular phylogram: each parent/child pair is joined via an invisible
// corner node so branches meet at right angles, the classic cladogram style.
const nodes = [];
const edges = [];
let leafCount = 0;

function colorFor(clade) {
  return clade == null ? t.muted : t.palette[clade];
}

function walk(node, parentX, inheritedClade) {
  const x = parentX + node.length;
  const clade = node.clade != null ? node.clade : inheritedClade;
  const isLeaf = node.children.length === 0;

  if (isLeaf) {
    const y = leafCount;
    leafCount += 1;
    nodes.push({
      name: node.name,
      x,
      y,
      length: node.length,
      symbolSize: 16,
      category: clade,
      itemStyle: clade == null ? { color: t.muted } : undefined,
      label: { show: true, position: "right", distance: 8, color: t.ink, fontSize: 15, fontWeight: 500 },
    });
    return { x, y, name: node.name };
  }

  const childResults = node.children.map((child) => walk(child, x, clade));
  const ys = childResults.map((c) => c.y);
  const y = (Math.min(...ys) + Math.max(...ys)) / 2;

  nodes.push({
    name: node.name,
    x,
    y,
    length: node.length,
    symbolSize: 9,
    category: clade,
    itemStyle: clade == null ? { color: t.muted } : undefined,
    label: { show: false },
  });

  childResults.forEach((child, i) => {
    const childClade = node.children[i].clade != null ? node.children[i].clade : clade;
    const corner = `${node.name}->${child.name}`;
    nodes.push({ name: corner, x, y: child.y, symbolSize: 0, silent: true, label: { show: false } });
    edges.push({ source: node.name, target: corner, color: colorFor(childClade) });
    edges.push({ source: corner, target: child.name, color: colorFor(childClade) });
  });

  return { x, y, name: node.name };
}

walk(TREE, 0, null);

// The shallowest split in the tree (Human-Chimp, 0.018) is the natural focal
// point for a callout — annotate it directly on the static PNG.
const focalNode = nodes.find((n) => n.name === "Human-Chimp");

// --- Init ---------------------------------------------------------------
const chart = echarts.init(document.getElementById("container"));

// --- Option ---------------------------------------------------------------
chart.setOption({
  animation: false,
  color: t.palette,
  backgroundColor: "transparent",
  title: {
    text: "tree-phylogenetic · javascript · echarts · anyplot.ai",
    left: "center",
    top: 16,
    textStyle: { color: t.ink, fontSize: 22, fontWeight: 600 },
  },
  legend: {
    data: CLADE_NAMES,
    top: 58,
    left: "center",
    itemWidth: 16,
    itemHeight: 12,
    textStyle: { color: t.ink, fontSize: 15 },
  },
  tooltip: {
    show: true,
    trigger: "item",
    backgroundColor: t.elevatedBg,
    borderColor: t.grid,
    textStyle: { color: t.ink, fontSize: 13 },
    formatter: (params) => {
      const d = params.data;
      if (!d || !d.symbolSize) return "";
      const cladeLabel = d.category != null ? CLADE_NAMES[d.category] : "Unclustered (basal split)";
      const branch = typeof d.length === "number" ? `${d.length.toFixed(3)} subst./site` : "—";
      return (
        `<b>${d.name}</b><br/>Clade: ${cladeLabel}<br/>` +
        `Branch length: ${branch}<br/>Cumulative distance: ${params.value[0].toFixed(3)}`
      );
    },
  },
  grid: { left: 24, right: 300, top: 108, bottom: 90 },
  xAxis: {
    type: "value",
    min: 0,
    name: "Evolutionary distance (substitutions per site)",
    nameLocation: "middle",
    nameGap: 42,
    nameTextStyle: { color: t.inkSoft, fontSize: 15 },
    axisLabel: { color: t.inkSoft, fontSize: 14 },
    axisLine: { onZero: false, lineStyle: { color: t.inkSoft } },
    axisTick: { show: false },
    splitLine: { lineStyle: { color: t.grid } },
  },
  yAxis: {
    type: "value",
    show: false,
    min: -1,
    max: leafCount,
    inverse: true,
    axisLine: { onZero: false },
  },
  series: [
    {
      type: "graph",
      coordinateSystem: "cartesian2d",
      layout: "none",
      symbol: "circle",
      edgeSymbol: ["none", "none"],
      categories: CLADE_NAMES.map((name, i) => ({ name, itemStyle: { color: t.palette[i] } })),
      data: nodes.map((n) => ({
        name: n.name,
        value: [n.x, n.y],
        symbolSize: n.symbolSize,
        category: n.category,
        itemStyle: n.itemStyle,
        label: n.label,
        silent: n.silent,
      })),
      edges: edges.map((e) => ({
        source: e.source,
        target: e.target,
        lineStyle: { color: e.color, width: e.color === t.muted ? 2.2 : 3, curveness: 0 },
      })),
      emphasis: {
        focus: "adjacency",
        lineStyle: { width: 5 },
        itemStyle: { borderColor: t.ink, borderWidth: 2 },
        label: { fontWeight: 700 },
      },
      blur: { itemStyle: { opacity: 0.2 }, lineStyle: { opacity: 0.15 }, label: { opacity: 0.3 } },
      z: 2,
    },
    {
      // Static callout on the shortest split (Human-Chimp) — a zero-size,
      // non-interactive scatter point used purely to place its label.
      type: "scatter",
      coordinateSystem: "cartesian2d",
      silent: true,
      z: 3,
      data: [
        {
          value: [focalNode.x, focalNode.y],
          symbolSize: 0,
          label: {
            show: true,
            formatter: "Shortest split:\nHuman-Chimpanzee (0.018)",
            position: "left",
            distance: 18,
            align: "right",
            color: t.inkSoft,
            fontSize: 12,
            fontStyle: "italic",
            lineHeight: 16,
          },
        },
      ],
    },
  ],
});
Runnable source as JSON, for any HTTP client: https://api.anyplot.ai/specs/tree-phylogenetic/echarts/code. Any spec id and library id listed in llms-full.txt fit the same URL shape; every URL below is complete and callable.
{
  "spec_id": "tree-phylogenetic",
  "language": "javascript",
  "library": "echarts",
  "page": "https://anyplot.ai/tree-phylogenetic/javascript/echarts",
  "hub": "https://anyplot.ai/tree-phylogenetic",
  "code_json": "https://api.anyplot.ai/specs/tree-phylogenetic/echarts/code",
  "spec_json": "https://api.anyplot.ai/specs/tree-phylogenetic",
  "render_light_png": "https://storage.googleapis.com/anyplot-images/plots/tree-phylogenetic/javascript/echarts/plot-light.png",
  "render_dark_png": "https://storage.googleapis.com/anyplot-images/plots/tree-phylogenetic/javascript/echarts/plot-dark.png",
  "interactive_light_html": "https://storage.googleapis.com/anyplot-images/plots/tree-phylogenetic/javascript/echarts/plot-light.html",
  "interactive_dark_html": "https://storage.googleapis.com/anyplot-images/plots/tree-phylogenetic/javascript/echarts/plot-dark.html",
  "quality_score": 95.0,
  "license": "MIT",
  "guide": "https://anyplot.ai/llms.txt"
}
Part of Phylogenetic Tree Diagram on anyplot.ai.