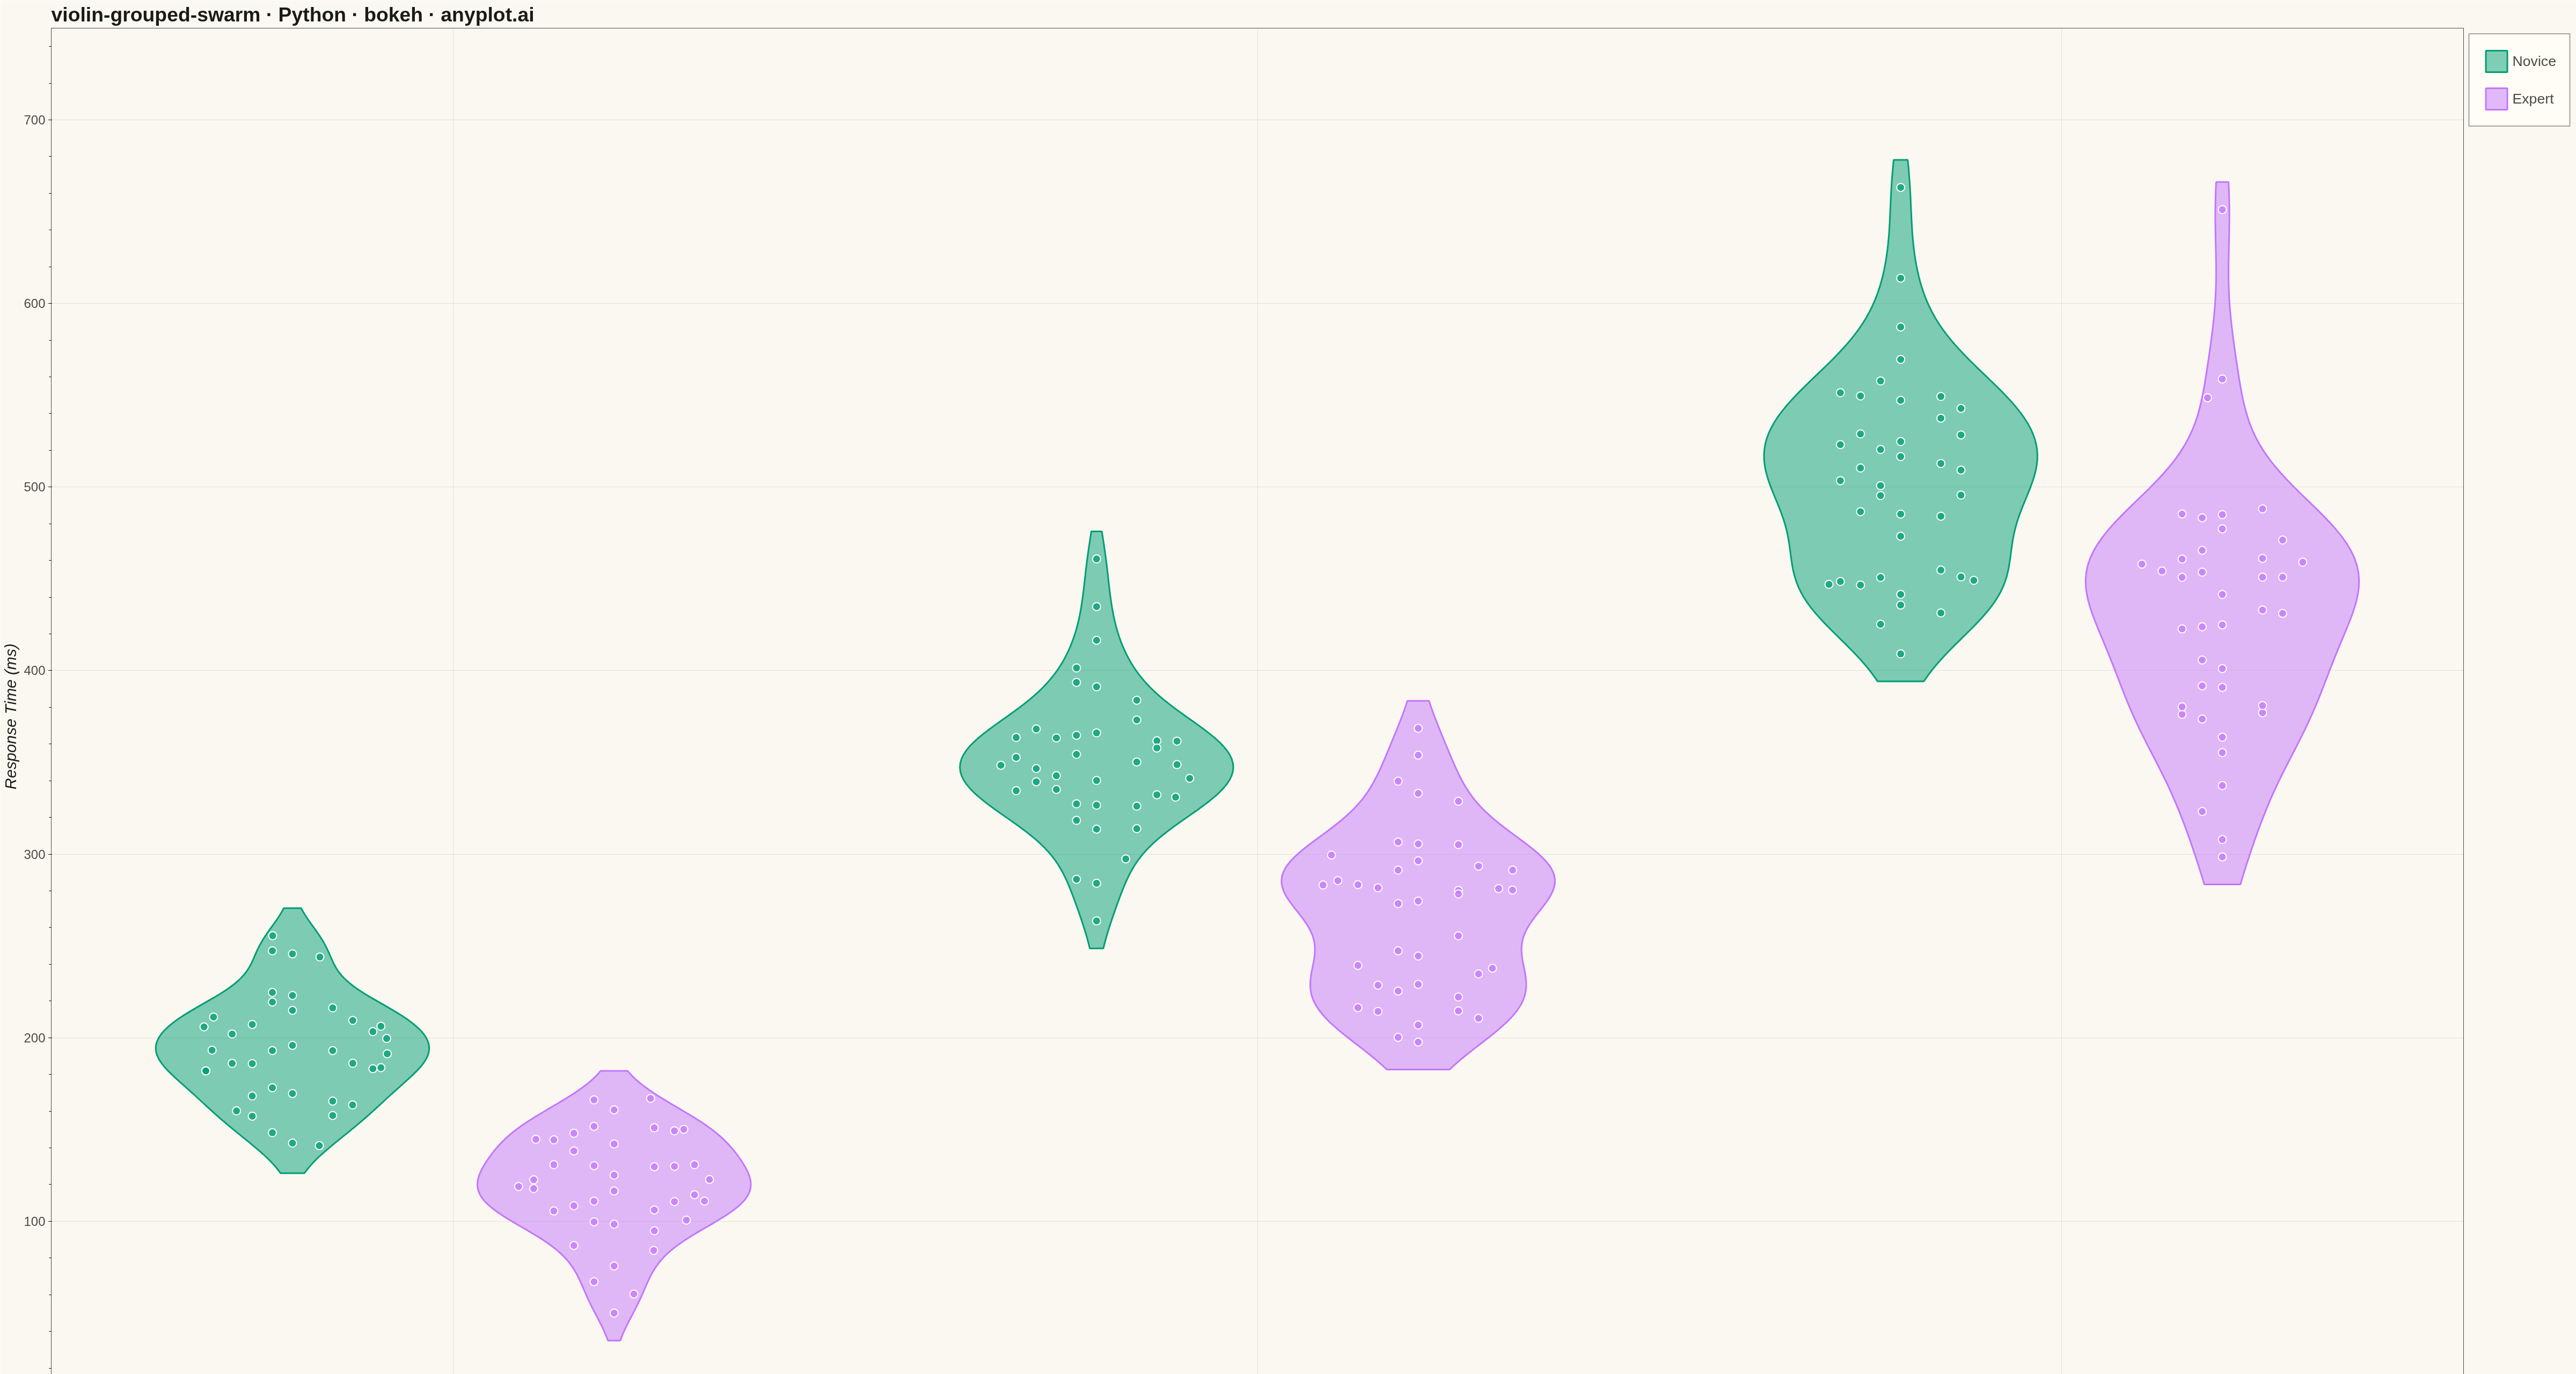
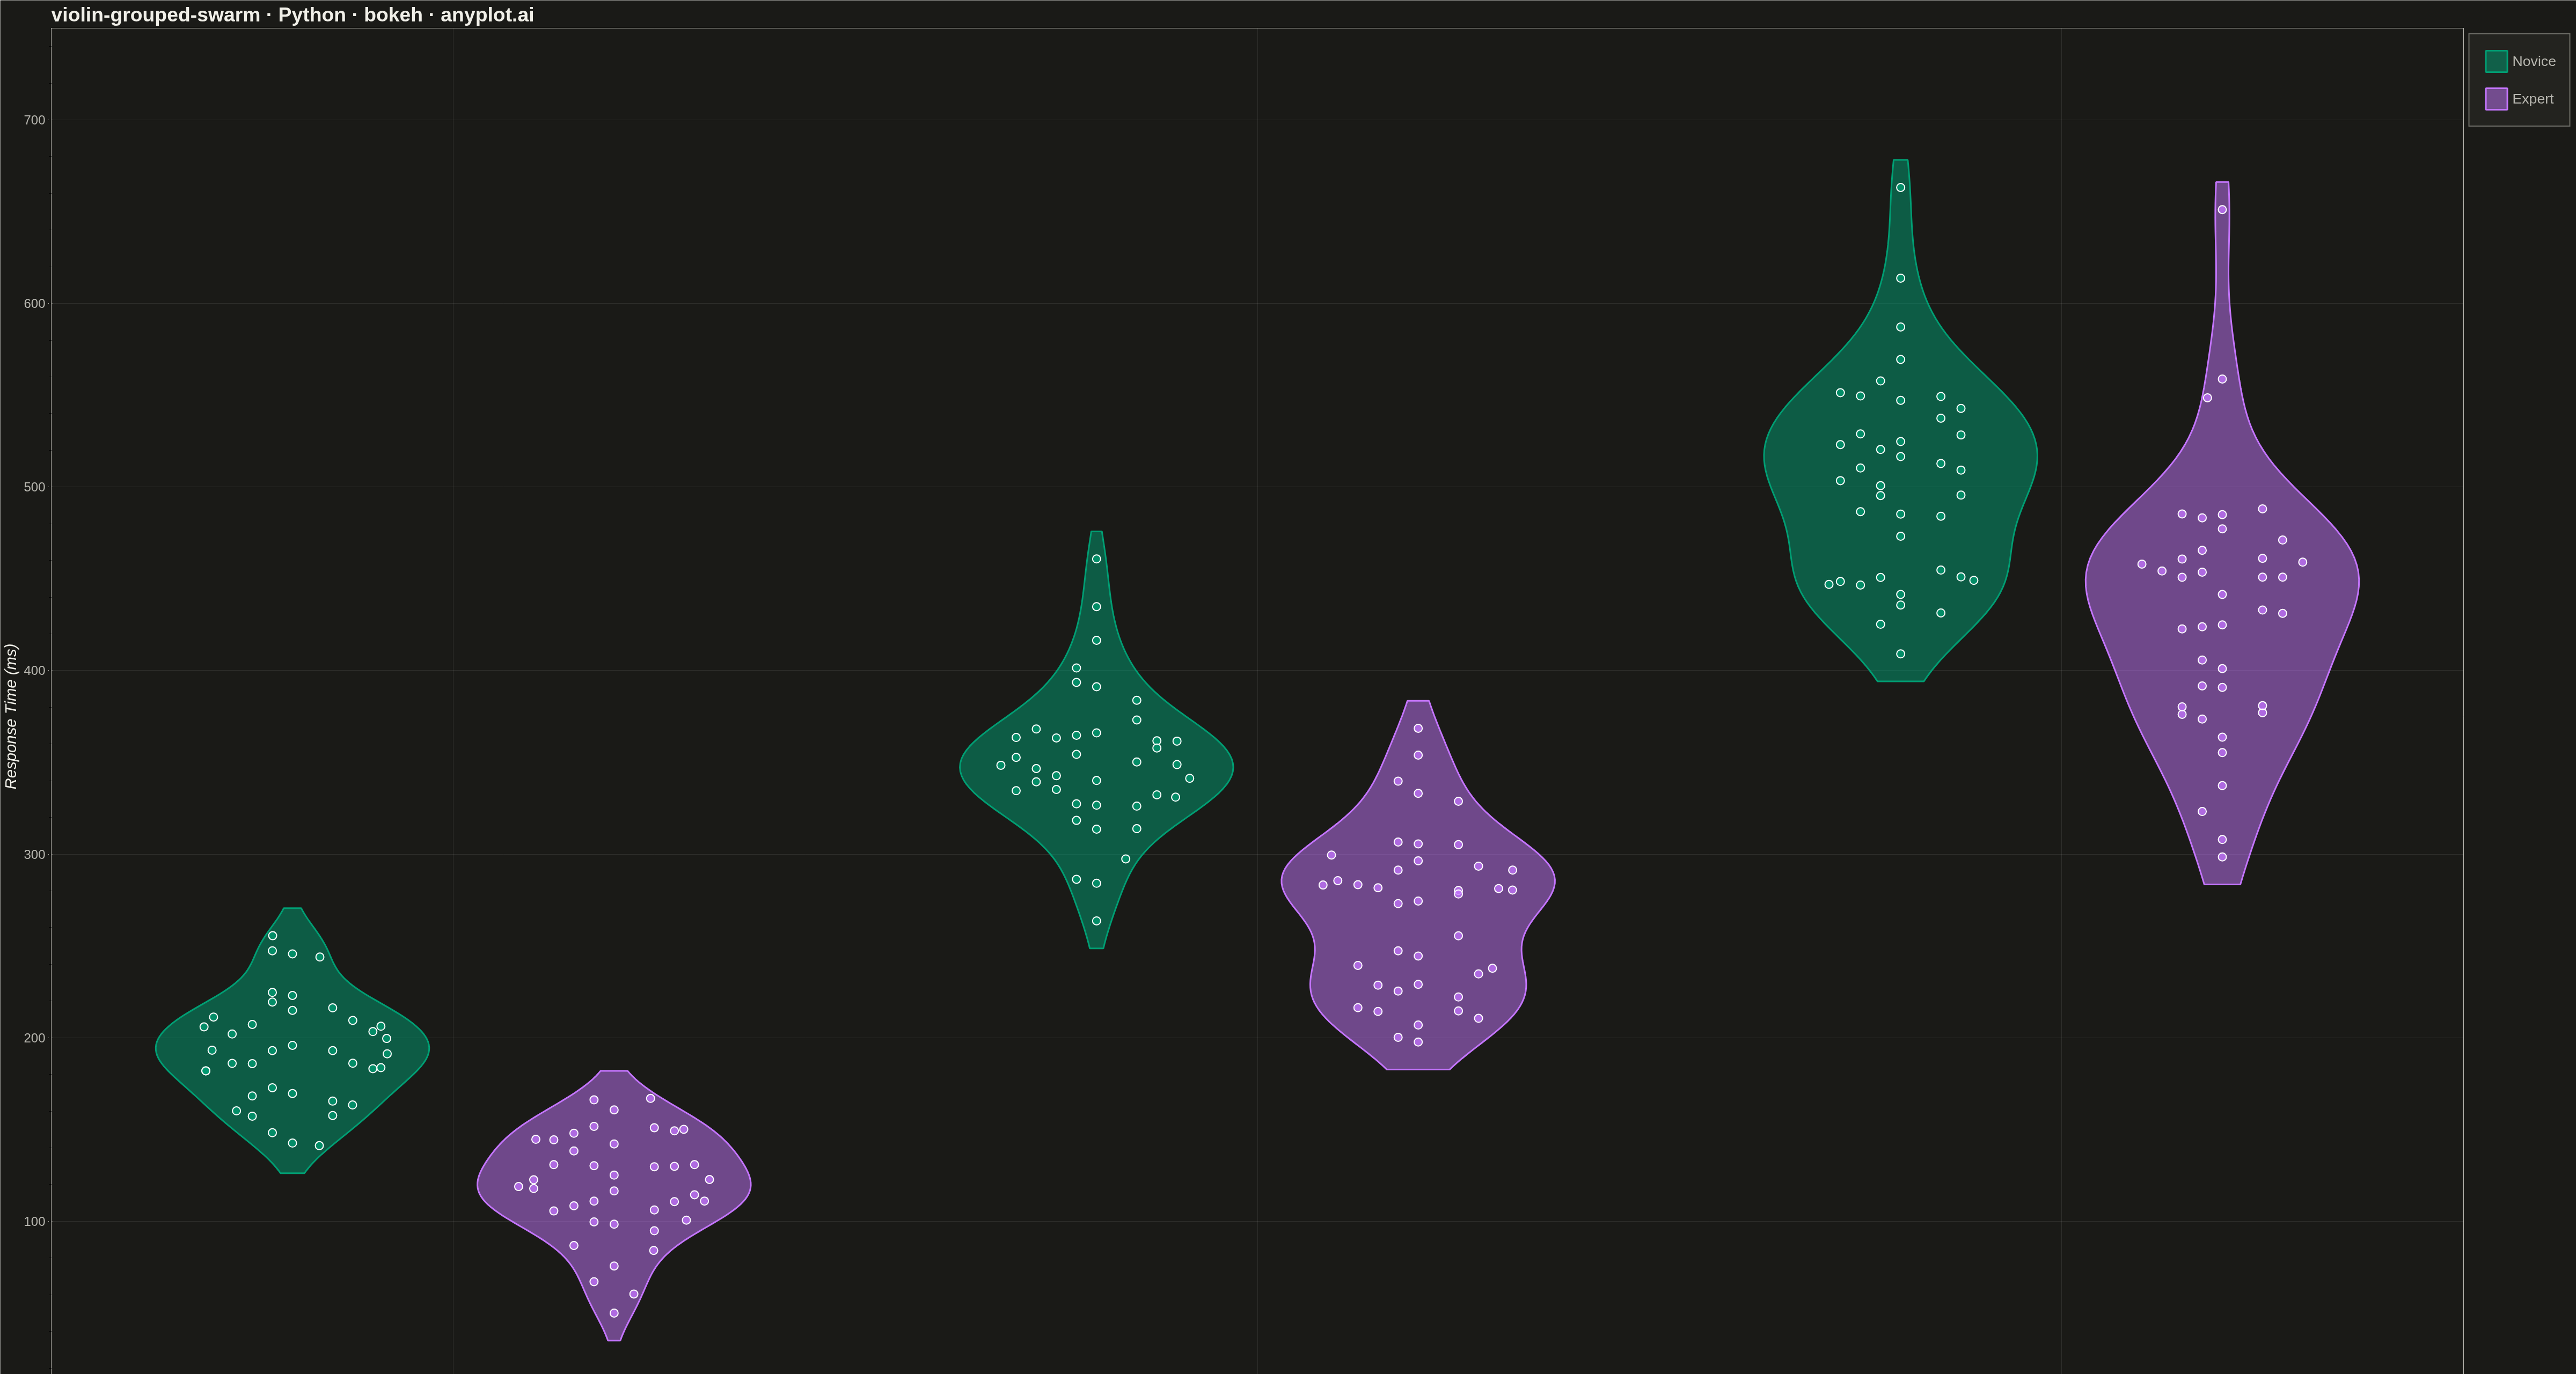
A grouped violin plot with individual data points overlaid as swarm points, showing distributions across two categorical dimensions simultaneously. Multiple violin plots are arranged by category on the x-axis and grouped by a secondary variable using color/hue, with swarm points revealing the underlying raw data. This visualization combines distribution shape visualization with complete data transparency, ideal for comparing how distributions differ across multiple factors.
Preview render from the Bokeh implementation.