The same plot in 14 other libraries — JavaScript: Chart.js, D3.js, Apache ECharts, Highcharts; Python: Altair, Bokeh, lets-plot, Matplotlib, Plotly, plotnine, Pygal, Seaborn; R: ggplot2; Julia: Makie.jl. Compare all 15 side by side: Grouped Violin Plot with Swarm Overlay in Python, R, Julia and JavaScript.
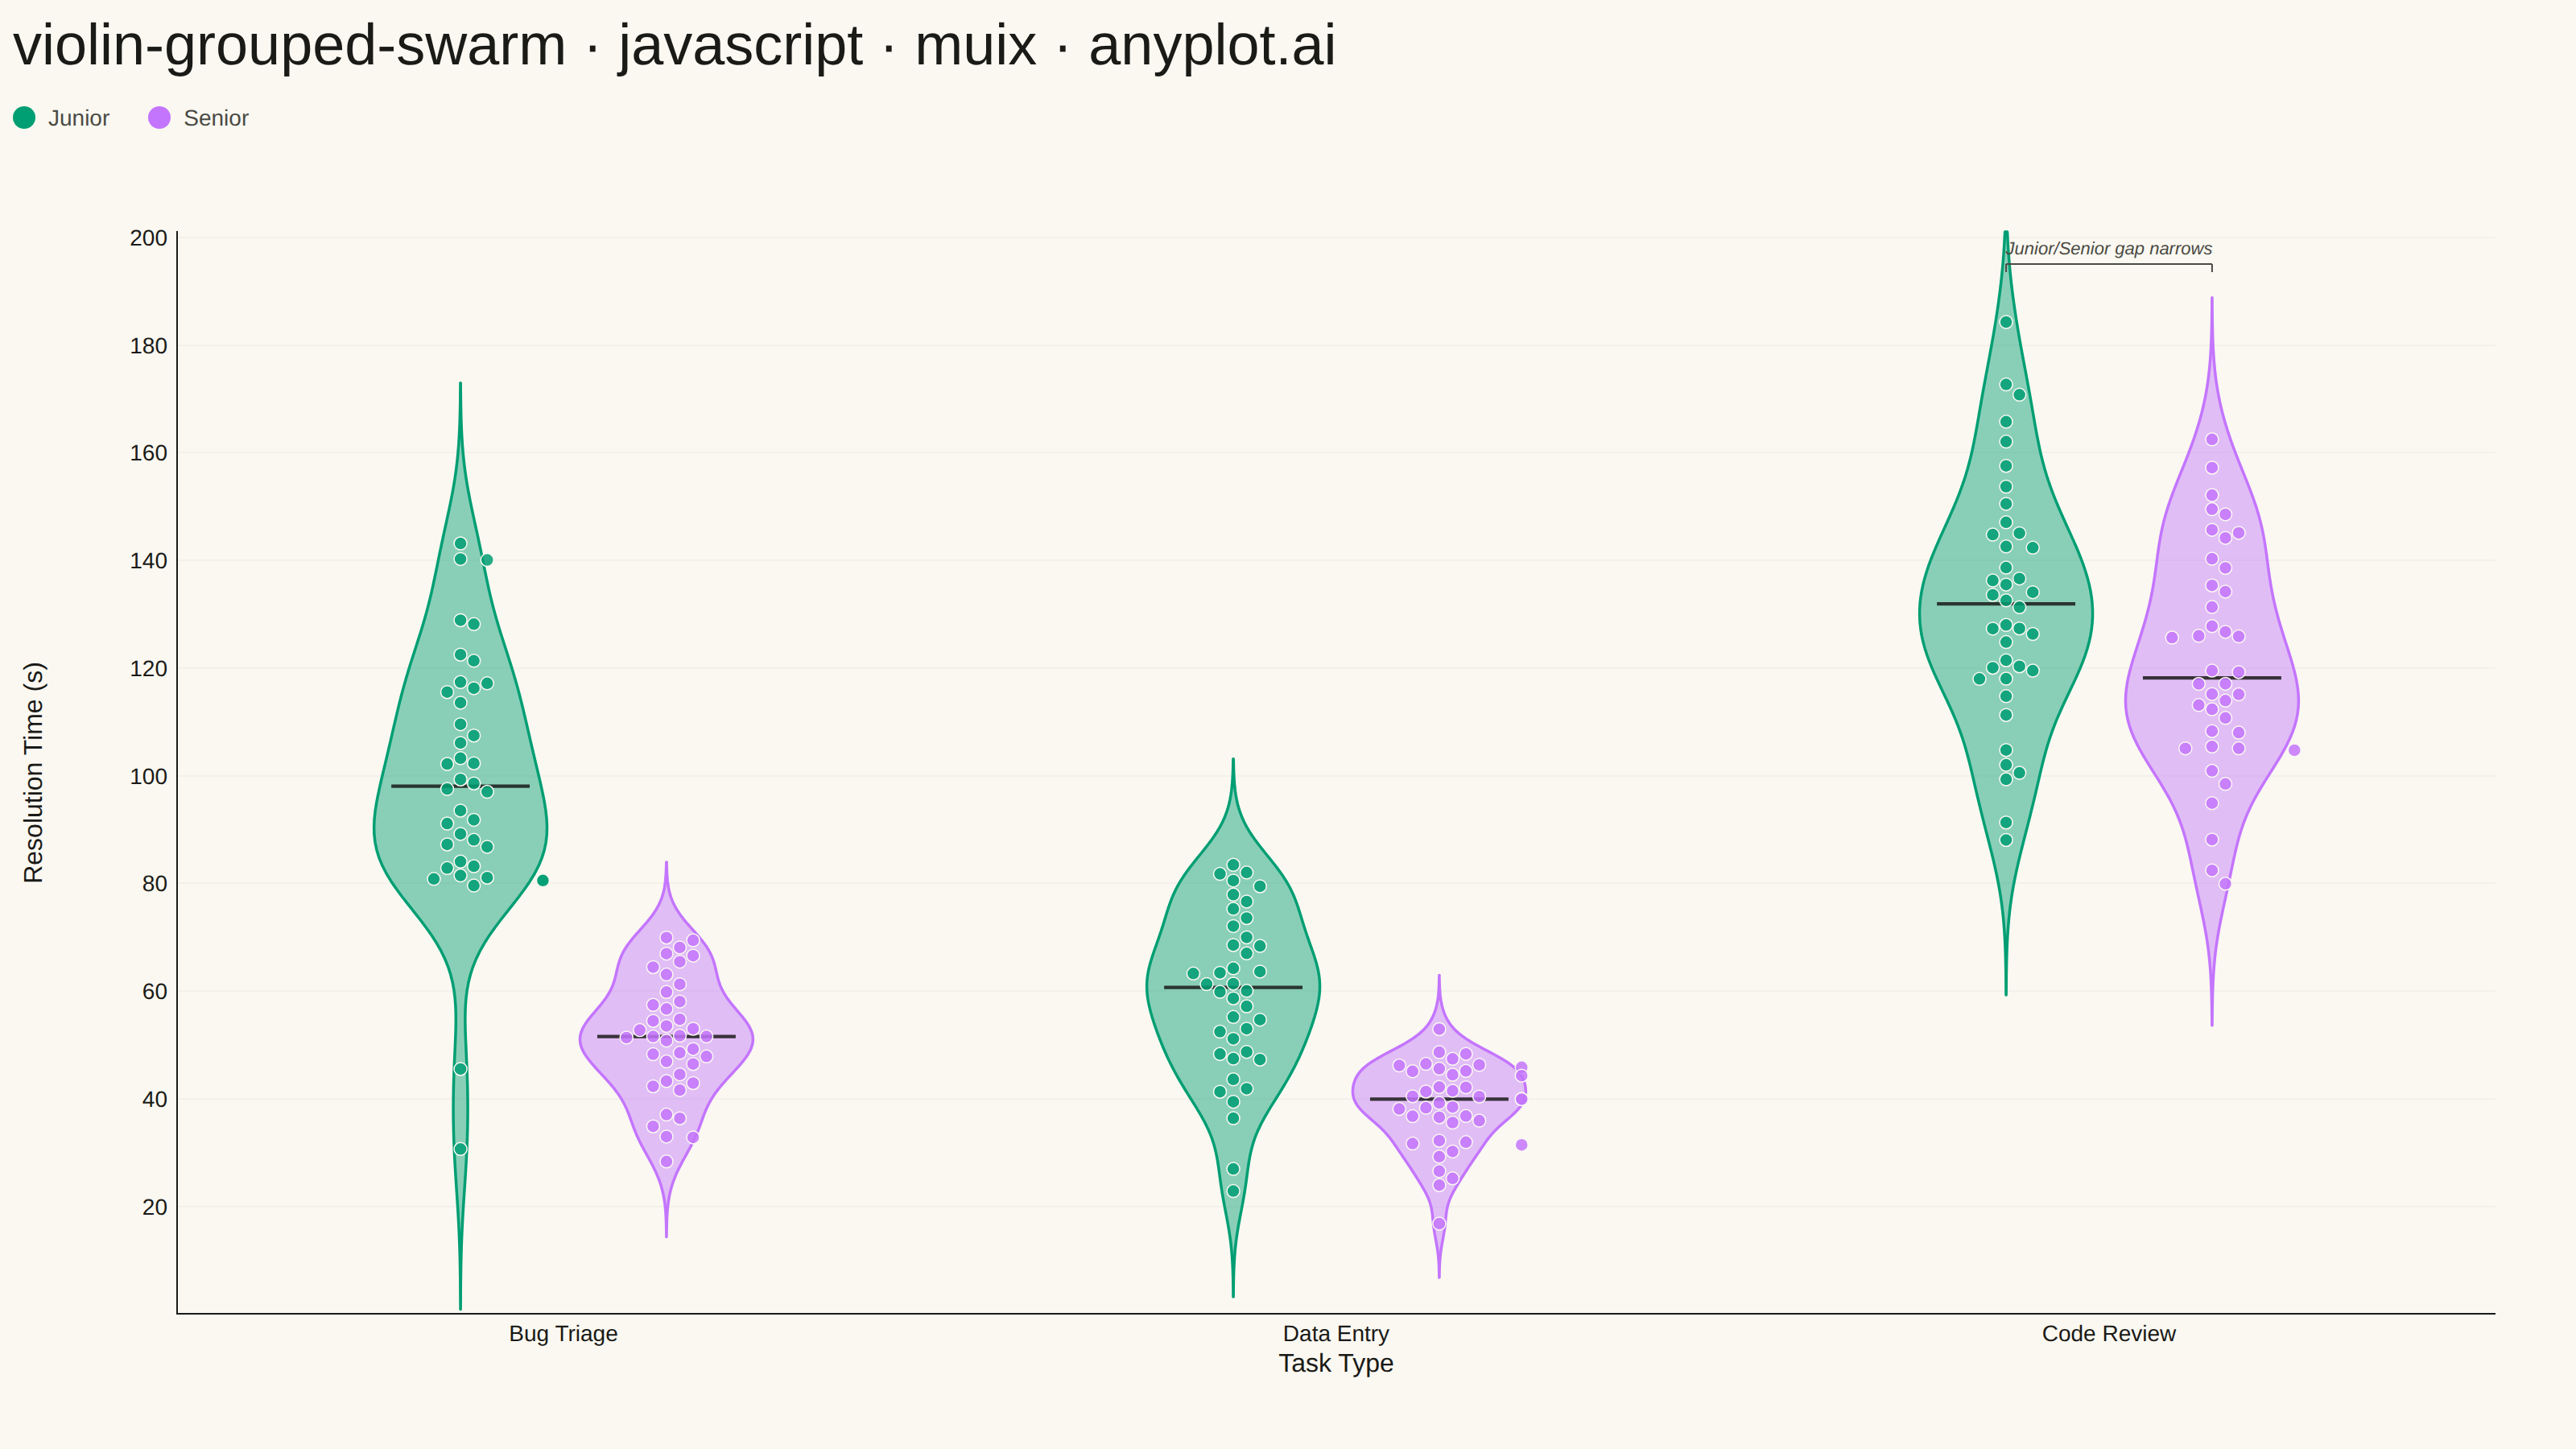
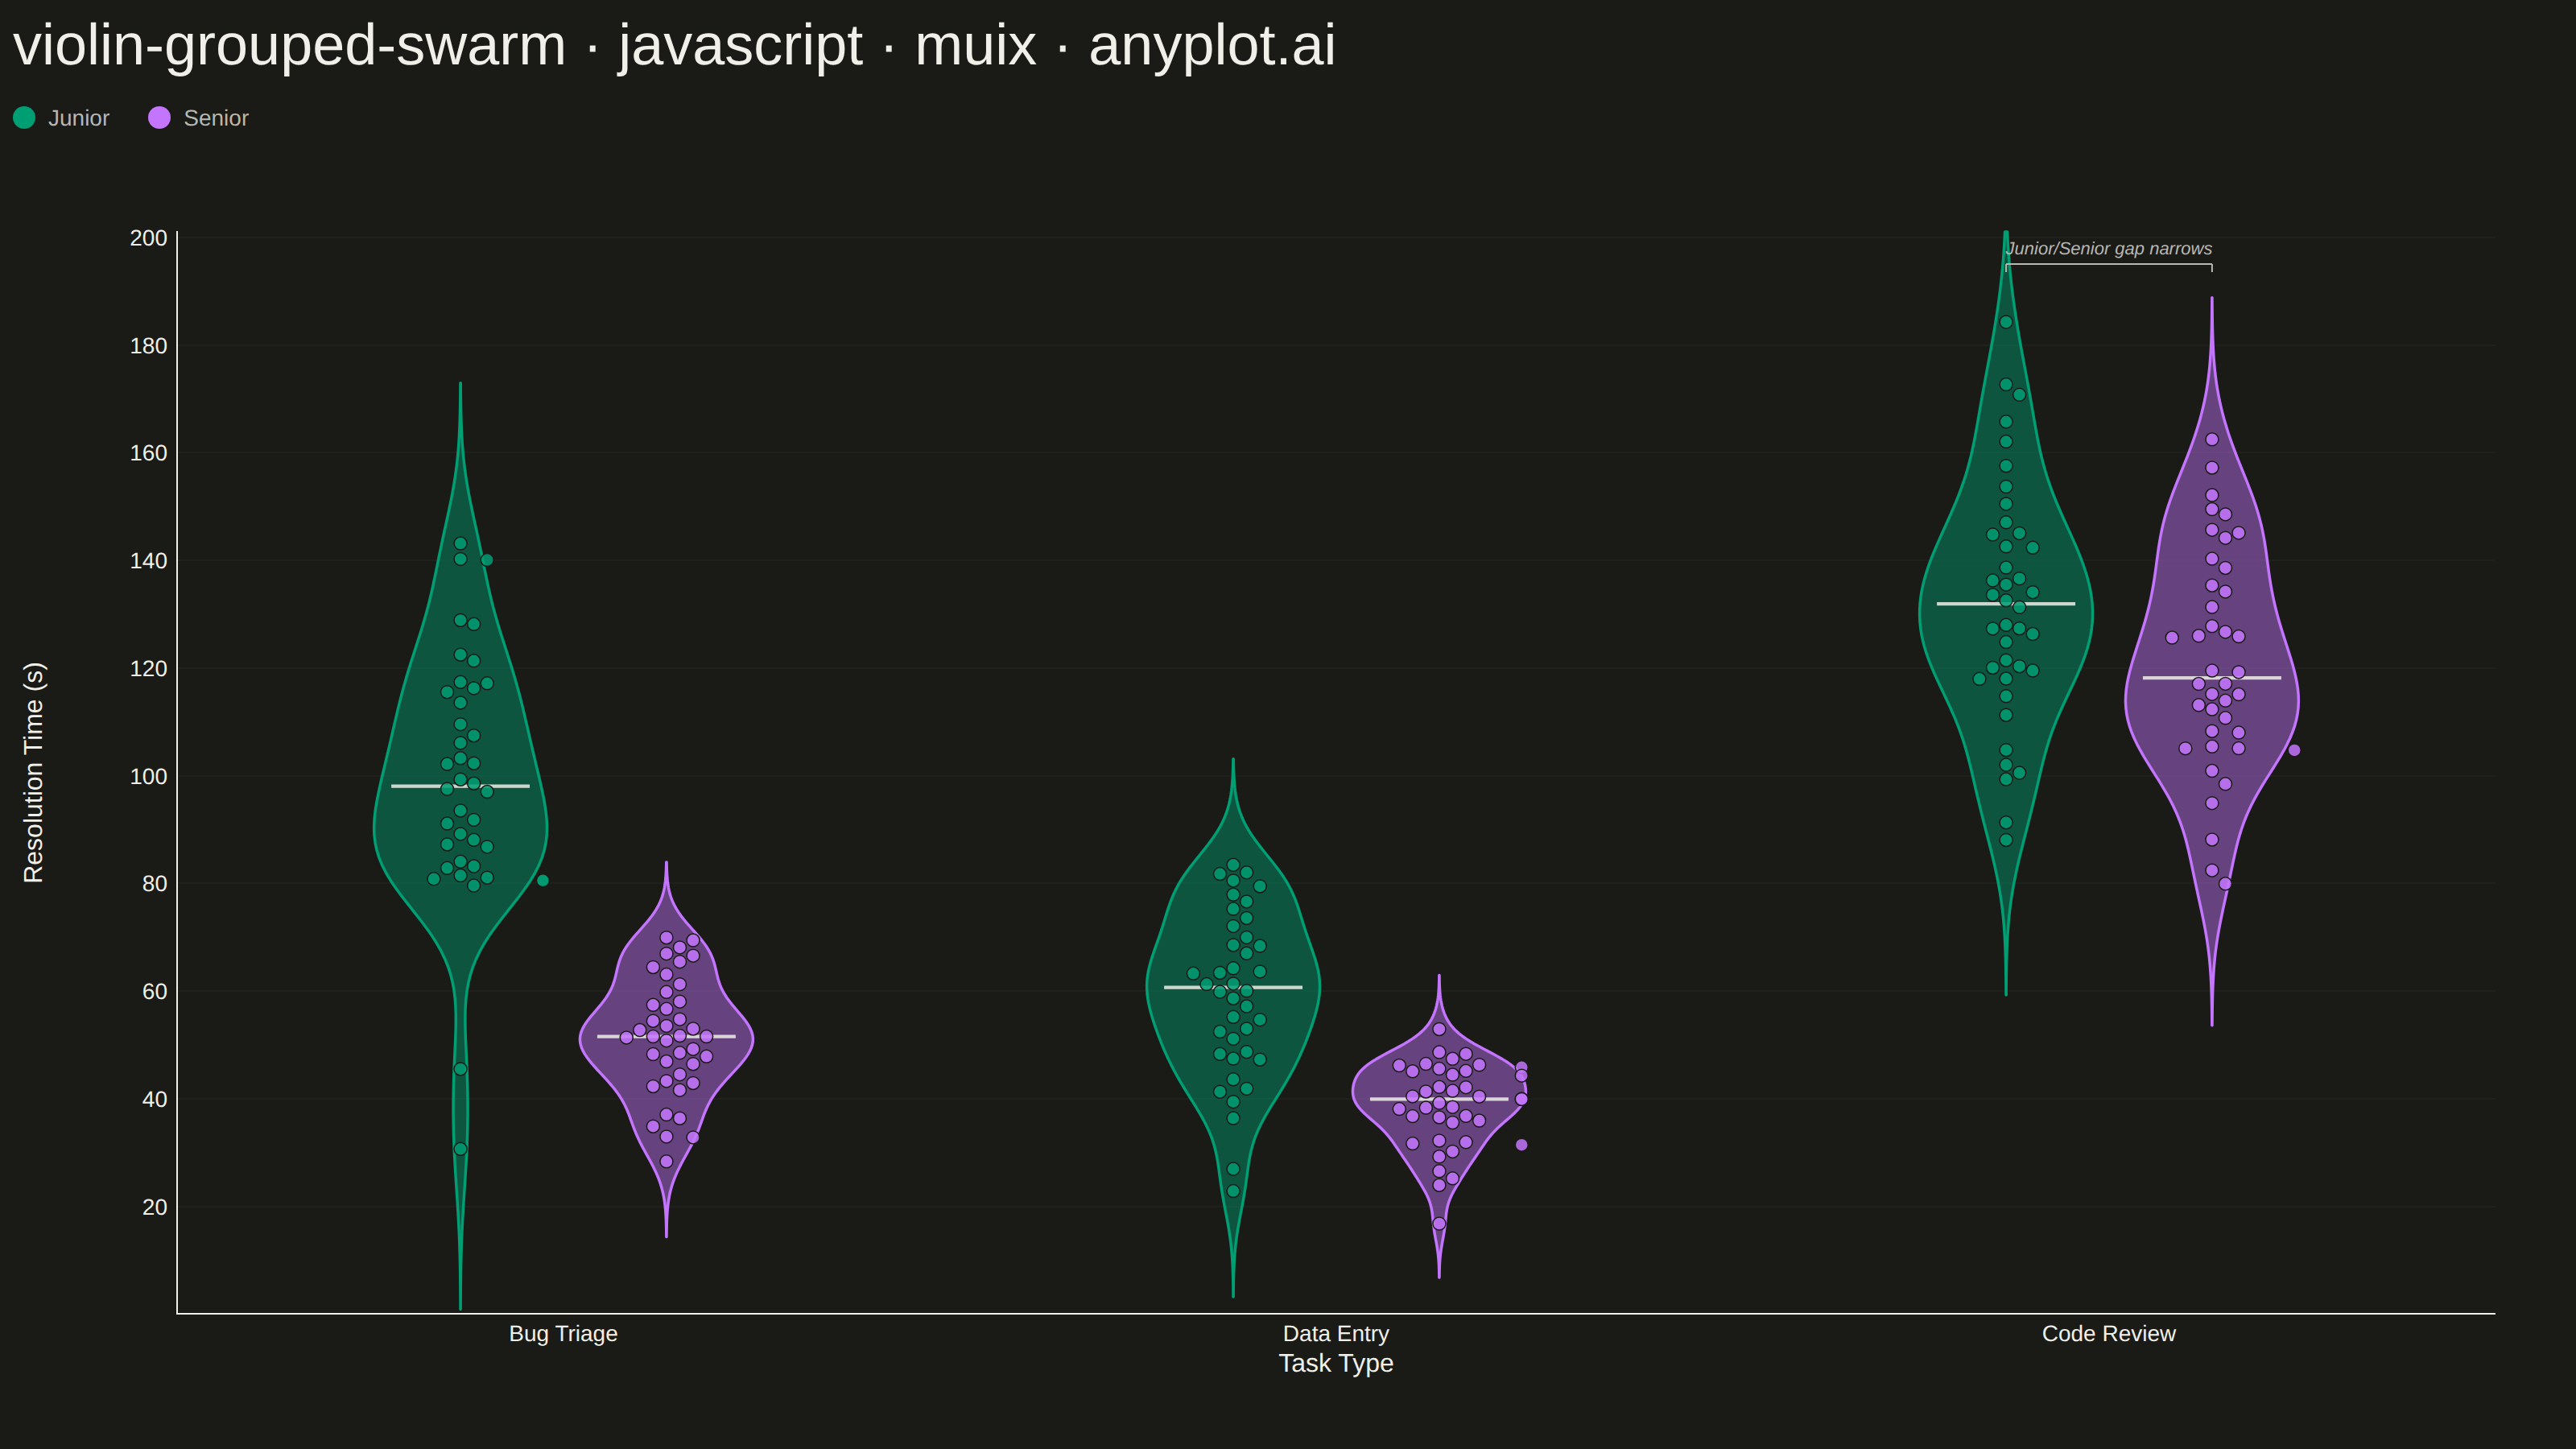
A grouped violin plot with individual data points overlaid as swarm points, showing distributions across two categorical dimensions simultaneously. Multiple violin plots are arranged by category on the x-axis and grouped by a secondary variable using color/hue, with swarm points revealing the underlying raw data. This visualization combines distribution shape visualization with complete data transparency, ideal for comparing how distributions differ across multiple factors.
// anyplot.ai
// violin-grouped-swarm: Grouped Violin Plot with Swarm Overlay
// Library: muix 7.29.1 | JavaScript 22.23.2
// Quality: 92/100 | Created: 2026-09-02
import { ChartContainer } from "@mui/x-charts/ChartContainer";
import { ChartsXAxis } from "@mui/x-charts/ChartsXAxis";
import { ChartsYAxis } from "@mui/x-charts/ChartsYAxis";
import { ChartsGrid } from "@mui/x-charts/ChartsGrid";
import { useXScale, useYScale, useDrawingArea } from "@mui/x-charts/hooks";

const t = window.ANYPLOT_TOKENS;

// --- Deterministic PRNG (LCG) + Box-Muller for approx-normal samples --------
function makeLcg(seed) {
  let state = seed >>> 0;
  return function next() {
    state = (state * 1664525 + 1013904223) >>> 0;
    return state / 4294967296;
  };
}
const rand = makeLcg(42);
function gaussianSample() {
  const u1 = Math.max(rand(), 1e-9);
  const u2 = rand();
  return Math.sqrt(-2 * Math.log(u1)) * Math.cos(2 * Math.PI * u2);
}
function clamp(v, lo, hi) {
  return Math.min(hi, Math.max(lo, v));
}

// --- Data: support-ticket resolution times (s) by task type & agent level --
const CATEGORIES = ["Bug Triage", "Data Entry", "Code Review"];
const GROUPS = ["Junior", "Senior"];
const N_PER_CELL = 40;

// Junior agents run slower and more variably than Senior agents on most task
// types — except Code Review, where the gap nearly closes (both levels lean
// on the same review checklist), a shape only the swarm's raw points make
// obvious against the violins.
const PARAMS = {
  "Bug Triage": { Junior: { mean: 95, std: 24 }, Senior: { mean: 52, std: 12 } },
  "Data Entry": { Junior: { mean: 60, std: 16 }, Senior: { mean: 38, std: 9 } },
  "Code Review": { Junior: { mean: 130, std: 22 }, Senior: { mean: 118, std: 20 } },
};

const cells = CATEGORIES.flatMap((category) =>
  GROUPS.map((group) => {
    const { mean, std } = PARAMS[category][group];
    const values = Array.from({ length: N_PER_CELL }, () => clamp(mean + std * gaussianSample(), 10, 220));
    return { category, group, values };
  }),
);
function getCell(category, group) {
  return cells.find((c) => c.category === category && c.group === group);
}

const allValues = cells.flatMap((c) => c.values);
const dataMin = Math.min(...allValues);
const dataMax = Math.max(...allValues);
const yPad = (dataMax - dataMin) * 0.1;
const Y_MIN = Math.max(0, dataMin - yPad);
const Y_MAX = dataMax + yPad;

function median(values) {
  const sorted = [...values].sort((a, b) => a - b);
  const mid = Math.floor(sorted.length / 2);
  return sorted.length % 2 === 0 ? (sorted[mid - 1] + sorted[mid]) / 2 : sorted[mid];
}
function stdOf(values) {
  const m = values.reduce((a, b) => a + b, 0) / values.length;
  const variance = values.reduce((a, b) => a + (b - m) ** 2, 0) / (values.length - 1);
  return Math.sqrt(variance);
}

// --- Gaussian KDE per cell, Silverman bandwidth, normalized to its own peak
// so each violin shows shape, not sample count. Each cell gets its OWN grid,
// local to its data range ± 3 bandwidths (clipped to the shared axis domain)
// rather than the full shared Y_MIN..Y_MAX span — otherwise a cell whose
// values cluster in a narrow band (e.g. Data Entry) draws a near-invisible
// KDE tail that still strokes a hairline the full height of the axis.
const GRID_N = 120;
function kde(values) {
  const n = values.length;
  const bandwidth = 0.9 * stdOf(values) * Math.pow(n, -0.2);
  const localMin = Math.max(Y_MIN, Math.min(...values) - 3 * bandwidth);
  const localMax = Math.min(Y_MAX, Math.max(...values) + 3 * bandwidth);
  const grid = Array.from({ length: GRID_N }, (_, k) => localMin + (k * (localMax - localMin)) / (GRID_N - 1));
  const raw = grid.map((gy) => values.reduce((sum, v) => sum + Math.exp(-0.5 * ((gy - v) / bandwidth) ** 2), 0));
  const peak = Math.max(...raw);
  return { grid, density: raw.map((v) => v / peak) };
}
cells.forEach((cell) => {
  const { grid, density } = kde(cell.values);
  cell.grid = grid;
  cell.density = density;
  cell.median = median(cell.values);
});

// --- Beeswarm packing in pixel space: points are sorted by value and pushed
// sideways from the violin's centerline only when they'd overlap a neighbor
// already placed, capped at maxHalfWidth so the swarm stays inside its violin.
function layoutSwarmForCell(values, yScale, markerRadius, maxHalfWidth) {
  const diameter = markerRadius * 2 + 1;
  const step = diameter * 0.92;
  const maxK = Math.max(1, Math.floor(maxHalfWidth / step));
  const sorted = values.map((v) => ({ value: v, y: yScale(v) })).sort((a, b) => a.y - b.y);
  const placed = [];
  sorted.forEach((point) => {
    const nearby = placed.filter((p) => Math.abs(point.y - p.y) < diameter);
    let offsetPx = 0;
    if (nearby.length > 0) {
      let resolved = false;
      let k = 0;
      while (!resolved && k <= maxK) {
        const candidate = k === 0 ? 0 : (k % 2 === 1 ? Math.ceil(k / 2) : -Math.ceil(k / 2)) * step;
        if (nearby.every((p) => Math.hypot(candidate - p.offsetPx, point.y - p.y) >= diameter * 0.95)) {
          offsetPx = candidate;
          resolved = true;
        }
        k += 1;
      }
      if (!resolved) offsetPx = (k % 2 === 1 ? 1 : -1) * maxHalfWidth;
    }
    placed.push({ ...point, offsetPx });
  });
  return placed;
}

// A small labeled bracket that calls out the Code Review group's narrowing
// Junior/Senior gap — the standout finding in the data — rendered in the
// padding zone above Y_MAX (below `top`, above where any KDE curve or swarm
// point can reach) so it never collides with the marks it's annotating.
function GapAnnotation({ x1, x2, y, label }) {
  return (
    <g>
      <line x1={x1} x2={x2} y1={y} y2={y} stroke={t.inkSoft} strokeWidth={1} />
      <line x1={x1} x2={x1} y1={y} y2={y + 5} stroke={t.inkSoft} strokeWidth={1} />
      <line x1={x2} x2={x2} y1={y} y2={y + 5} stroke={t.inkSoft} strokeWidth={1} />
      <text x={(x1 + x2) / 2} y={y - 6} textAnchor="middle" fontSize={11} fontStyle="italic" fill={t.inkSoft}>
        {label}
      </text>
    </g>
  );
}

// --- Grouped violins (mirrored KDE, dodged by group within each category's
// band) with swarm points overlaid, matching each violin's hue. A custom SVG
// layer positioned via the chart's own band/linear scale hooks — the
// community package (7.29.1) has no violin/swarm component, so this is the
// documented "composition" technique for chart types MUI X doesn't ship.
function GroupedViolinSwarm() {
  const xScale = useXScale();
  const yScale = useYScale();
  const { top } = useDrawingArea();
  const bandwidth = xScale.bandwidth();
  const groupWidth = bandwidth * 0.82;
  const slotWidth = groupWidth / GROUPS.length;
  const violinHalfWidth = slotWidth * 0.42;
  const swarmMaxHalfWidth = slotWidth * 0.4;
  const markerRadius = 4;

  return (
    <g>
      {CATEGORIES.map((category) => {
        const bandStart = xScale(category) ?? 0;
        const groupStart = bandStart + (bandwidth - groupWidth) / 2;

        const groupData = GROUPS.map((group, groupIndex) => ({
          group,
          groupIndex,
          cell: getCell(category, group),
          color: t.palette[groupIndex % t.palette.length],
          cx: groupStart + slotWidth * (groupIndex + 0.5),
        }));

        return (
          <g key={category}>
            {groupData.map(({ group, cell, color, cx }) => {
              const leftSide = cell.grid.map((gy, k) => `${cx - cell.density[k] * violinHalfWidth},${yScale(gy)}`);
              const rightSide = cell.grid.map((gy, k) => `${cx + cell.density[k] * violinHalfWidth},${yScale(gy)}`).reverse();
              const violinPath = `M${leftSide.join(" L")} L${rightSide.join(" L")} Z`;

              const swarmPoints = layoutSwarmForCell(cell.values, yScale, markerRadius, swarmMaxHalfWidth);

              return (
                <g key={`${category}-${group}`}>
                  <path d={violinPath} fill={color} fillOpacity={0.45} stroke={color} strokeWidth={1.75} strokeLinejoin="round" />
                  <line
                    x1={cx - violinHalfWidth * 0.8}
                    x2={cx + violinHalfWidth * 0.8}
                    y1={yScale(cell.median)}
                    y2={yScale(cell.median)}
                    stroke={t.ink}
                    strokeWidth={2.1}
                    strokeOpacity={0.85}
                  />
                  {swarmPoints.map((p, i) => (
                    <circle
                      key={i}
                      cx={cx + p.offsetPx}
                      cy={p.y}
                      r={markerRadius}
                      fill={color}
                      fillOpacity={0.85}
                      stroke={t.pageBg}
                      strokeWidth={0.75}
                    />
                  ))}
                </g>
              );
            })}
            {category === "Code Review" && (
              <GapAnnotation
                x1={groupData[0].cx}
                x2={groupData[1].cx}
                y={top + 20}
                label="Junior/Senior gap narrows"
              />
            )}
          </g>
        );
      })}
    </g>
  );
}

// Custom y-axis title, positioned well clear of the (up to 3-digit) tick
// labels — MUI X's built-in yAxis `label` sits at a fixed offset from the
// axis line that doesn't grow with tick-label width, which crowds a 3-digit
// value axis. Rendering it ourselves via useDrawingArea sidesteps that.
function YAxisLabel({ text }) {
  const { top, height } = useDrawingArea();
  const cy = top + height / 2;
  return (
    <text x={26} y={cy} textAnchor="middle" transform={`rotate(-90, 26, ${cy})`} fontSize={16} fill={t.ink}>
      {text}
    </text>
  );
}

const TITLE = "violin-grouped-swarm · javascript · muix · anyplot.ai";
const TITLE_HEIGHT = 56;
const LEGEND_HEIGHT = 34;
const GAP = 20;

export default function Chart() {
  const W = window.ANYPLOT_SIZE.width;
  const H = window.ANYPLOT_SIZE.height;
  const chartHeight = H - TITLE_HEIGHT - LEGEND_HEIGHT - GAP;

  return (
    <div style={{ width: W, height: H, display: "flex", flexDirection: "column" }}>
      <div style={{ height: TITLE_HEIGHT, display: "flex", alignItems: "center", paddingLeft: 8 }}>
        <span style={{ fontSize: 36, fontWeight: 500, color: t.ink }}>{TITLE}</span>
      </div>
      <div style={{ height: LEGEND_HEIGHT, display: "flex", alignItems: "center", gap: 24, paddingLeft: 8 }}>
        {GROUPS.map((group, i) => (
          <div key={group} style={{ display: "flex", alignItems: "center", gap: 8 }}>
            <span style={{ width: 14, height: 14, borderRadius: 7, background: t.palette[i], display: "inline-block" }} />
            <span style={{ fontSize: 14, color: t.inkSoft }}>{group}</span>
          </div>
        ))}
      </div>
      <div style={{ height: GAP }} />
      <ChartContainer
        width={W}
        height={chartHeight}
        series={[]}
        skipAnimation
        margin={{ top: 34, right: 50, bottom: 84, left: 110 }}
        xAxis={[
          {
            id: "category",
            scaleType: "band",
            data: CATEGORIES,
            categoryGapRatio: 0.35,
            disableTicks: true,
            label: "Task Type",
            labelStyle: { fontSize: 16 },
            tickLabelStyle: { fontSize: 14 },
          },
        ]}
        yAxis={[
          {
            id: "value",
            min: Y_MIN,
            max: Y_MAX,
            disableTicks: true,
            tickLabelStyle: { fontSize: 14 },
          },
        ]}
      >
        <ChartsGrid
          horizontal
          sx={{
            "& .MuiChartsGrid-line": {
              stroke: t.grid,
              opacity: 0.2,
            },
          }}
        />
        <GroupedViolinSwarm />
        <ChartsXAxis axisId="category" />
        <ChartsYAxis axisId="value" />
        <YAxisLabel text="Resolution Time (s)" />
      </ChartContainer>
    </div>
  );
}
Runnable source as JSON, for any HTTP client: https://api.anyplot.ai/specs/violin-grouped-swarm/muix/code. Any spec id and library id listed in llms-full.txt fit the same URL shape; every URL below is complete and callable.
{
  "spec_id": "violin-grouped-swarm",
  "language": "javascript",
  "library": "muix",
  "page": "https://anyplot.ai/violin-grouped-swarm/javascript/muix",
  "hub": "https://anyplot.ai/violin-grouped-swarm",
  "code_json": "https://api.anyplot.ai/specs/violin-grouped-swarm/muix/code",
  "spec_json": "https://api.anyplot.ai/specs/violin-grouped-swarm",
  "render_light_png": "https://storage.googleapis.com/anyplot-images/plots/violin-grouped-swarm/javascript/muix/plot-light.png",
  "render_dark_png": "https://storage.googleapis.com/anyplot-images/plots/violin-grouped-swarm/javascript/muix/plot-dark.png",
  "interactive_light_html": "https://storage.googleapis.com/anyplot-images/plots/violin-grouped-swarm/javascript/muix/plot-light.html",
  "interactive_dark_html": "https://storage.googleapis.com/anyplot-images/plots/violin-grouped-swarm/javascript/muix/plot-dark.html",
  "quality_score": 92.0,
  "license": "MIT",
  "guide": "https://anyplot.ai/llms.txt"
}
Part of Grouped Violin Plot with Swarm Overlay on anyplot.ai.