The same plot in 14 other libraries — JavaScript: D3.js, Apache ECharts, Highcharts, MUI X Charts; Python: Altair, Bokeh, lets-plot, Matplotlib, Plotly, plotnine, Pygal, Seaborn; R: ggplot2; Julia: Makie.jl. Compare all 15 side by side: Grouped Violin Plot with Swarm Overlay in Python, R, Julia and JavaScript.
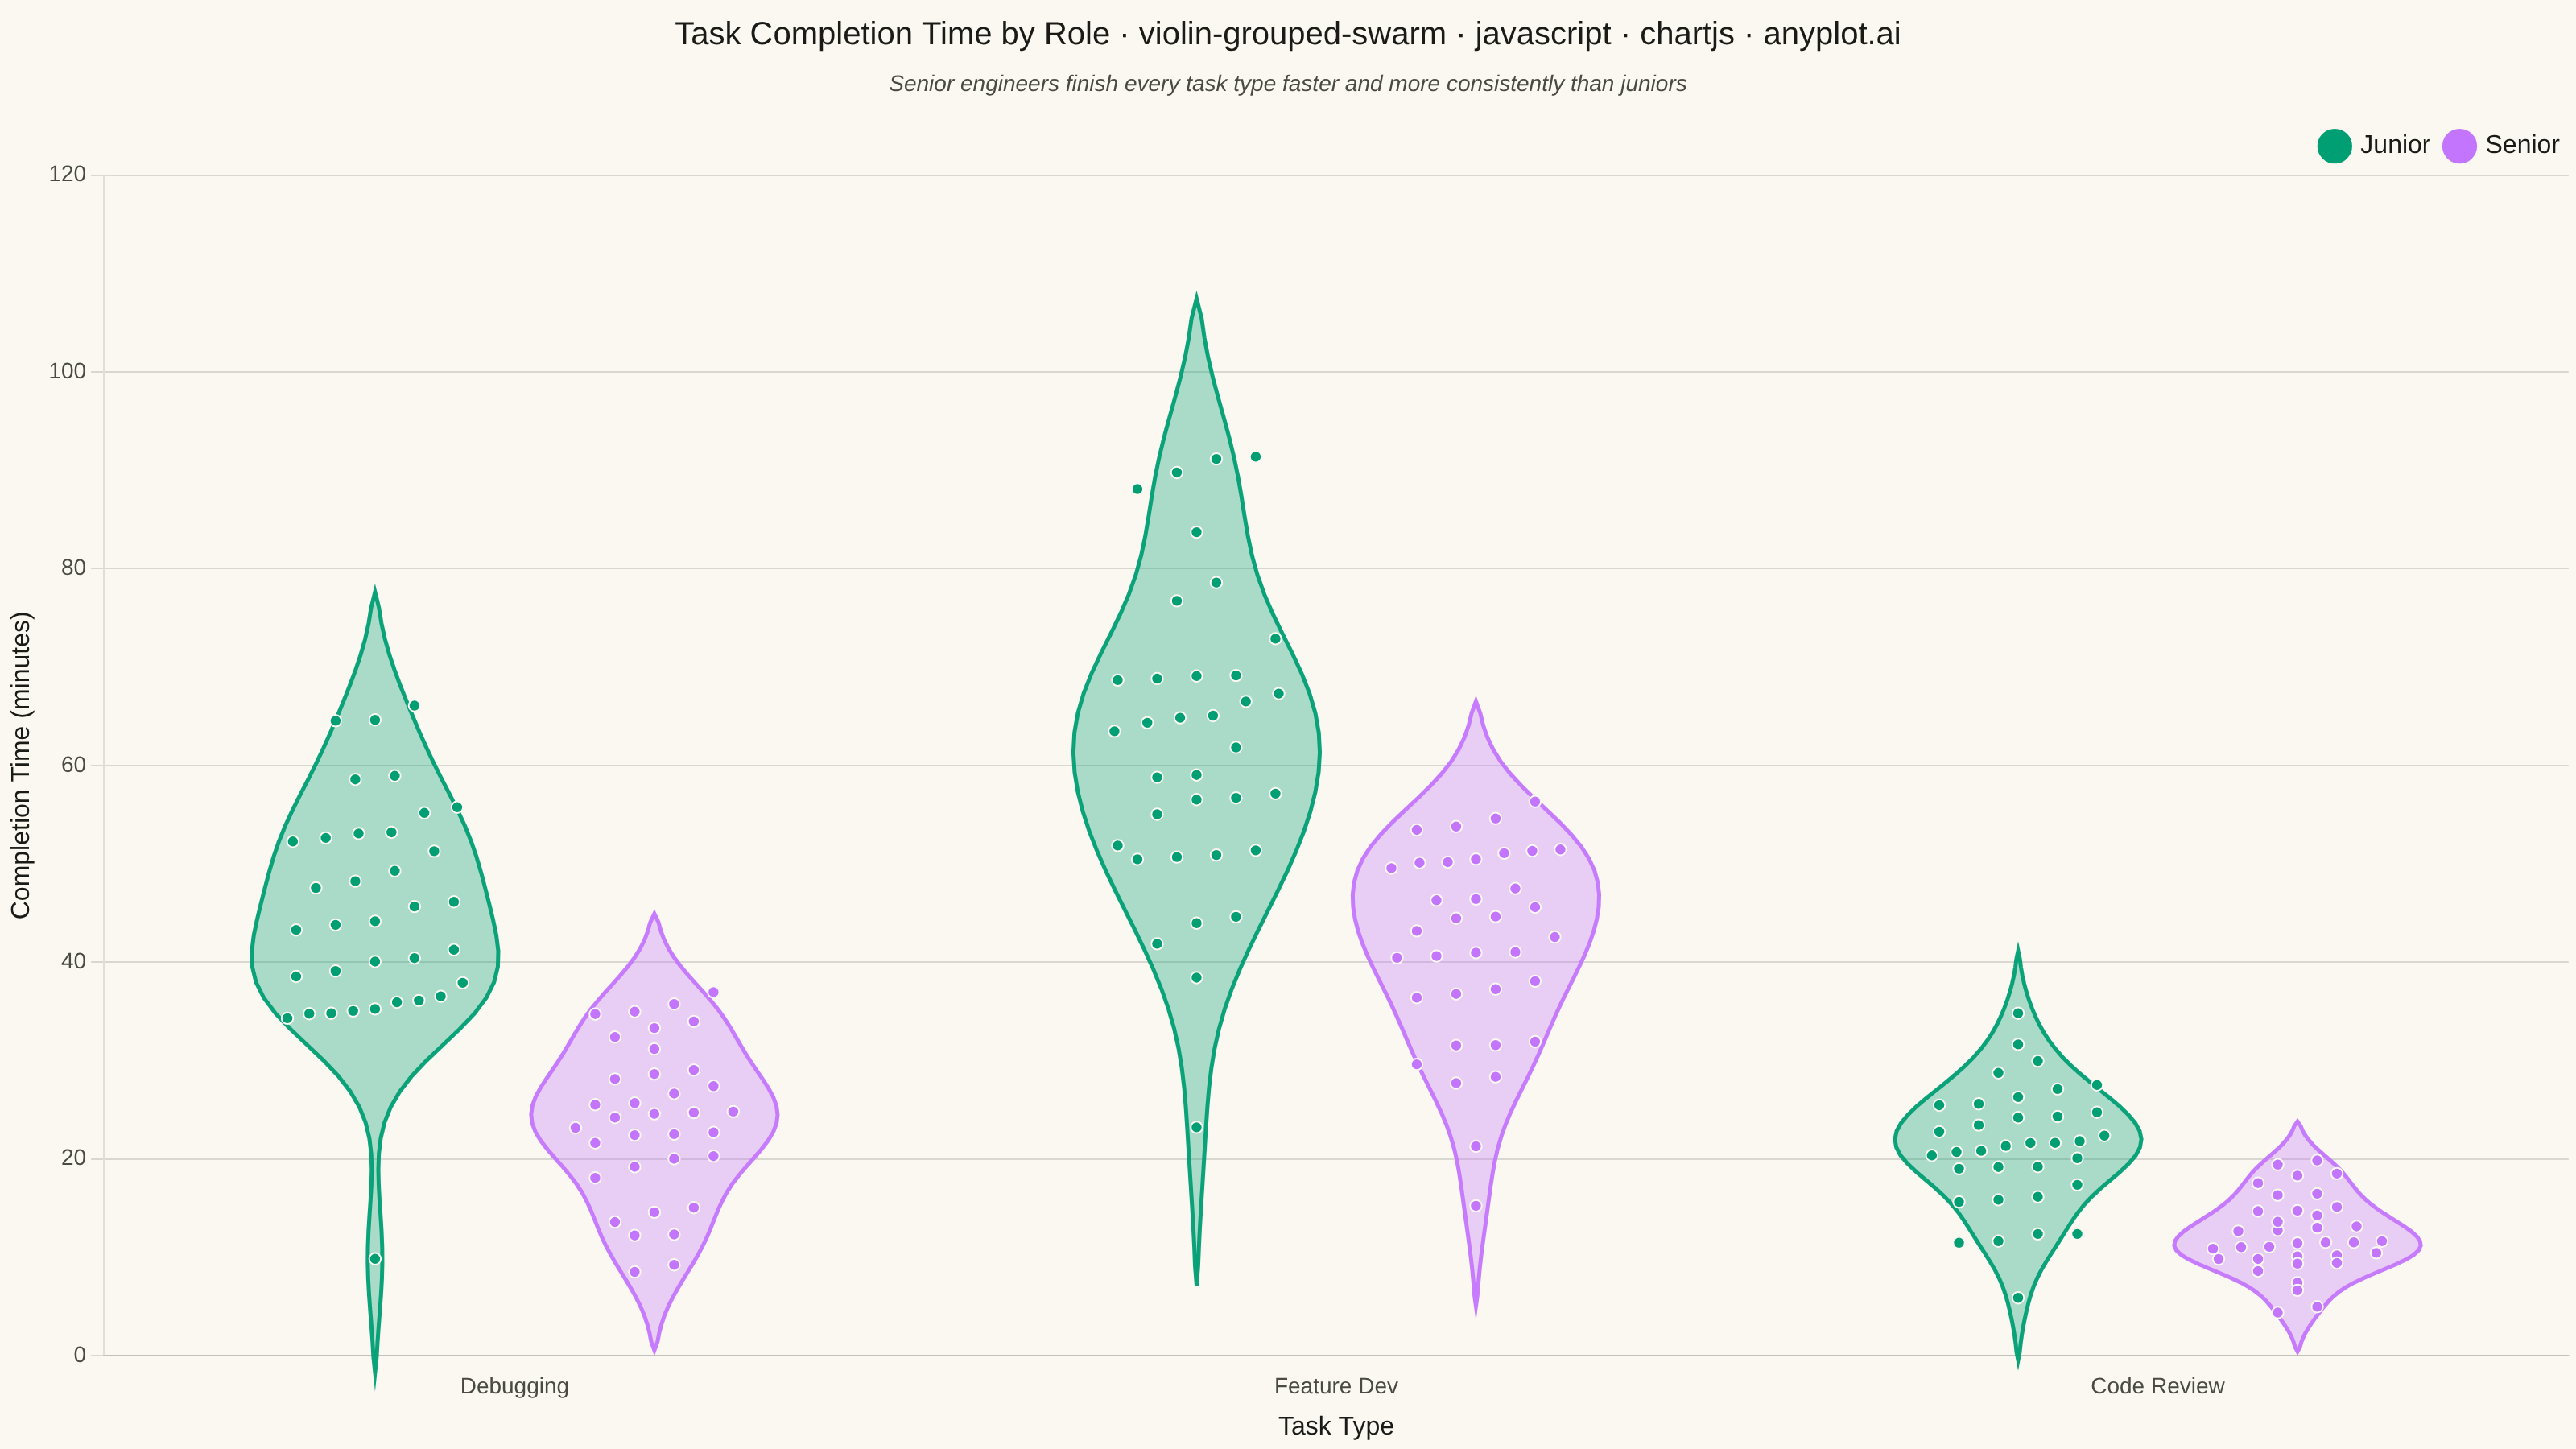
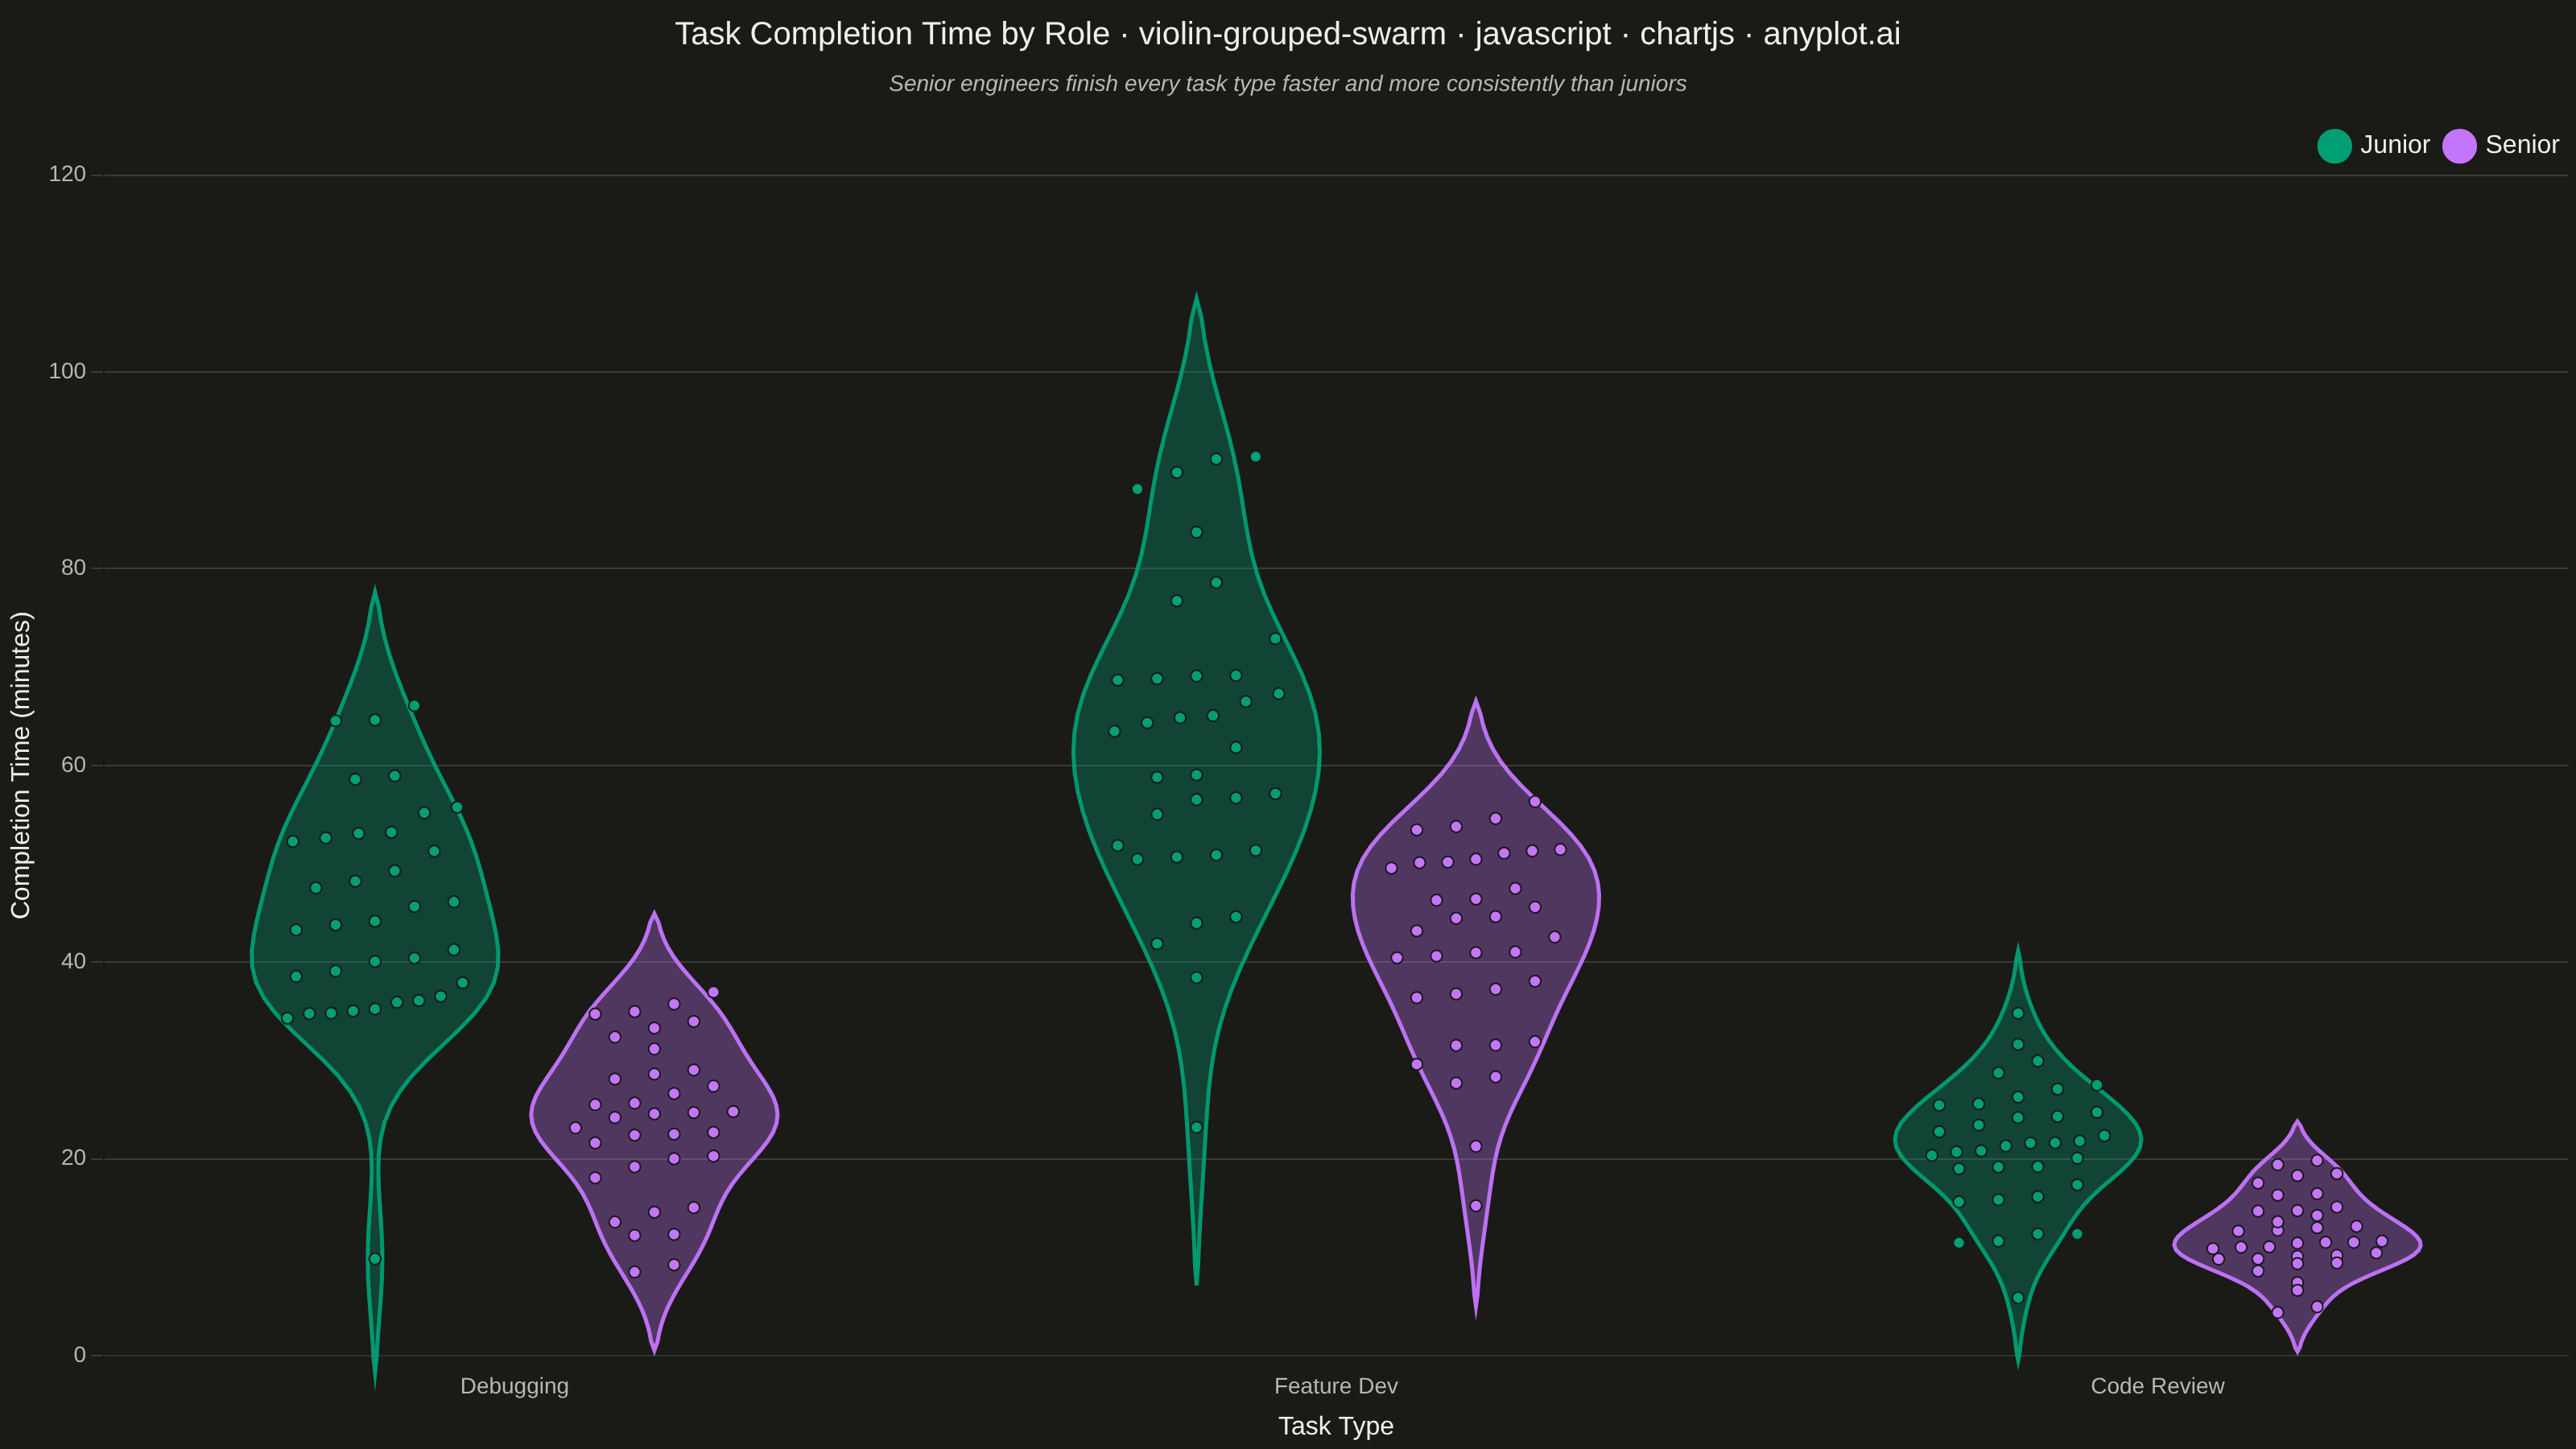
A grouped violin plot with individual data points overlaid as swarm points, showing distributions across two categorical dimensions simultaneously. Multiple violin plots are arranged by category on the x-axis and grouped by a secondary variable using color/hue, with swarm points revealing the underlying raw data. This visualization combines distribution shape visualization with complete data transparency, ideal for comparing how distributions differ across multiple factors.
// anyplot.ai
// violin-grouped-swarm: Grouped Violin Plot with Swarm Overlay
// Library: chartjs 4.4.7 | JavaScript 22.23.2
// Quality: 89/100 | Created: 2026-09-02

const t = window.ANYPLOT_TOKENS;

// --- Deterministic PRNG (LCG + Box-Muller) ----------------------------------
function makeLcg(seed) {
  let state = seed >>> 0;
  return () => {
    state = (state * 1664525 + 1013904223) >>> 0;
    return state / 4294967296;
  };
}
const rand = makeLcg(42);
function gaussian() {
  const u1 = Math.max(rand(), 1e-9);
  const u2 = rand();
  return Math.sqrt(-2 * Math.log(u1)) * Math.cos(2 * Math.PI * u2);
}

// --- Data: task completion time (minutes) by task type and developer role --
const categories = ["Debugging", "Feature Dev", "Code Review"];
const groups = ["Junior", "Senior"];
const meanStdByCell = {
  Debugging: { Junior: [42, 12], Senior: [25, 8] },
  "Feature Dev": { Junior: [65, 18], Senior: [40, 12] },
  "Code Review": { Junior: [20, 6], Senior: [12, 4] },
};
const nPerCell = 35;

// --- Layout: category centers on x, groups dodged around each center ------
const categoryUnit = 5;
const groupSpacing = 1.7;
const violinHalfWidth = 0.75;
const categoryCenters = categories.map((_, i) => i * categoryUnit);
const groupOffsets = groups.map((_, gi) => (gi - (groups.length - 1) / 2) * groupSpacing);
const xMin = categoryCenters[0] - categoryUnit / 2;
const xMax = categoryCenters[categoryCenters.length - 1] + categoryUnit / 2;

// Approximate beeswarm: bin each cell's values, spread points within a bin
// symmetrically around the violin center so overlapping points fan out.
function computeSwarmOffsets(values, halfWidth) {
  const n = values.length;
  const order = values.map((_, i) => i).sort((a, b) => values[a] - values[b]);
  const cellMin = values[order[0]];
  const cellMax = values[order[n - 1]];
  const range = Math.max(cellMax - cellMin, 1e-6);
  const nBins = Math.max(6, Math.min(16, Math.round(n / 3)));
  const binWidth = range / nBins;
  const bins = Array.from({ length: nBins }, () => []);
  order.forEach((origIdx) => {
    let b = Math.floor((values[origIdx] - cellMin) / binWidth);
    if (b >= nBins) b = nBins - 1;
    if (b < 0) b = 0;
    bins[b].push(origIdx);
  });
  const offsets = new Array(n).fill(0);
  bins.forEach((binIndices) => {
    const count = binIndices.length;
    if (count <= 1) return;
    const step = Math.min(halfWidth * 0.32, (halfWidth * 1.6) / count);
    binIndices.forEach((origIdx, k) => {
      const centered = k - (count - 1) / 2;
      const clamped = Math.max(-halfWidth * 0.92, Math.min(halfWidth * 0.92, centered * step));
      offsets[origIdx] = clamped;
    });
  });
  return offsets;
}

// --- Build one violin (KDE curve) + swarm points per category-group cell --
const cells = [];
const swarmPointsByGroup = groups.map(() => []);

categories.forEach((cat, ci) => {
  groups.forEach((grp, gi) => {
    const [mean, std] = meanStdByCell[cat][grp];
    const values = [];
    for (let k = 0; k < nPerCell; k += 1) {
      values.push(Math.max(1, mean + std * gaussian()));
    }

    const centerX = categoryCenters[ci] + groupOffsets[gi];
    const offsets = computeSwarmOffsets(values, violinHalfWidth);
    values.forEach((v, i) => swarmPointsByGroup[gi].push({ x: centerX + offsets[i], y: v }));

    const n = values.length;
    const cellMean = values.reduce((a, b) => a + b, 0) / n;
    const cellStd = Math.sqrt(values.reduce((a, b) => a + (b - cellMean) ** 2, 0) / n);
    const bandwidth = Math.max(1.06 * cellStd * n ** -0.2, 0.6);
    const cellMin = Math.min(...values);
    const cellMax = Math.max(...values);
    const lo = cellMin - bandwidth * 2;
    const hi = cellMax + bandwidth * 2;
    const samples = 50;
    const curve = [];
    for (let s = 0; s <= samples; s += 1) {
      const yv = lo + ((hi - lo) * s) / samples;
      let density = 0;
      for (const v of values) {
        const u = (yv - v) / bandwidth;
        density += Math.exp(-0.5 * u * u);
      }
      density /= n * bandwidth * Math.sqrt(2 * Math.PI);
      curve.push({ y: yv, density });
    }
    const maxDensity = Math.max(...curve.map((c) => c.density));
    curve.forEach((c) => {
      c.width = (c.density / maxDensity) * violinHalfWidth;
    });
    curve[0].width = 0;
    curve[curve.length - 1].width = 0;

    cells.push({ color: t.palette[gi], centerX, curve, cellLo: lo, cellHi: hi });
  });
});

const yMin = Math.max(0, Math.min(...cells.map((c) => c.cellLo)) - 2);
const yMax = Math.ceil((Math.max(...cells.map((c) => c.cellHi)) * 1.05) / 10) * 10;

function hexToRgba(hex, alpha) {
  const r = parseInt(hex.slice(1, 3), 16);
  const g = parseInt(hex.slice(3, 5), 16);
  const b = parseInt(hex.slice(5, 7), 16);
  return `rgba(${r}, ${g}, ${b}, ${alpha})`;
}

// --- Violin layer: drawn behind the swarm points via a native plugin hook --
const violinPlugin = {
  id: "violinLayer",
  beforeDatasetsDraw(chart) {
    const { ctx, scales } = chart;
    ctx.save();
    cells.forEach((cell) => {
      ctx.beginPath();
      cell.curve.forEach((pt, i) => {
        const px = scales.x.getPixelForValue(cell.centerX - pt.width);
        const py = scales.y.getPixelForValue(pt.y);
        if (i === 0) ctx.moveTo(px, py);
        else ctx.lineTo(px, py);
      });
      for (let i = cell.curve.length - 1; i >= 0; i -= 1) {
        const pt = cell.curve[i];
        const px = scales.x.getPixelForValue(cell.centerX + pt.width);
        const py = scales.y.getPixelForValue(pt.y);
        ctx.lineTo(px, py);
      }
      ctx.closePath();
      ctx.fillStyle = hexToRgba(cell.color, 0.32);
      ctx.fill();
      ctx.lineWidth = 2.5;
      ctx.strokeStyle = hexToRgba(cell.color, 0.95);
      ctx.stroke();
    });
    ctx.restore();
  },
};

// --- Mount -------------------------------------------------------------------
const canvas = document.createElement("canvas");
document.getElementById("container").appendChild(canvas);

// --- Title (scale fontsize down if the descriptive prefix pushes length up) -
// Gentle sqrt falloff (not linear) so a long mandated title still reads as
// prominent, floored well above illegibility.
const title = "Task Completion Time by Role · violin-grouped-swarm · javascript · chartjs · anyplot.ai";
const baseTitleSize = 22;
const titleFontSize =
  title.length > 67 ? Math.max(20, Math.round(baseTitleSize * Math.sqrt(67 / title.length))) : baseTitleSize;

// --- Insight callout: subtitle surfaces the clear cross-category pattern ---
const insight = "Senior engineers finish every task type faster and more consistently than juniors";

// --- Chart ---------------------------------------------------------------
new Chart(canvas, {
  type: "scatter",
  data: {
    datasets: groups.map((g, gi) => ({
      label: g,
      data: swarmPointsByGroup[gi],
      backgroundColor: t.palette[gi],
      borderColor: t.pageBg,
      borderWidth: 1,
      radius: 3.6,
      hoverRadius: 3.6,
    })),
  },
  options: {
    responsive: true,
    maintainAspectRatio: false,
    animation: false,
    plugins: {
      title: { display: true, text: title, color: t.ink, font: { size: titleFontSize, weight: "500" } },
      subtitle: {
        display: true,
        text: insight,
        color: t.inkSoft,
        font: { size: 14, style: "italic" },
        padding: { bottom: 12 },
      },
      legend: {
        position: "top",
        align: "end",
        labels: { color: t.ink, font: { size: 16 }, usePointStyle: true, pointStyle: "circle" },
      },
    },
    scales: {
      x: {
        type: "linear",
        min: xMin,
        max: xMax,
        afterBuildTicks: (scale) => {
          scale.ticks = categoryCenters.map((v) => ({ value: v }));
        },
        ticks: {
          color: t.inkSoft,
          font: { size: 14 },
          callback: (value) => {
            const idx = categoryCenters.findIndex((c) => Math.abs(c - value) < 0.01);
            return idx >= 0 ? categories[idx] : "";
          },
        },
        grid: { display: false },
        title: { display: true, text: "Task Type", color: t.ink, font: { size: 16 } },
      },
      y: {
        type: "linear",
        min: yMin,
        max: yMax,
        ticks: { color: t.inkSoft, font: { size: 14 } },
        grid: { color: t.grid },
        title: { display: true, text: "Completion Time (minutes)", color: t.ink, font: { size: 16 } },
      },
    },
  },
  plugins: [violinPlugin],
});
Runnable source as JSON, for any HTTP client: https://api.anyplot.ai/specs/violin-grouped-swarm/chartjs/code. Any spec id and library id listed in llms-full.txt fit the same URL shape; every URL below is complete and callable.
{
  "spec_id": "violin-grouped-swarm",
  "language": "javascript",
  "library": "chartjs",
  "page": "https://anyplot.ai/violin-grouped-swarm/javascript/chartjs",
  "hub": "https://anyplot.ai/violin-grouped-swarm",
  "code_json": "https://api.anyplot.ai/specs/violin-grouped-swarm/chartjs/code",
  "spec_json": "https://api.anyplot.ai/specs/violin-grouped-swarm",
  "render_light_png": "https://storage.googleapis.com/anyplot-images/plots/violin-grouped-swarm/javascript/chartjs/plot-light.png",
  "render_dark_png": "https://storage.googleapis.com/anyplot-images/plots/violin-grouped-swarm/javascript/chartjs/plot-dark.png",
  "interactive_light_html": "https://storage.googleapis.com/anyplot-images/plots/violin-grouped-swarm/javascript/chartjs/plot-light.html",
  "interactive_dark_html": "https://storage.googleapis.com/anyplot-images/plots/violin-grouped-swarm/javascript/chartjs/plot-dark.html",
  "quality_score": 89.0,
  "license": "MIT",
  "guide": "https://anyplot.ai/llms.txt"
}
Part of Grouped Violin Plot with Swarm Overlay on anyplot.ai.