The same plot in 14 other libraries — JavaScript: Chart.js, D3.js, Apache ECharts, MUI X Charts; Python: Altair, Bokeh, lets-plot, Matplotlib, Plotly, plotnine, Pygal, Seaborn; R: ggplot2; Julia: Makie.jl. Compare all 15 side by side: Grouped Violin Plot with Swarm Overlay in Python, R, Julia and JavaScript.
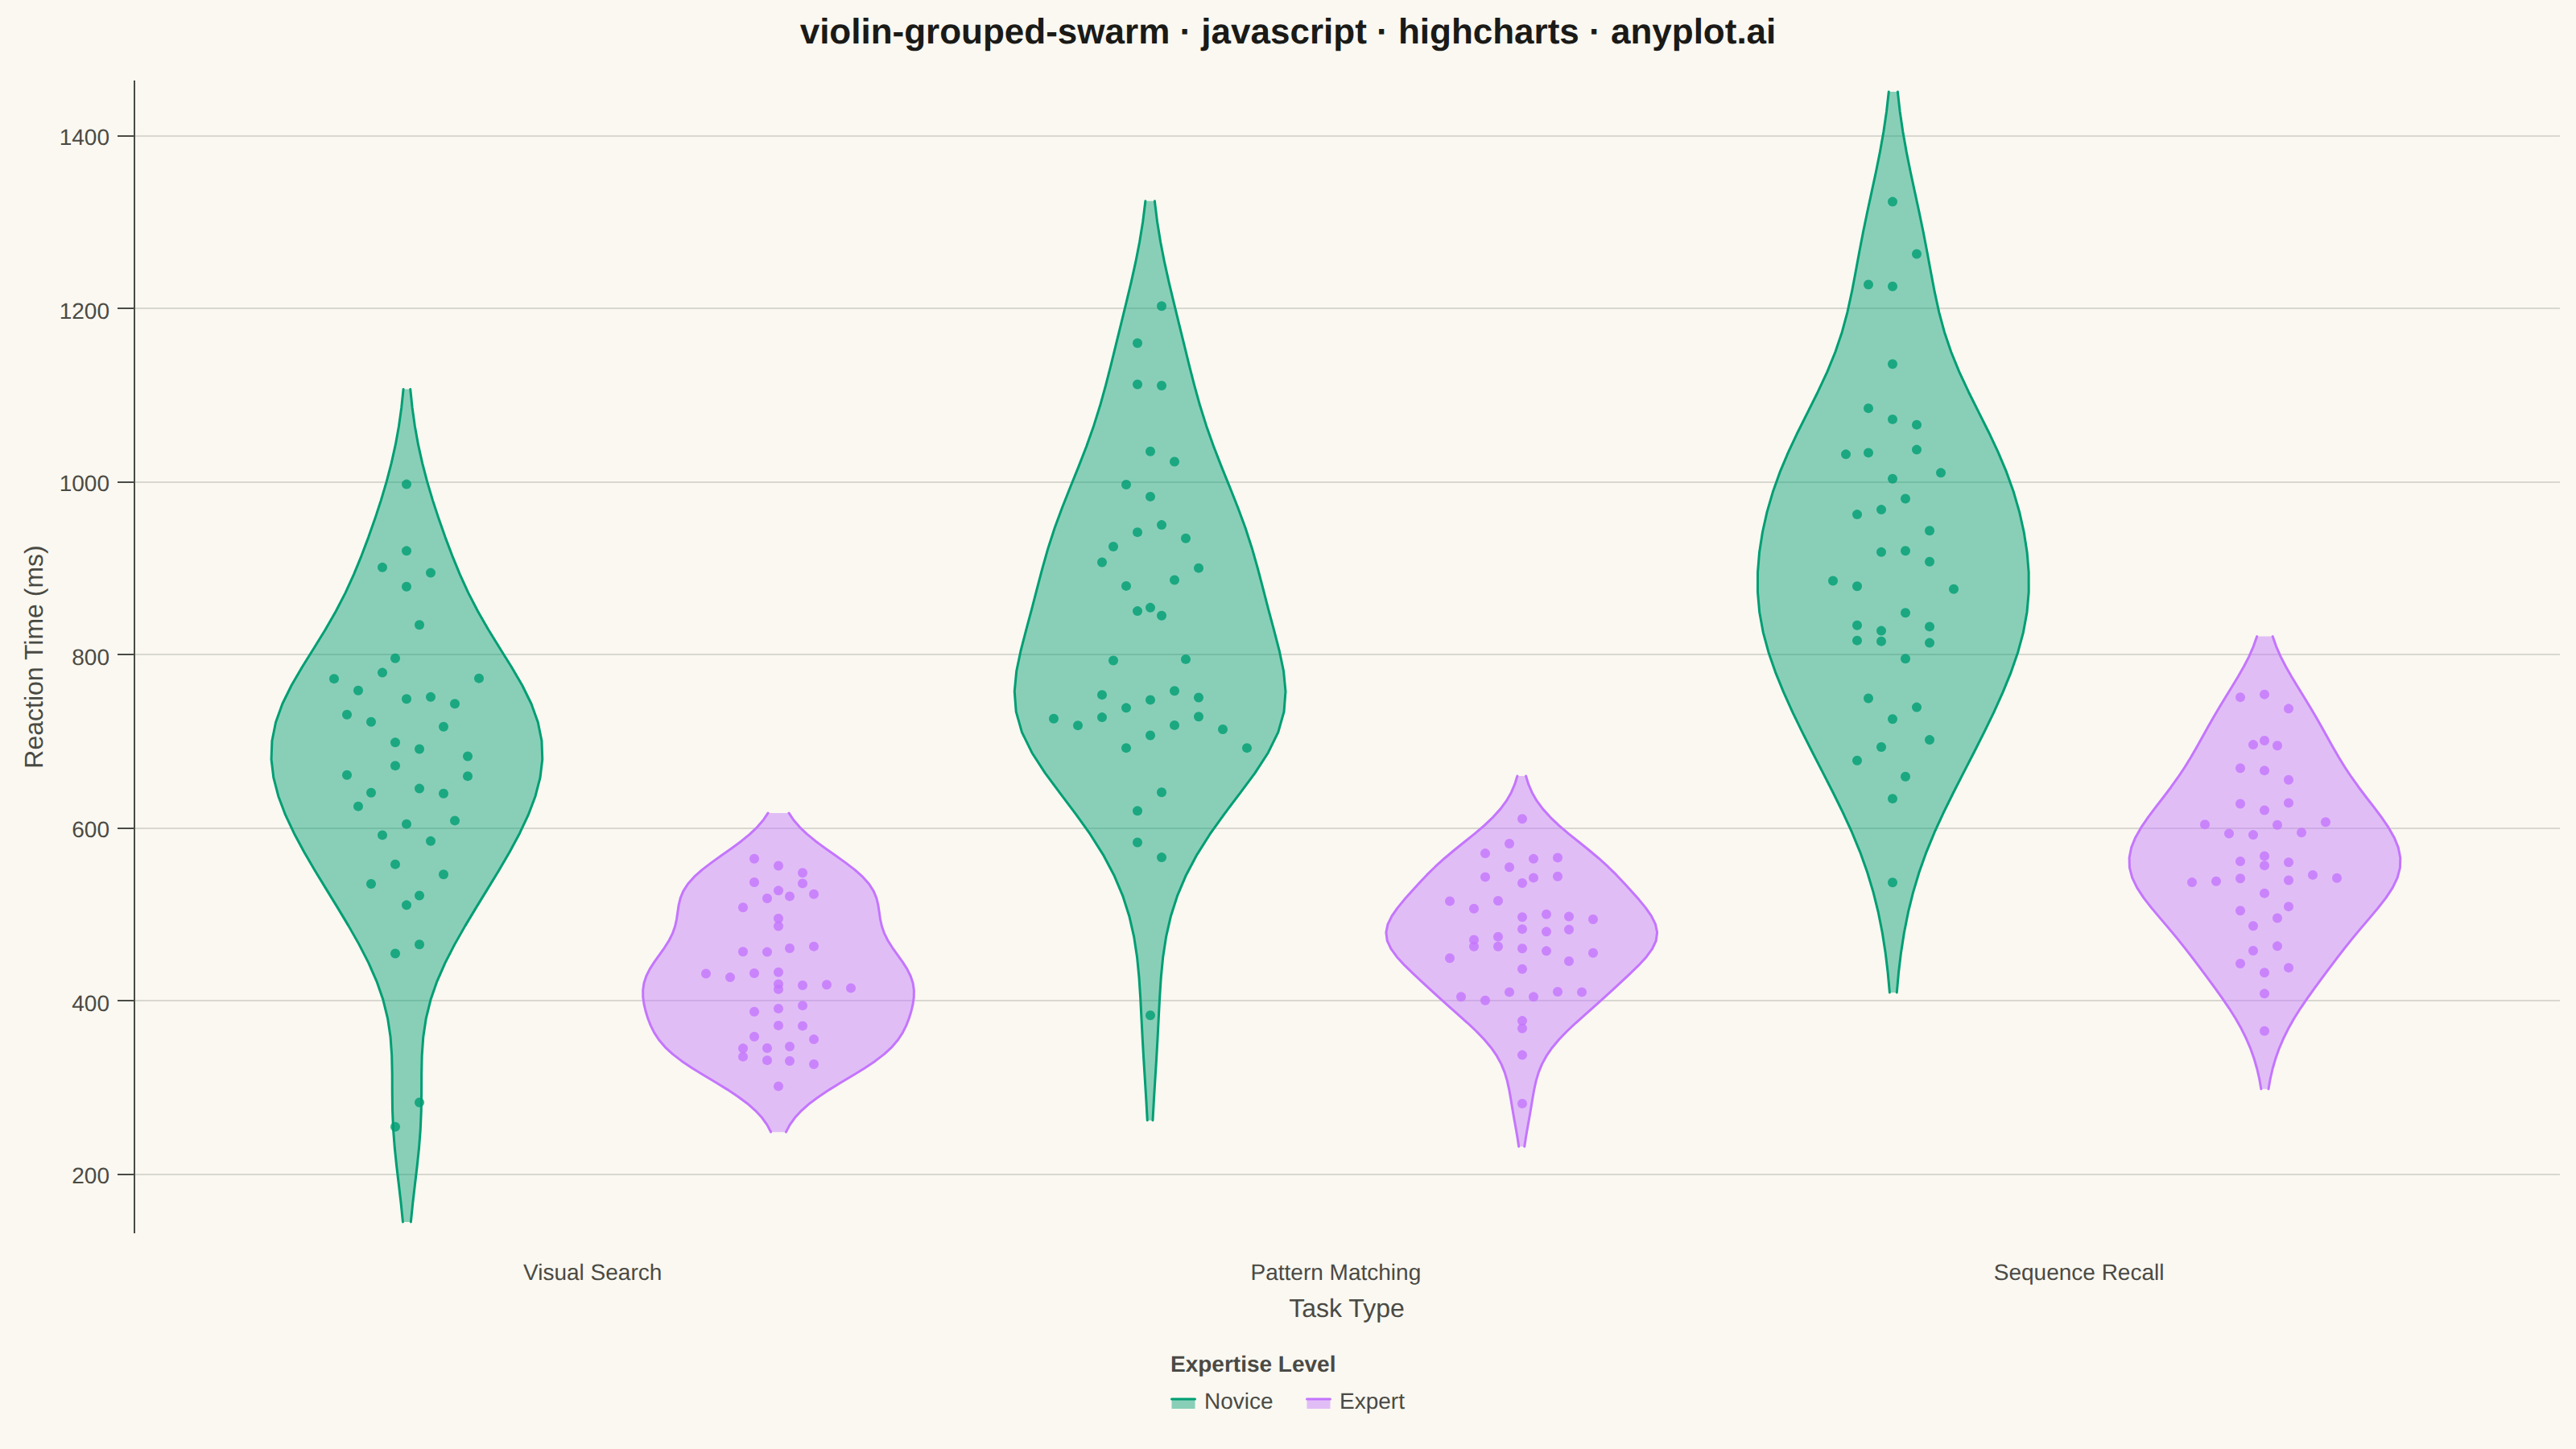
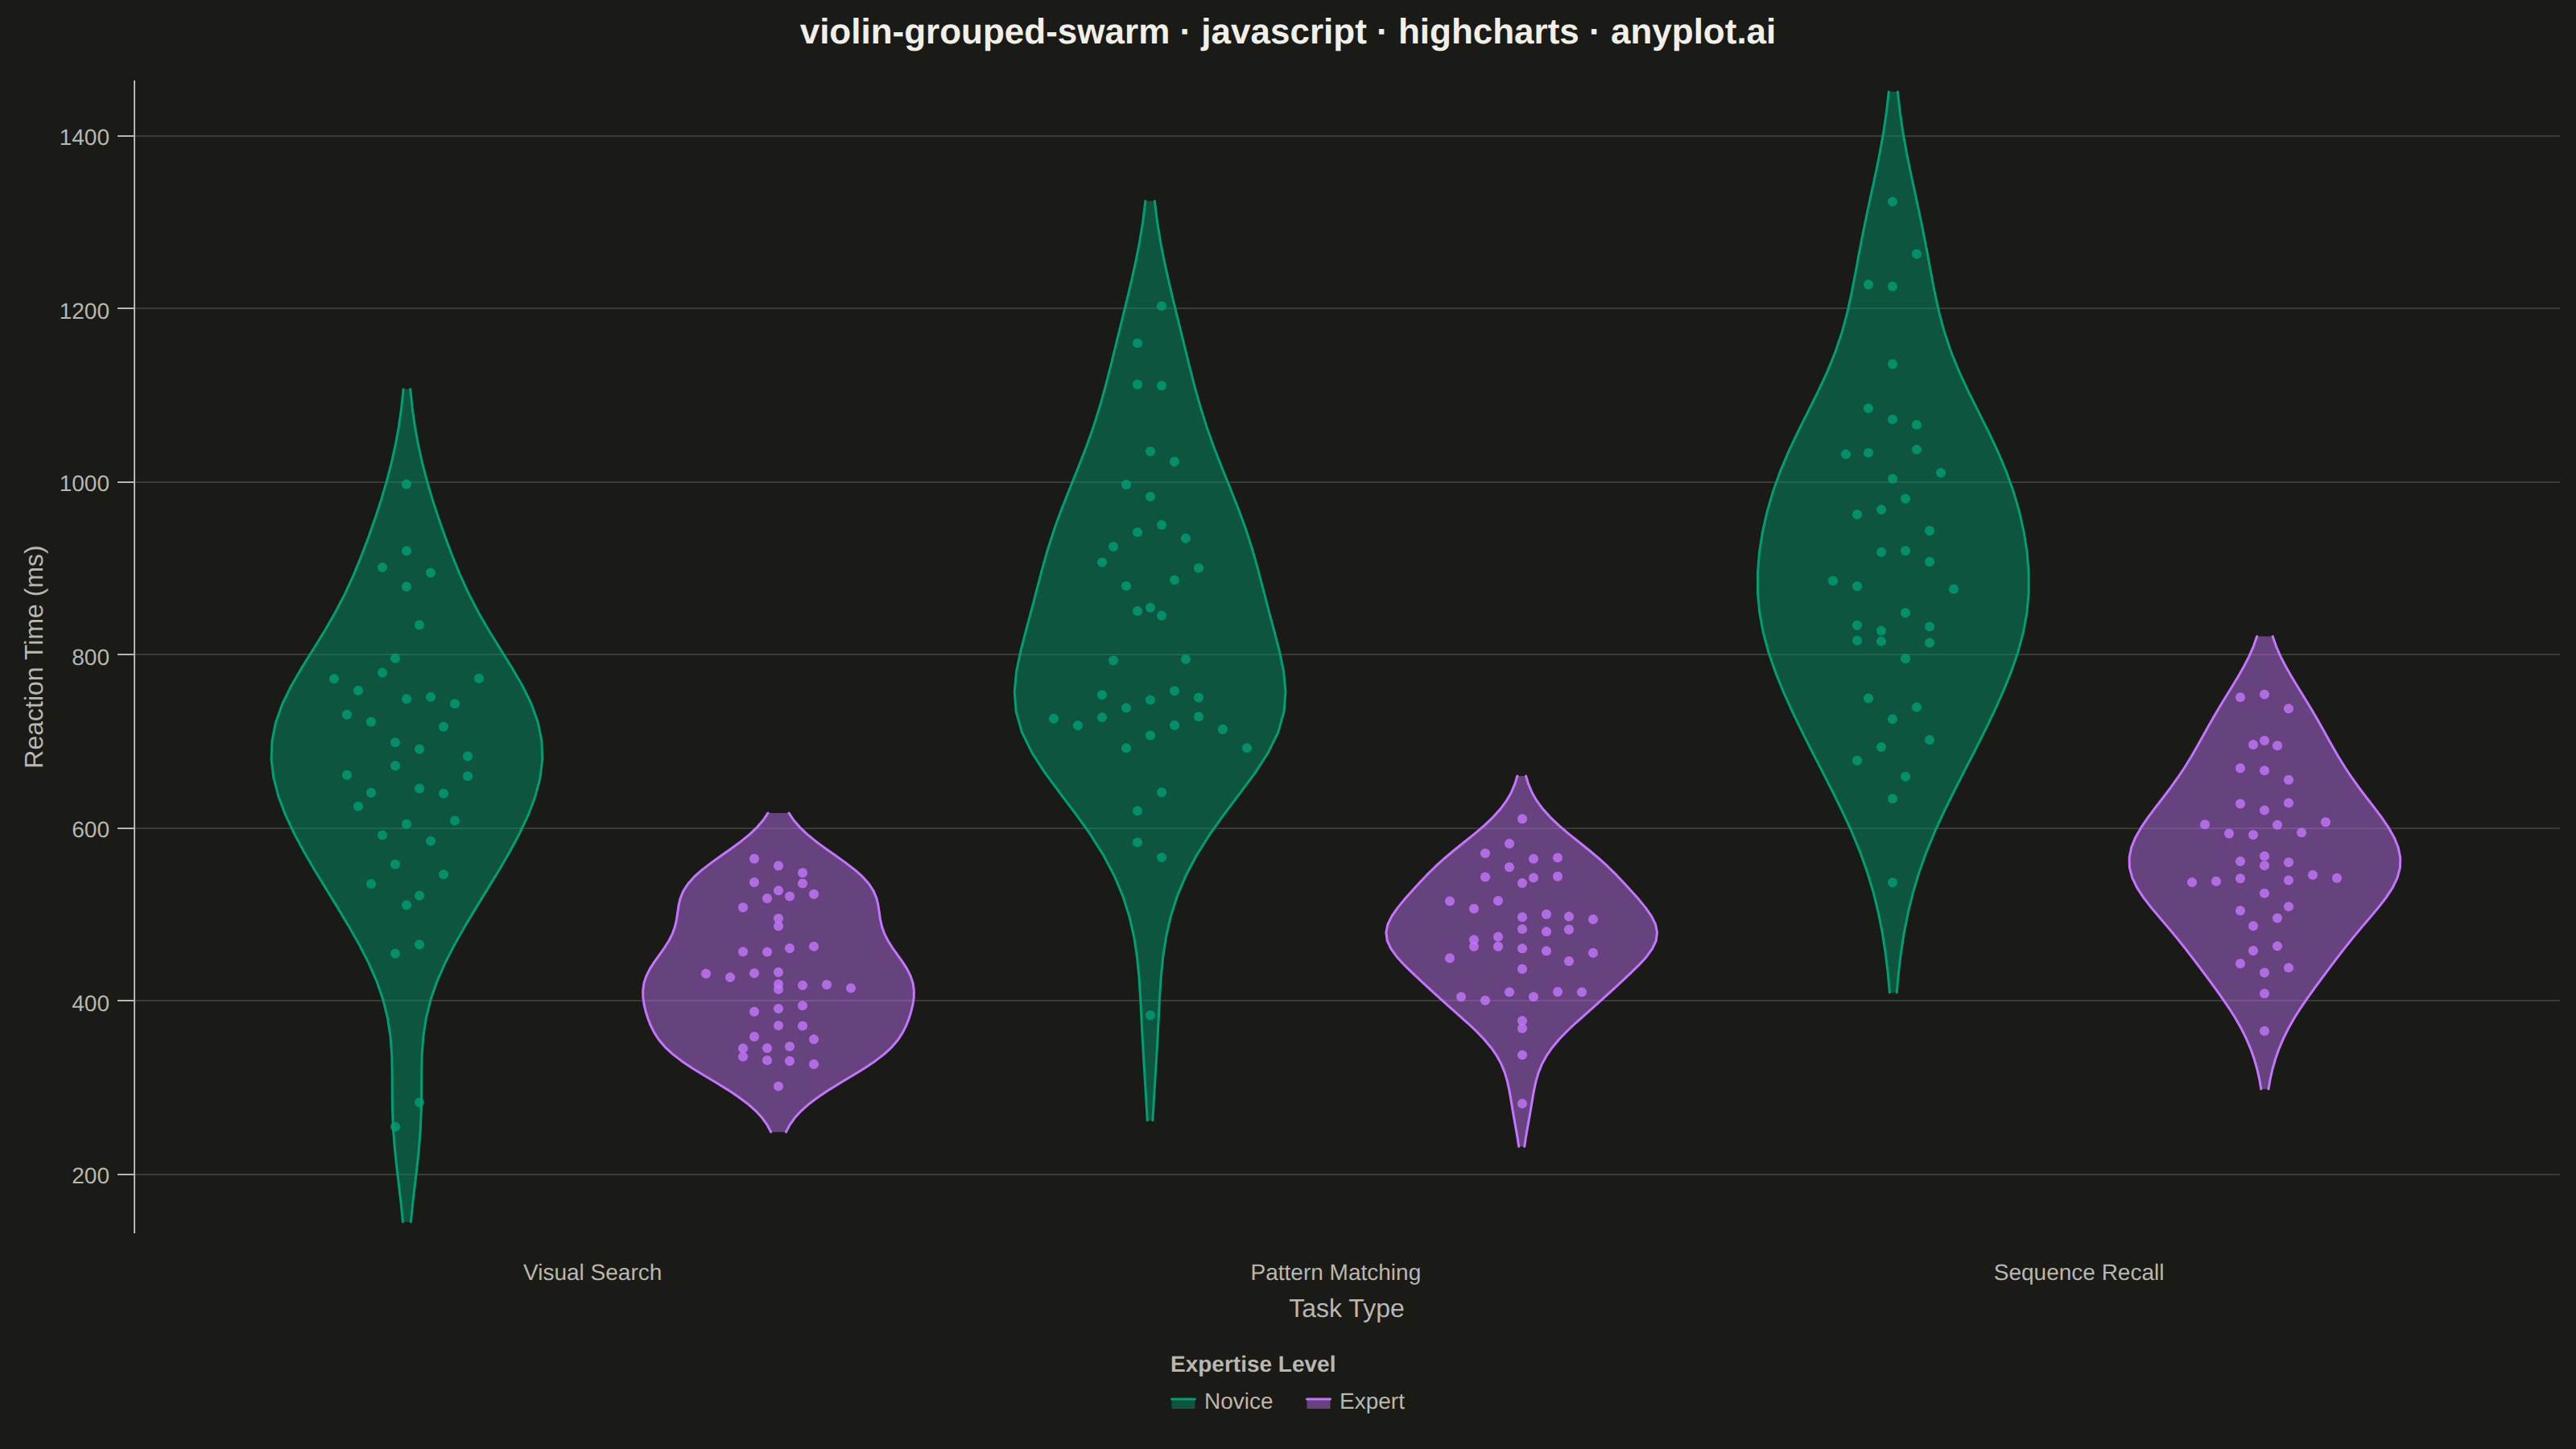
A grouped violin plot with individual data points overlaid as swarm points, showing distributions across two categorical dimensions simultaneously. Multiple violin plots are arranged by category on the x-axis and grouped by a secondary variable using color/hue, with swarm points revealing the underlying raw data. This visualization combines distribution shape visualization with complete data transparency, ideal for comparing how distributions differ across multiple factors.
// anyplot.ai
// violin-grouped-swarm: Grouped Violin Plot with Swarm Overlay
// Library: highcharts 12.6.0 | JavaScript 22.23.2
// Quality: 90/100 | Created: 2026-09-02

//# anyplot-orientation: landscape
const t = window.ANYPLOT_TOKENS;

// --- Data (in-memory, deterministic) ----------------------------------------
// Reaction-time trial: 3 cognitive tasks x 2 expertise levels, 40 trials each.
// Only the core `highcharts` bundle is loaded (no highcharts-more arearange /
// boxplot), so the violin silhouette is built from two mirrored `area` series
// per cell — each filled from its group's center line (`threshold`) out to a
// Gaussian KDE curve — with the whole chart inverted so the value axis (the
// series' x) renders vertically and the category/group axis (the series' y)
// renders horizontally.
const categories = ["Visual Search", "Pattern Matching", "Sequence Recall"];
const groups = ["Novice", "Expert"];
const difficultyFactor = [1, 1.18, 1.35];
const categorySpacing = 3.4;
const groupOffset = 0.85;
const maxViolinHalfWidth = 0.62;
const maxSwarmHalfWidth = 0.55;
const trialsPerCell = 40;
const kdeGridSize = 46;

let seed = 42;
function lcg() {
  seed = (seed * 1103515245 + 12345) & 0x7fffffff;
  return seed / 0x7fffffff;
}
function randNormal(mean, std) {
  const u1 = Math.max(lcg(), 1e-9);
  const u2 = lcg();
  const z = Math.sqrt(-2 * Math.log(u1)) * Math.cos(2 * Math.PI * u2);
  return mean + z * std;
}

const categoryCenters = categories.map((_, i) => i * categorySpacing);
const centerToCategory = {};
categoryCenters.forEach((center, i) => {
  centerToCategory[center] = categories[i];
});

const cells = [];
categories.forEach((category, ci) => {
  groups.forEach((group, gi) => {
    const factor = difficultyFactor[ci];
    const mean = group === "Novice" ? 680 * factor : 410 * factor;
    const std = group === "Novice" ? 140 * factor : 75 * factor;
    const values = Array.from({ length: trialsPerCell }, () =>
      randNormal(mean, std),
    );
    const center =
      categoryCenters[ci] + (gi === 0 ? -groupOffset : groupOffset);
    cells.push({ category, group, ci, values, center });
  });
});

// --- Kernel density estimate (Gaussian, Silverman bandwidth) ---------------
function kde(values, gridSize) {
  const n = values.length;
  const mean = values.reduce((a, b) => a + b, 0) / n;
  const variance = values.reduce((a, b) => a + (b - mean) ** 2, 0) / n;
  const std = Math.sqrt(variance);
  const bandwidth = 1.06 * std * Math.pow(n, -0.2);
  const min = Math.min(...values) - 1.4 * bandwidth;
  const max = Math.max(...values) + 1.4 * bandwidth;
  const grid = Array.from(
    { length: gridSize },
    (_, i) => min + ((max - min) * i) / (gridSize - 1),
  );
  const rawDensity = grid.map((v) =>
    values.reduce(
      (acc, xi) => acc + Math.exp(-0.5 * ((v - xi) / bandwidth) ** 2),
      0,
    ),
  );
  const peak = Math.max(...rawDensity);
  return { grid, density: rawDensity.map((d) => d / peak) };
}

// --- Beeswarm-style dodge: spread same-bin trials sideways -----------------
function beeswarmOffsets(values, maxHalfWidth, binCount) {
  const min = Math.min(...values);
  const max = Math.max(...values);
  const binWidth = (max - min) / binCount || 1;
  const bins = Array.from({ length: binCount }, () => []);
  values.forEach((v, i) => {
    const b = Math.min(binCount - 1, Math.floor((v - min) / binWidth));
    bins[b].push(i);
  });
  const offsets = new Array(values.length).fill(0);
  bins.forEach((idxs) => {
    const n = idxs.length;
    if (n <= 1) return;
    const spacing = Math.min(0.11, (2 * maxHalfWidth) / n);
    idxs.forEach((i, k) => {
      offsets[i] = (k - (n - 1) / 2) * spacing;
    });
  });
  return offsets;
}

// --- Build series ------------------------------------------------------------
const groupColors = { Novice: t.palette[0], Expert: t.palette[1] };
const series = [];

cells.forEach(({ category, group, ci, values, center }) => {
  const { grid, density } = kde(values, kdeGridSize);
  const color = groupColors[group];
  const rightEdge = grid.map((v, i) => [
    v,
    center + density[i] * maxViolinHalfWidth,
  ]);
  const leftEdge = grid.map((v, i) => [
    v,
    center - density[i] * maxViolinHalfWidth,
  ]);

  series.push({
    type: "area",
    name: group,
    data: rightEdge,
    threshold: center,
    color,
    fillOpacity: 0.45,
    lineWidth: 1.5,
    lineColor: color,
    marker: { enabled: false },
    enableMouseTracking: false,
    showInLegend: ci === 0,
  });
  series.push({
    type: "area",
    name: group,
    data: leftEdge,
    threshold: center,
    color,
    fillOpacity: 0.45,
    lineWidth: 1.5,
    lineColor: color,
    marker: { enabled: false },
    enableMouseTracking: false,
    showInLegend: false,
  });

  const offsets = beeswarmOffsets(values, maxSwarmHalfWidth, 14);
  series.push({
    type: "scatter",
    name: `${category} · ${group} trials`,
    data: values.map((v, i) => [v, center + offsets[i]]),
    marker: {
      symbol: "circle",
      radius: 3,
      fillColor: Highcharts.color(color).setOpacity(0.8).get(),
      lineWidth: 0,
    },
    showInLegend: false,
    tooltip: {
      pointFormat: `${category} · ${group}<br/>Reaction time: {point.x:.0f} ms`,
    },
  });
});

// --- Chart -------------------------------------------------------------------
const title = "violin-grouped-swarm · javascript · highcharts · anyplot.ai";

Highcharts.chart("container", {
  chart: {
    inverted: true,
    backgroundColor: "transparent",
    animation: false,
    style: { fontFamily: "inherit" },
  },
  credits: { enabled: false },
  title: {
    text: title,
    style: { color: t.ink, fontSize: "22px", fontWeight: "600" },
  },
  xAxis: {
    reversed: false,
    title: {
      text: "Reaction Time (ms)",
      style: { color: t.inkSoft, fontSize: "16px" },
    },
    gridLineColor: t.grid,
    gridLineWidth: 1,
    lineColor: t.inkSoft,
    tickColor: t.inkSoft,
    labels: { style: { color: t.inkSoft, fontSize: "14px" } },
  },
  yAxis: {
    title: { text: "Task Type", style: { color: t.inkSoft, fontSize: "16px" } },
    min: -2.1,
    max: categoryCenters[categoryCenters.length - 1] + 2.2,
    startOnTick: false,
    endOnTick: false,
    tickPositions: categoryCenters,
    gridLineWidth: 0,
    lineColor: t.inkSoft,
    tickColor: t.inkSoft,
    labels: {
      style: { color: t.inkSoft, fontSize: "14px" },
      formatter() {
        return centerToCategory[this.value] || "";
      },
    },
  },
  legend: {
    title: {
      text: "Expertise Level",
      style: { color: t.inkSoft, fontSize: "14px" },
    },
    itemStyle: { color: t.inkSoft, fontSize: "14px" },
    itemHoverStyle: { color: t.ink },
    symbolRadius: 2,
  },
  tooltip: { backgroundColor: t.elevatedBg, style: { color: t.ink } },
  plotOptions: { series: { animation: false } },
  series,
});
Runnable source as JSON, for any HTTP client: https://api.anyplot.ai/specs/violin-grouped-swarm/highcharts/code. Any spec id and library id listed in llms-full.txt fit the same URL shape; every URL below is complete and callable.
{
  "spec_id": "violin-grouped-swarm",
  "language": "javascript",
  "library": "highcharts",
  "page": "https://anyplot.ai/violin-grouped-swarm/javascript/highcharts",
  "hub": "https://anyplot.ai/violin-grouped-swarm",
  "code_json": "https://api.anyplot.ai/specs/violin-grouped-swarm/highcharts/code",
  "spec_json": "https://api.anyplot.ai/specs/violin-grouped-swarm",
  "render_light_png": "https://storage.googleapis.com/anyplot-images/plots/violin-grouped-swarm/javascript/highcharts/plot-light.png",
  "render_dark_png": "https://storage.googleapis.com/anyplot-images/plots/violin-grouped-swarm/javascript/highcharts/plot-dark.png",
  "interactive_light_html": "https://storage.googleapis.com/anyplot-images/plots/violin-grouped-swarm/javascript/highcharts/plot-light.html",
  "interactive_dark_html": "https://storage.googleapis.com/anyplot-images/plots/violin-grouped-swarm/javascript/highcharts/plot-dark.html",
  "quality_score": 90.0,
  "license": "MIT",
  "guide": "https://anyplot.ai/llms.txt"
}
Part of Grouped Violin Plot with Swarm Overlay on anyplot.ai.