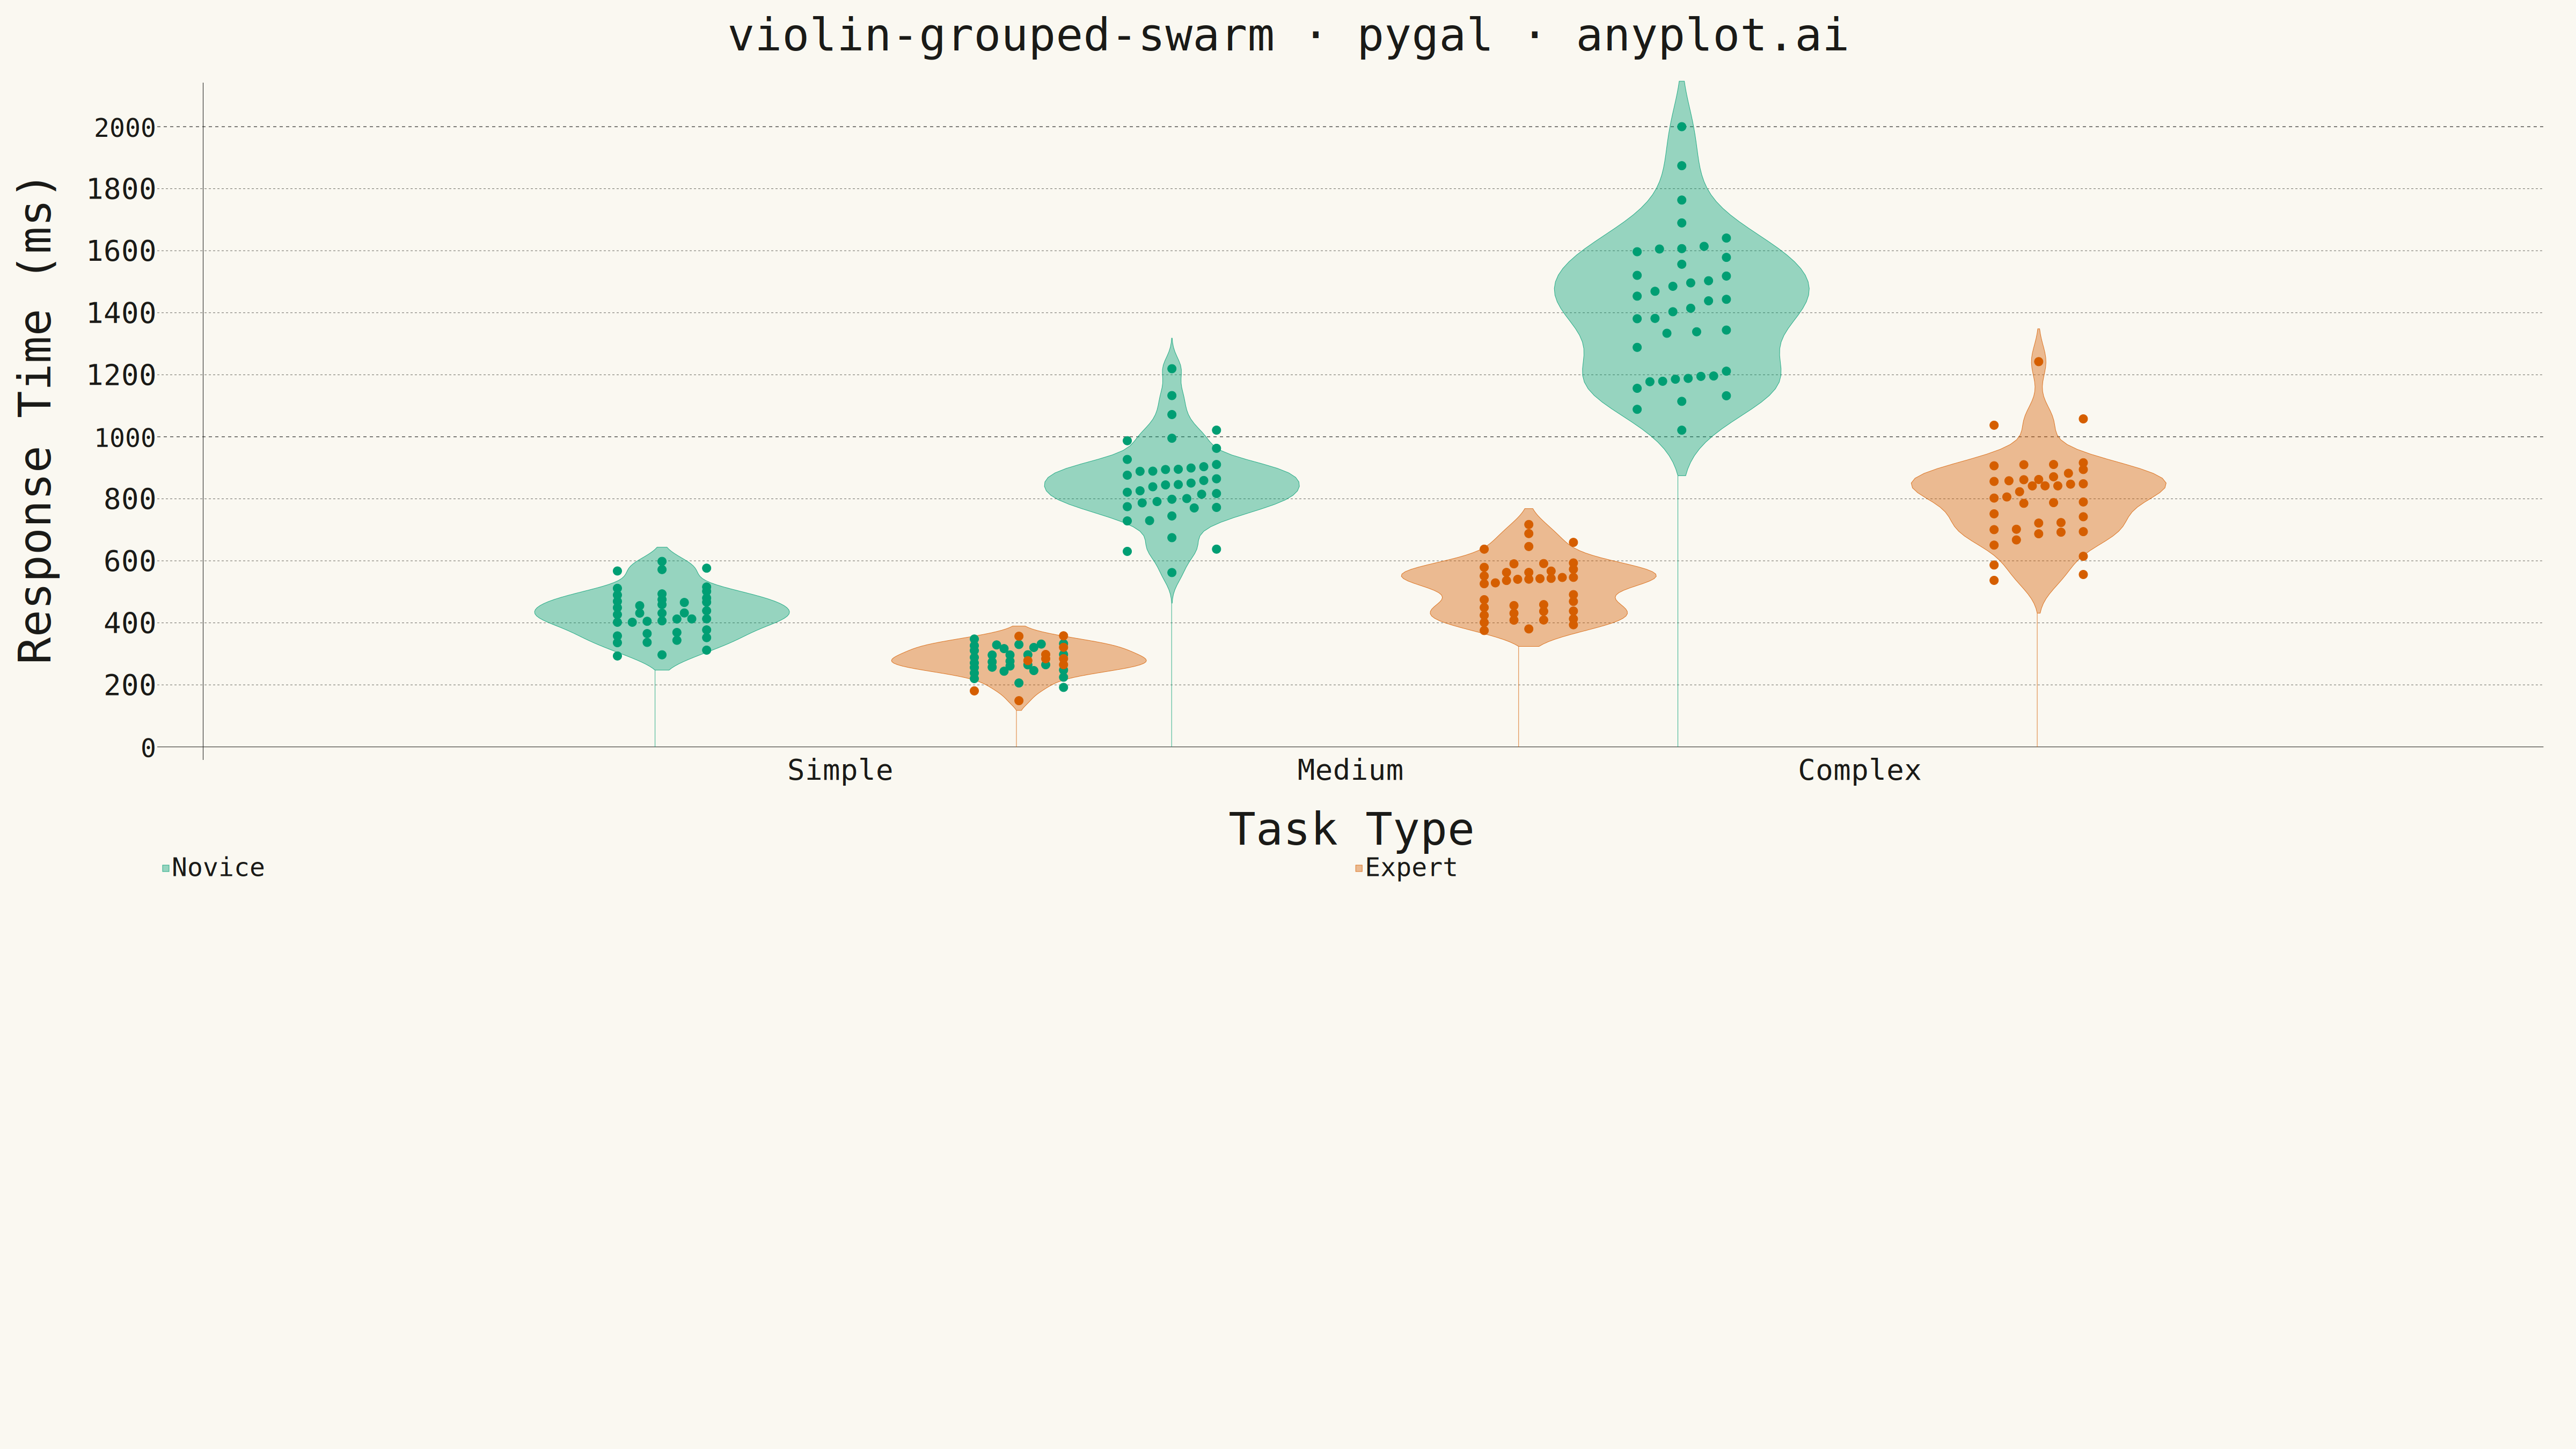
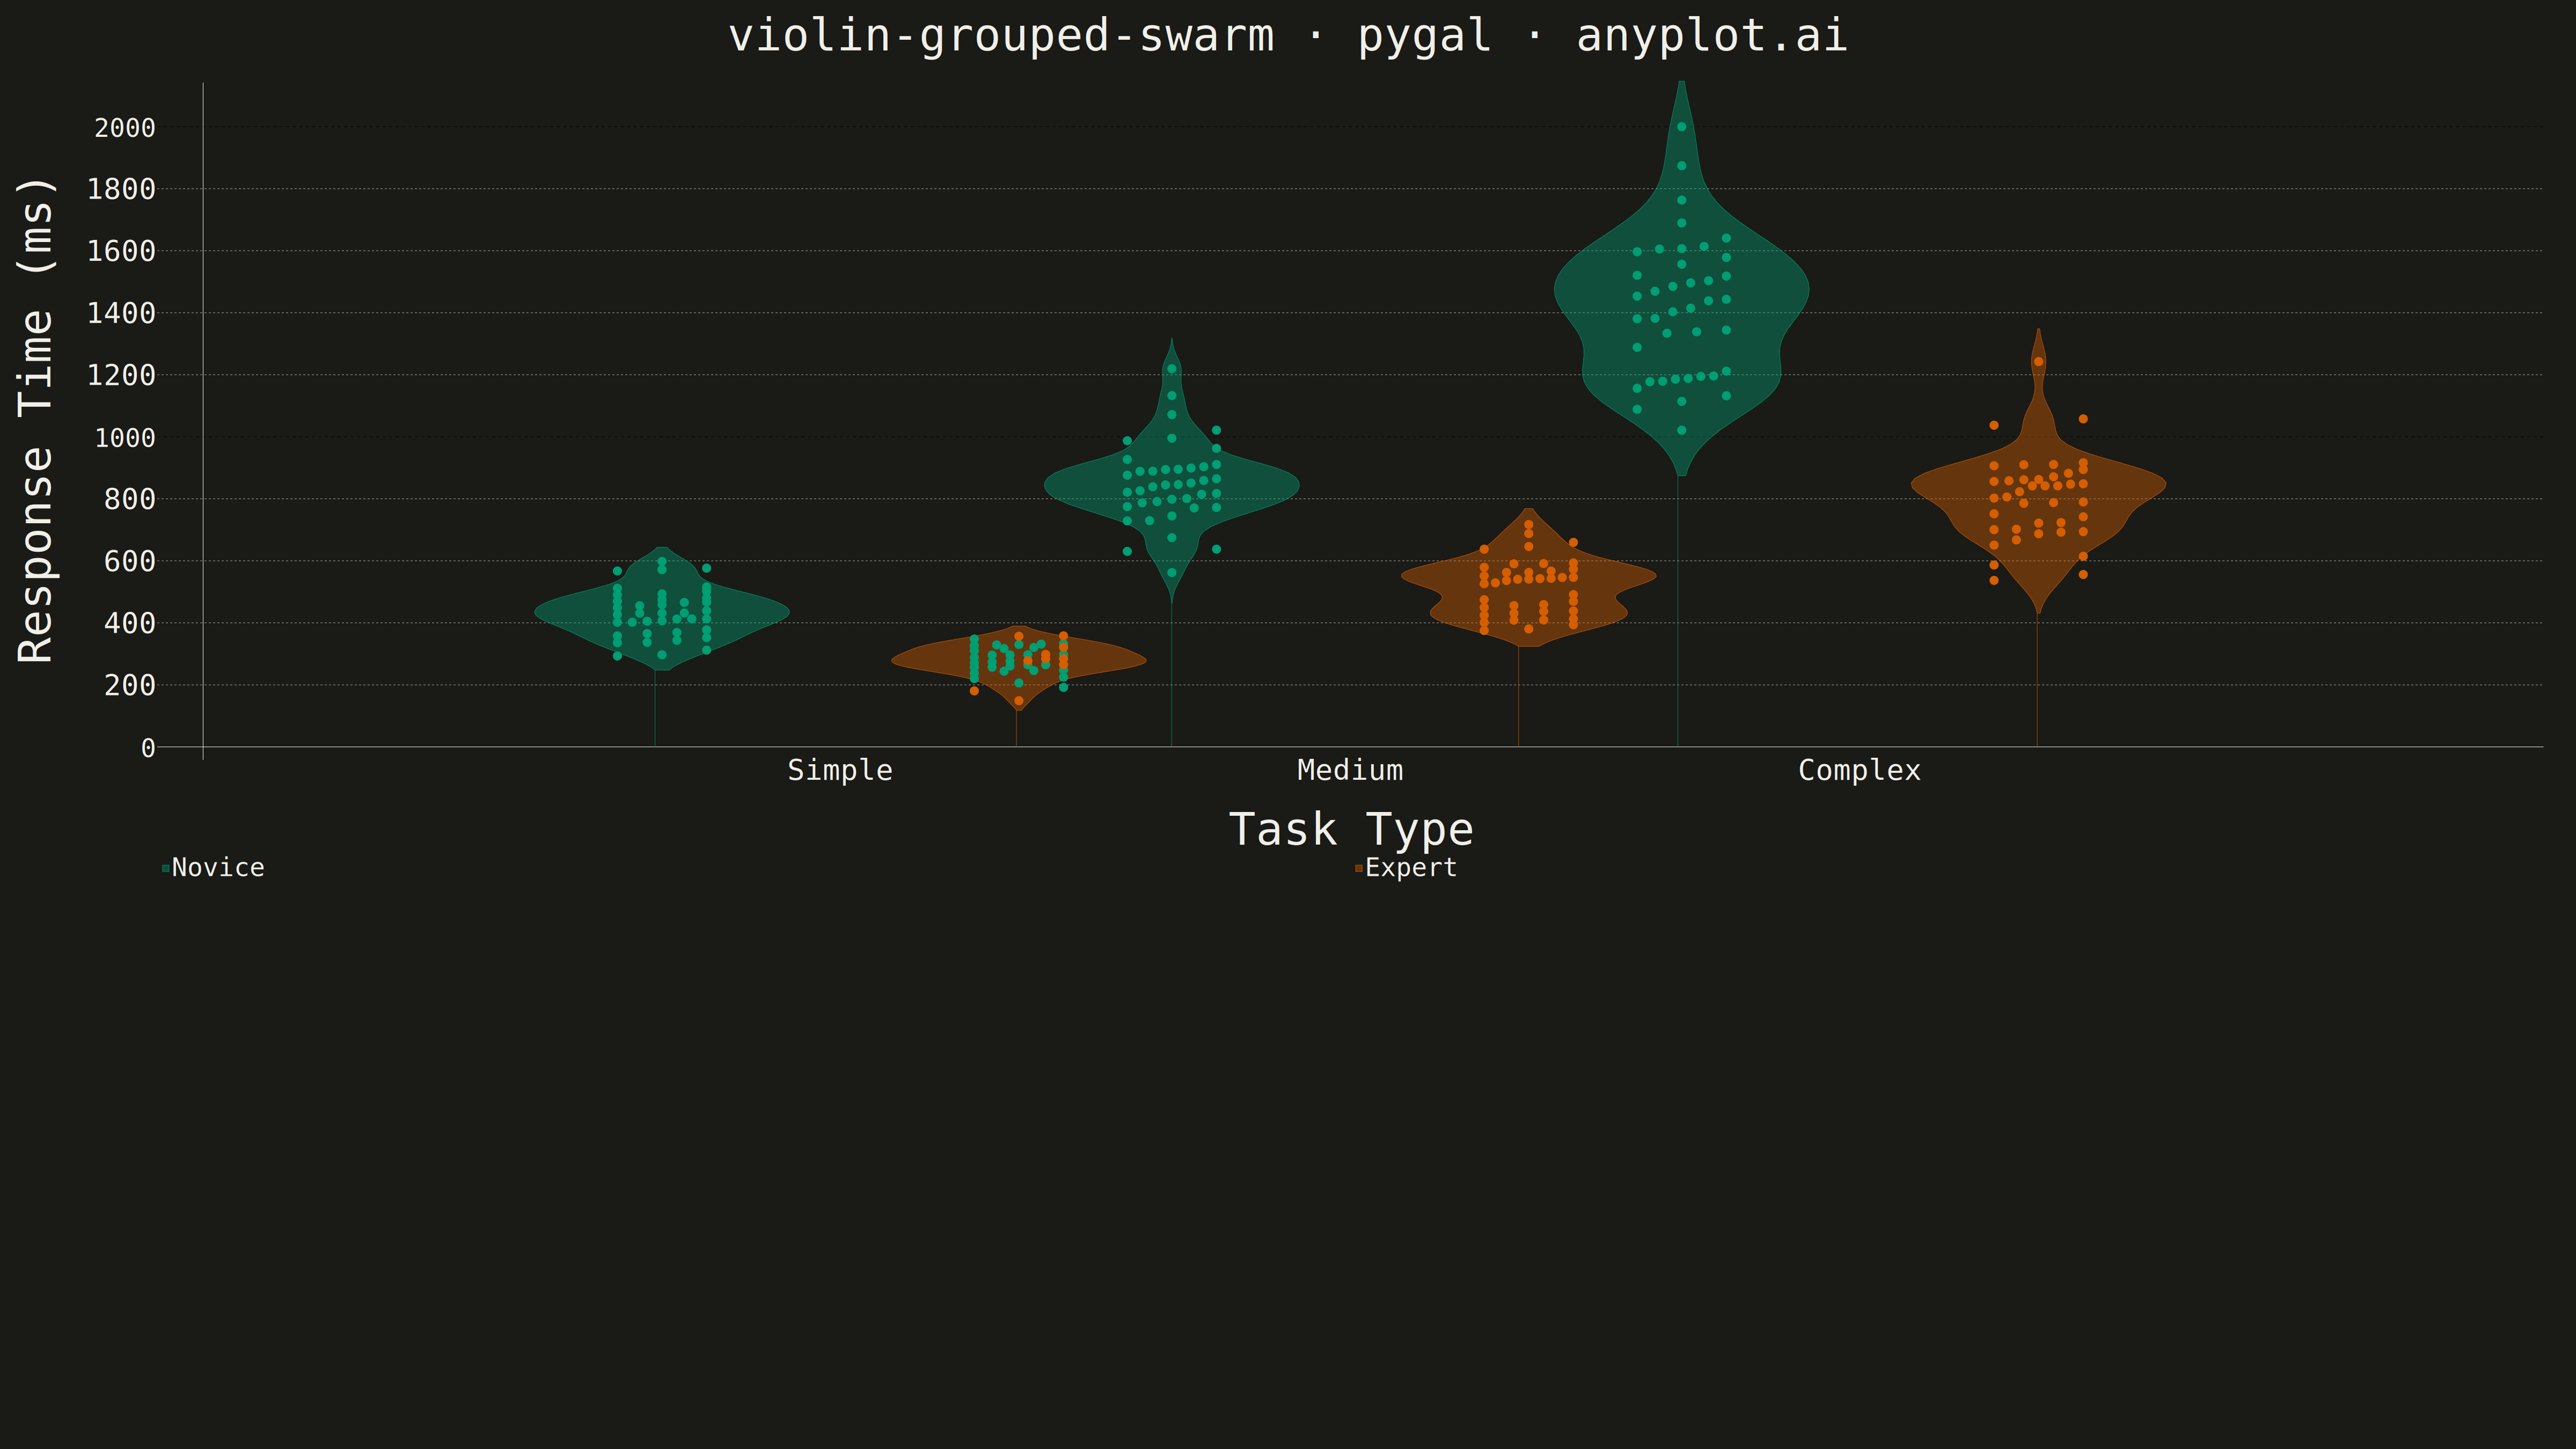
A grouped violin plot with individual data points overlaid as swarm points, showing distributions across two categorical dimensions simultaneously. Multiple violin plots are arranged by category on the x-axis and grouped by a secondary variable using color/hue, with swarm points revealing the underlying raw data. This visualization combines distribution shape visualization with complete data transparency, ideal for comparing how distributions differ across multiple factors.
""" anyplot.ai
violin-grouped-swarm: Grouped Violin Plot with Swarm Overlay
Library: pygal 3.1.0 | Python 3.13.13
Quality: 80/100 | Updated: 2026-05-18
"""

import numpy as np
import pygal
from pygal.style import Style


# Data - Response times across task types and expertise levels
np.random.seed(42)
categories = ["Simple", "Medium", "Complex"]
groups = ["Novice", "Expert"]

# Generate realistic response time data (in milliseconds)
data = {}
for cat in categories:
    data[cat] = {}
    if cat == "Simple":
        data[cat]["Novice"] = np.random.normal(450, 80, 40)
        data[cat]["Expert"] = np.random.normal(280, 50, 40)
    elif cat == "Medium":
        data[cat]["Novice"] = np.random.normal(850, 150, 40)
        data[cat]["Expert"] = np.random.normal(520, 90, 40)
    else:  # Complex
        data[cat]["Novice"] = np.random.normal(1400, 250, 40)
        data[cat]["Expert"] = np.random.normal(780, 120, 40)

# Clip to realistic range
for cat in categories:
    for group in groups:
        data[cat][group] = np.clip(data[cat][group], 100, 2000)

# Colors for groups
novice_color = "#306998"  # Python Blue
expert_color = "#FFD43B"  # Python Yellow
swarm_novice = "#1a4d75"  # Darker blue for swarm
swarm_expert = "#c9a82c"  # Darker yellow for swarm

# Custom style for 4800x2700 px canvas
# Color order: 3 novice violins, 3 expert violins, 12 novice swarm chunks, 12 expert swarm chunks
custom_style = Style(
    background="white",
    plot_background="white",
    foreground="#333333",
    foreground_strong="#333333",
    foreground_subtle="#666666",
    guide_stroke_color="#e0e0e0",
    colors=(novice_color,) * 3 + (expert_color,) * 3 + (swarm_novice,) * 15 + (swarm_expert,) * 15,
    title_font_size=84,
    label_font_size=54,
    major_label_font_size=48,
    legend_font_size=48,
    value_font_size=36,
    opacity=0.4,  # Semi-transparent violins so swarm points show through
    opacity_hover=0.6,
)

# Create XY chart for grouped violin plot with swarm
chart = pygal.XY(
    width=4800,
    height=2700,
    style=custom_style,
    title="violin-grouped-swarm · pygal · pyplots.ai",
    x_title="Task Type",
    y_title="Response Time (ms)",
    show_legend=True,
    legend_at_bottom=True,
    legend_at_bottom_columns=2,
    stroke=True,
    fill=True,
    dots_size=0,
    show_x_guides=False,
    show_y_guides=True,
    range=(0, 2100),
    xrange=(0, 4.5),
    margin=60,
)

# Parameters for violin shapes
violin_width = 0.25
n_points = 60
group_offset = 0.35  # Offset between grouped violins


# KDE helper function
def compute_kde(values, y_range):
    """Compute Gaussian KDE using Silverman's rule."""
    n = len(values)
    std = np.std(values)
    iqr = np.percentile(values, 75) - np.percentile(values, 25)
    bandwidth = 0.9 * min(std, iqr / 1.34) * n ** (-0.2)

    density = np.zeros_like(y_range)
    for v in values:
        density += np.exp(-0.5 * ((y_range - v) / bandwidth) ** 2)
    density /= n * bandwidth * np.sqrt(2 * np.pi)
    return density


# Swarm layout helper - arranges points to avoid overlap
def compute_swarm_positions(values, center_x, width=0.15):
    """Compute swarm positions to minimize overlap."""
    sorted_indices = np.argsort(values)
    positions = np.zeros(len(values))

    # Bin values and offset within bins
    y_sorted = values[sorted_indices]
    y_range = y_sorted.max() - y_sorted.min()
    bin_height = y_range / 15 if y_range > 0 else 1

    current_bin = []
    current_bin_y = y_sorted[0] if len(y_sorted) > 0 else 0

    for idx, y in enumerate(y_sorted):
        if y - current_bin_y > bin_height:
            # Process current bin - spread points horizontally
            n_in_bin = len(current_bin)
            if n_in_bin > 0:
                offsets = np.linspace(-width / 2, width / 2, n_in_bin) if n_in_bin > 1 else [0]
                for i, bin_idx in enumerate(current_bin):
                    positions[bin_idx] = center_x + offsets[i]
            current_bin = [sorted_indices[idx]]
            current_bin_y = y
        else:
            current_bin.append(sorted_indices[idx])

    # Process last bin
    n_in_bin = len(current_bin)
    if n_in_bin > 0:
        offsets = np.linspace(-width / 2, width / 2, n_in_bin) if n_in_bin > 1 else [0]
        for i, bin_idx in enumerate(current_bin):
            positions[bin_idx] = center_x + offsets[i]

    return positions


# Pre-compute all shapes
novice_violins = []
expert_violins = []
novice_swarms = []
expert_swarms = []

for i, category in enumerate(categories):
    base_x = i + 1.25

    for group in groups:
        values = data[category][group]
        offset = -group_offset if group == "Novice" else group_offset
        center_x = base_x + offset

        # Create range of y values for density
        y_min, y_max = values.min(), values.max()
        padding = (y_max - y_min) * 0.15
        y_range = np.linspace(y_min - padding, y_max + padding, n_points)

        # Compute KDE
        density = compute_kde(values, y_range)

        # Normalize density to desired width
        density = density / density.max() * violin_width

        # Create full violin shape (mirrored)
        left_points = [(center_x - d, y) for y, d in zip(y_range, density, strict=True)]
        right_points = [(center_x + d, y) for y, d in zip(y_range[::-1], density[::-1], strict=True)]
        violin_points = left_points + right_points + [left_points[0]]

        # Compute swarm positions
        swarm_x = compute_swarm_positions(values, center_x, width=violin_width * 0.7)
        swarm_points = list(zip(swarm_x, values, strict=True))

        if group == "Novice":
            novice_violins.append(violin_points)
            novice_swarms.extend(swarm_points)
        else:
            expert_violins.append(violin_points)
            expert_swarms.extend(swarm_points)

# Add violins with legend entries for first of each group
for i, violin in enumerate(novice_violins):
    label = "Novice" if i == 0 else None
    chart.add(label, violin, show_dots=False)

for i, violin in enumerate(expert_violins):
    label = "Expert" if i == 0 else None
    chart.add(label, violin, show_dots=False)

# Add swarm points as individual series with dots
# Group swarm points into chunks to reduce number of series
chunk_size = 10
novice_chunks = [novice_swarms[i : i + chunk_size] for i in range(0, len(novice_swarms), chunk_size)]
expert_chunks = [expert_swarms[i : i + chunk_size] for i in range(0, len(expert_swarms), chunk_size)]

for chunk in novice_chunks:
    chart.add(None, chunk, stroke=False, fill=False, show_dots=True, dots_size=8)

for chunk in expert_chunks:
    chart.add(None, chunk, stroke=False, fill=False, show_dots=True, dots_size=8)

# X-axis labels for categories
chart.x_labels = [
    {"value": 0, "label": ""},
    {"value": 1.25, "label": "Simple"},
    {"value": 2.25, "label": "Medium"},
    {"value": 3.25, "label": "Complex"},
    {"value": 4.5, "label": ""},
]

# Save outputs
chart.render_to_file("plot.html")
chart.render_to_png("plot.png")
Runnable source as JSON, for any HTTP client: https://api.anyplot.ai/specs/violin-grouped-swarm/pygal/code. Any spec id and library id listed in llms-full.txt fit the same URL shape; every URL below is complete and callable.
{
  "spec_id": "violin-grouped-swarm",
  "language": "python",
  "library": "pygal",
  "page": "https://anyplot.ai/violin-grouped-swarm/python/pygal",
  "hub": "https://anyplot.ai/violin-grouped-swarm",
  "code_json": "https://api.anyplot.ai/specs/violin-grouped-swarm/pygal/code",
  "spec_json": "https://api.anyplot.ai/specs/violin-grouped-swarm",
  "render_light_png": "https://storage.googleapis.com/anyplot-images/plots/violin-grouped-swarm/python/pygal/plot-light.png",
  "render_dark_png": "https://storage.googleapis.com/anyplot-images/plots/violin-grouped-swarm/python/pygal/plot-dark.png",
  "interactive_light_html": "https://storage.googleapis.com/anyplot-images/plots/violin-grouped-swarm/python/pygal/plot-light.html",
  "interactive_dark_html": "https://storage.googleapis.com/anyplot-images/plots/violin-grouped-swarm/python/pygal/plot-dark.html",
  "quality_score": 80.0,
  "license": "MIT",
  "guide": "https://anyplot.ai/llms.txt"
}
Part of Grouped Violin Plot with Swarm Overlay on anyplot.ai.