The same plot in 14 other libraries — JavaScript: Chart.js, Apache ECharts, Highcharts, MUI X Charts; Python: Altair, Bokeh, lets-plot, Matplotlib, Plotly, plotnine, Pygal, Seaborn; R: ggplot2; Julia: Makie.jl. Compare all 15 side by side: Grouped Violin Plot with Swarm Overlay in Python, R, Julia and JavaScript.
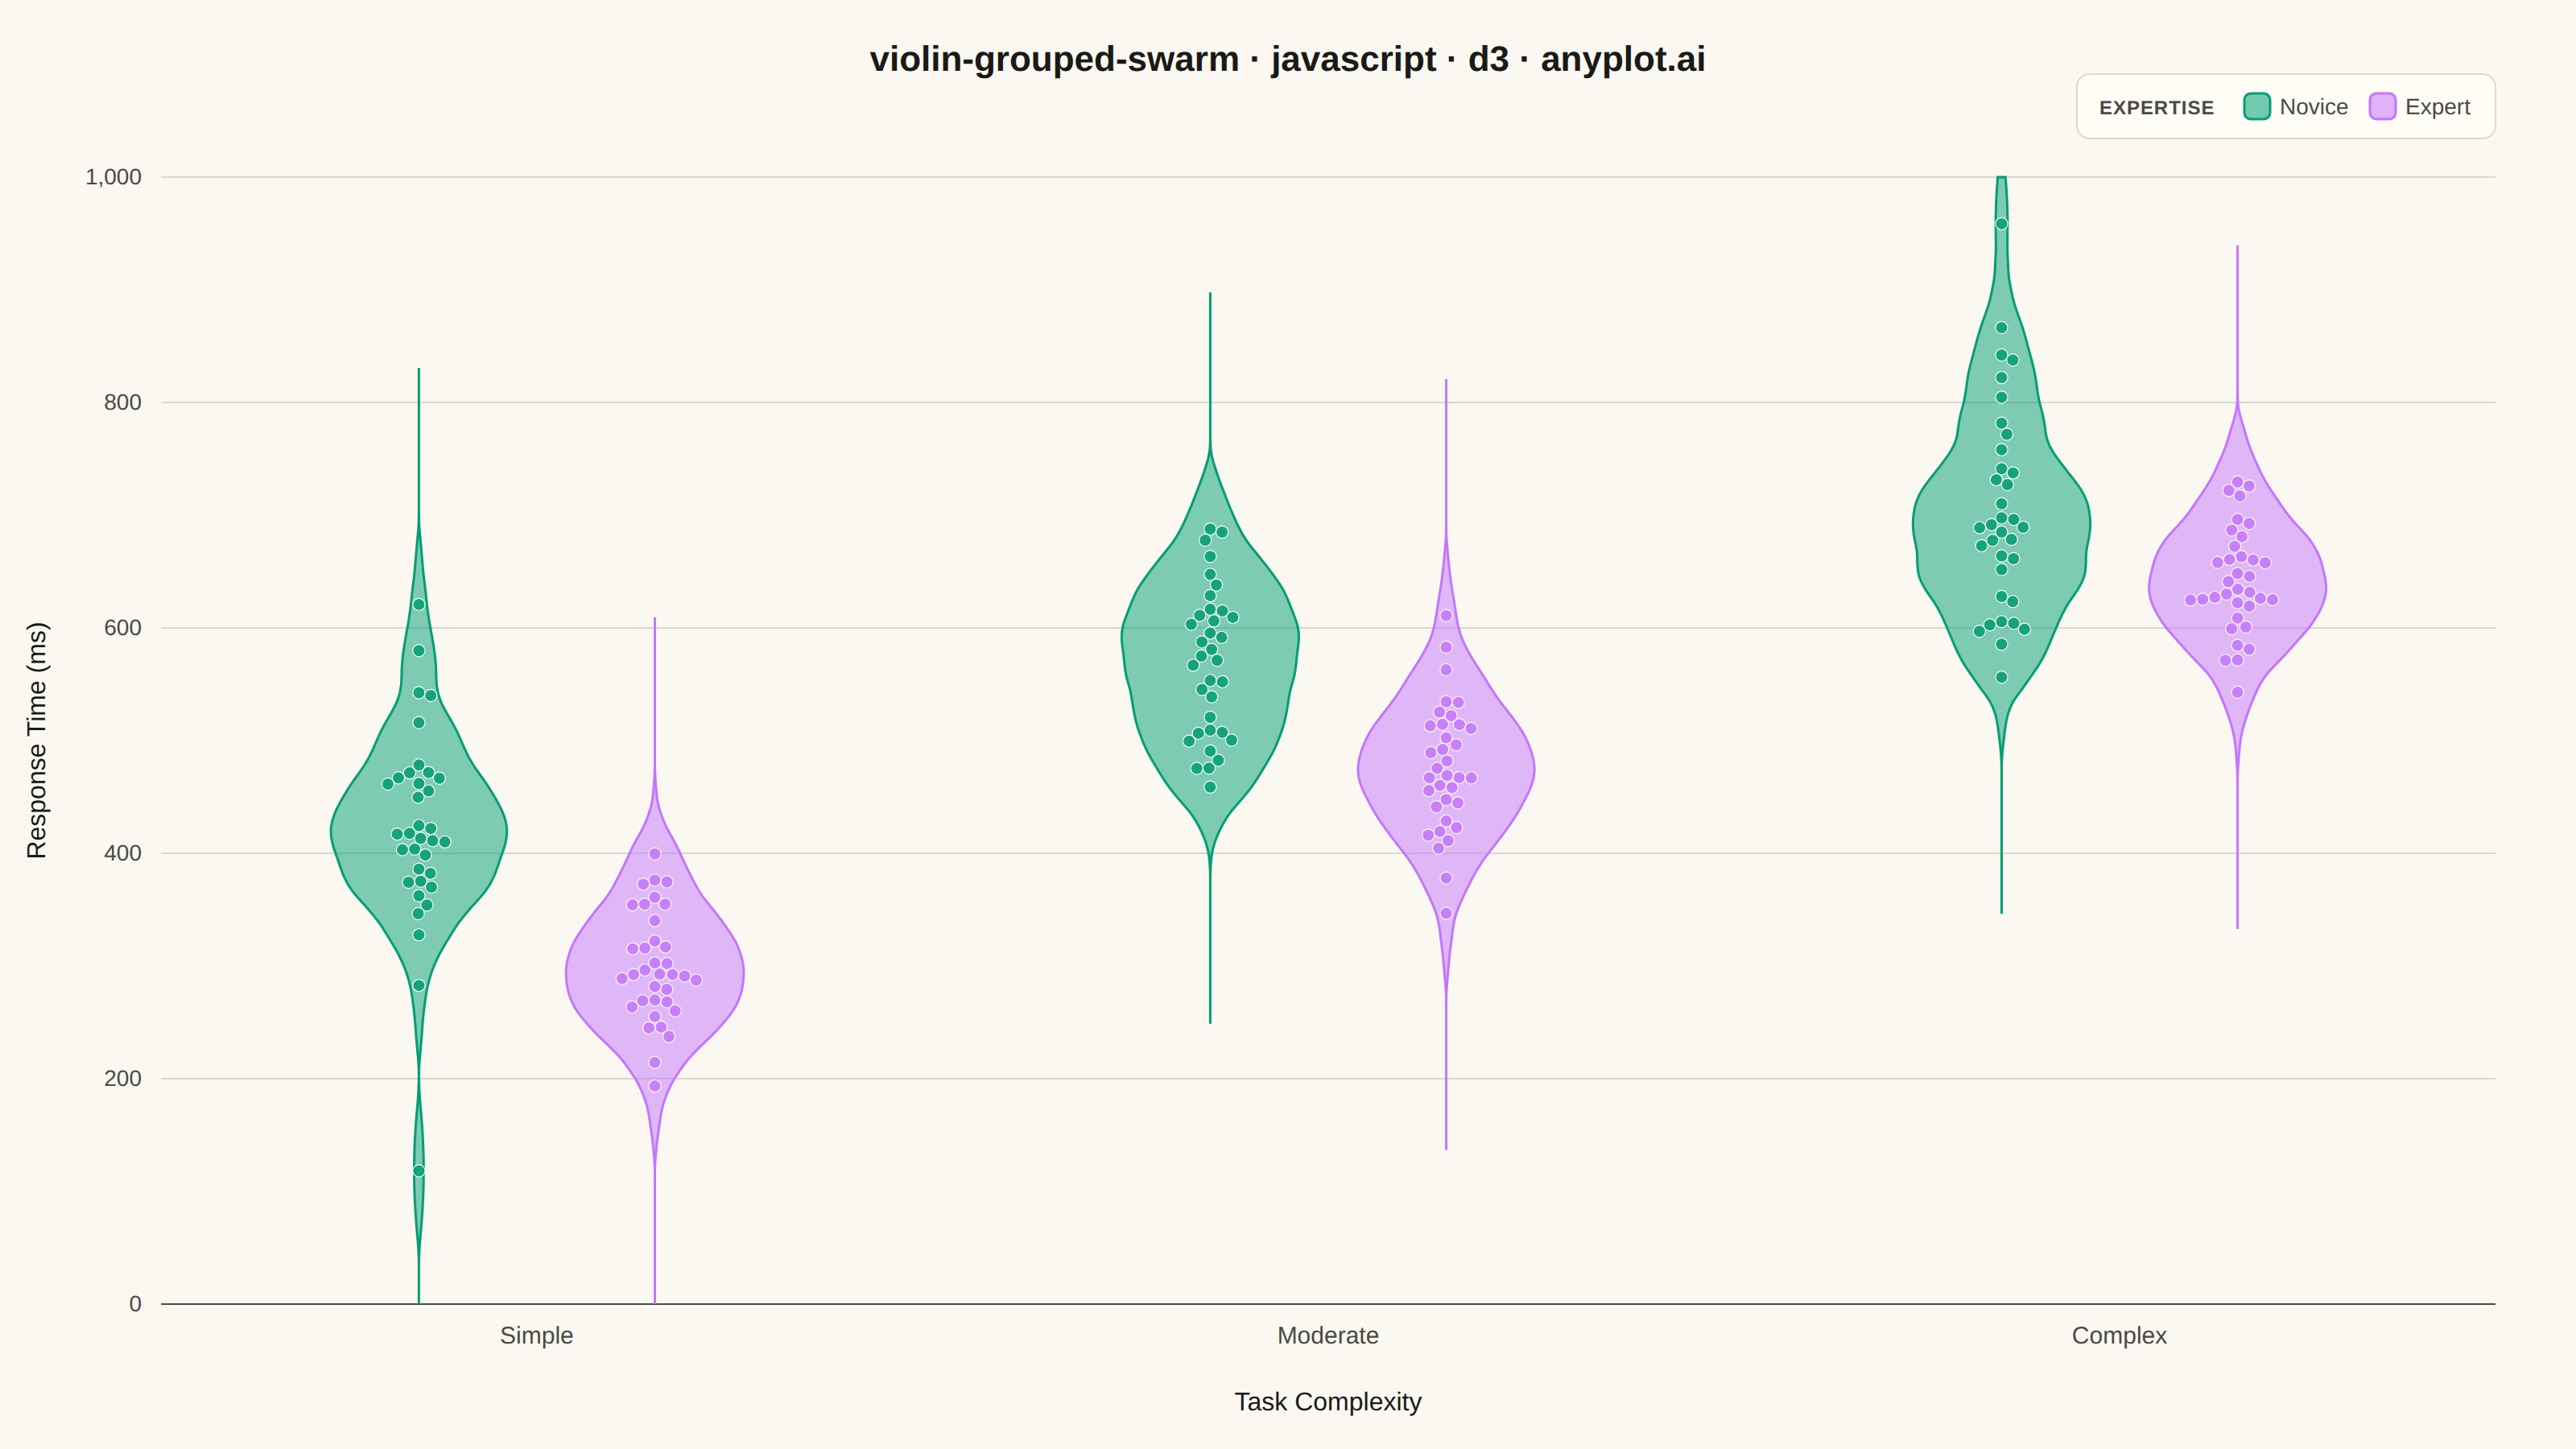
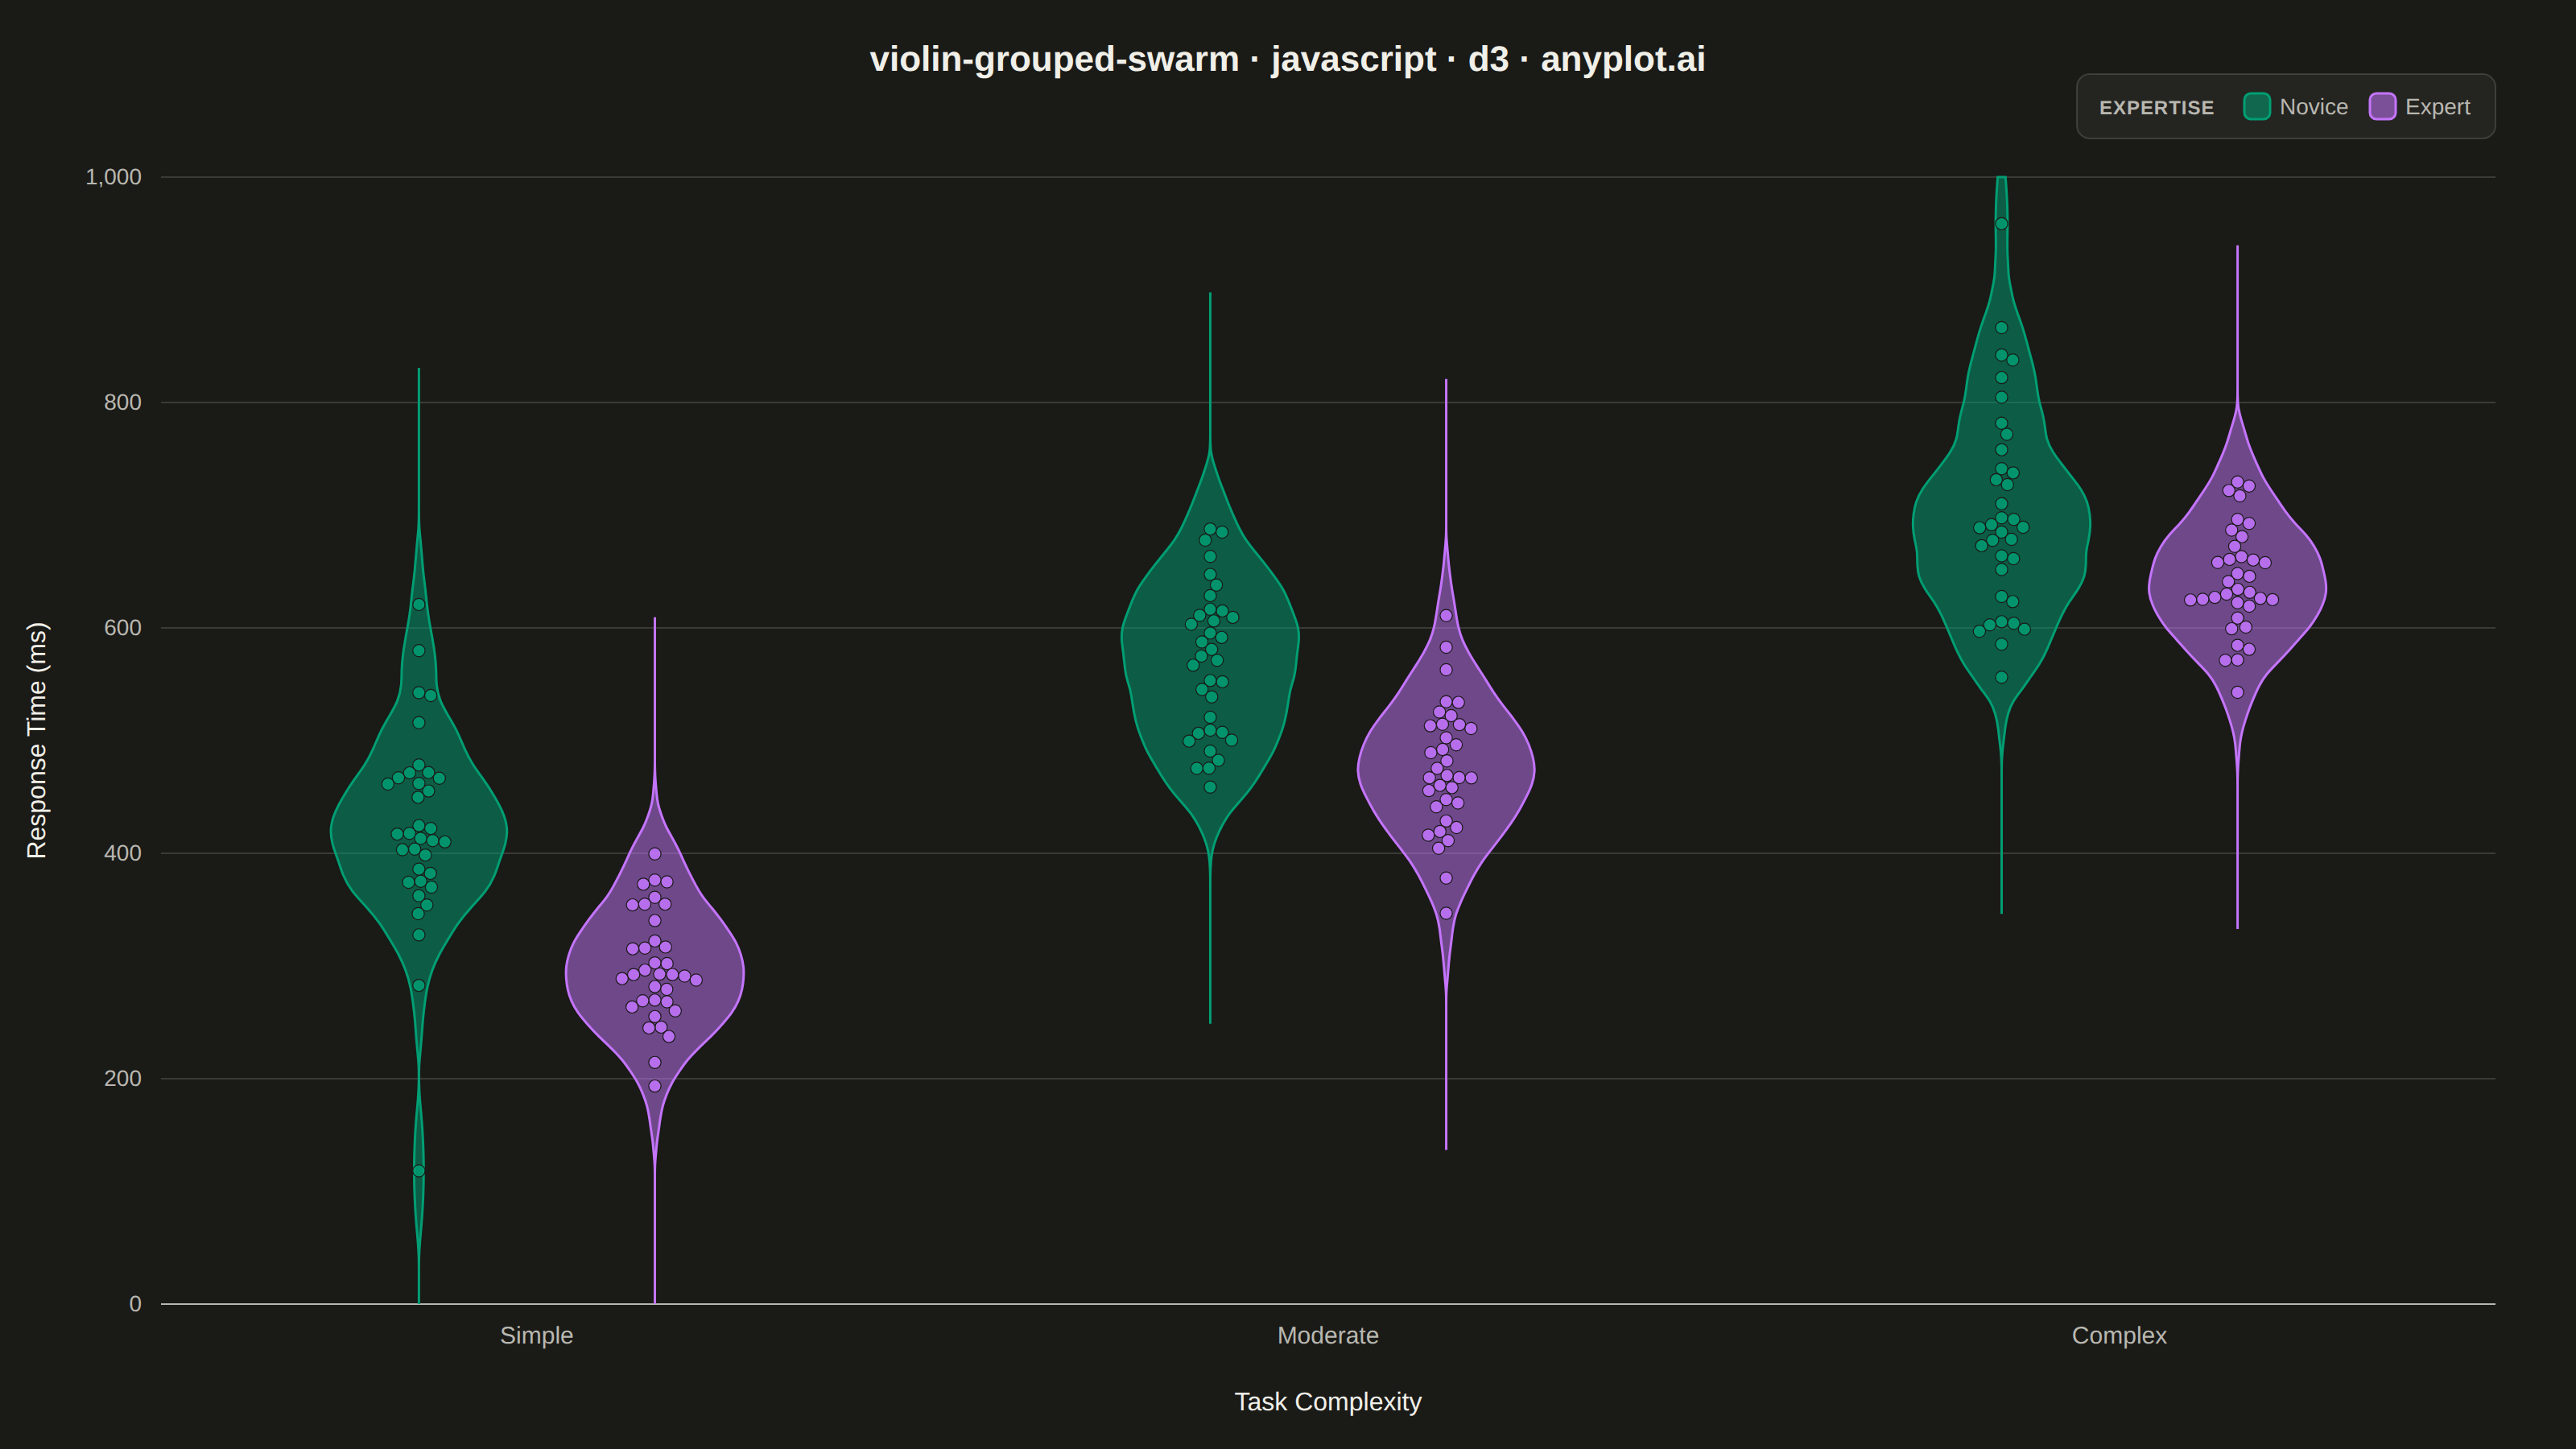
A grouped violin plot with individual data points overlaid as swarm points, showing distributions across two categorical dimensions simultaneously. Multiple violin plots are arranged by category on the x-axis and grouped by a secondary variable using color/hue, with swarm points revealing the underlying raw data. This visualization combines distribution shape visualization with complete data transparency, ideal for comparing how distributions differ across multiple factors.
// anyplot.ai
// violin-grouped-swarm: Grouped Violin Plot with Swarm Overlay
// Library: d3 7.9.0 | JavaScript 22.23.2
// Quality: 90/100 | Created: 2026-09-02

const t = window.ANYPLOT_TOKENS;
const { width, height } = window.ANYPLOT_SIZE;
const margin = { top: 110, right: 50, bottom: 90, left: 100 };
const iw = width - margin.left - margin.right;
const ih = height - margin.top - margin.bottom;

// --- Data (in-memory, deterministic LCG) ------------------------------------
function makeLcg(seed) {
  let state = seed % 2147483647;
  if (state <= 0) state += 2147483646;
  return () => {
    state = (state * 16807) % 2147483647;
    return (state - 1) / 2147483646;
  };
}
const rand = makeLcg(42);
function randNormal() {
  const u1 = Math.max(rand(), 1e-9);
  const u2 = rand();
  return Math.sqrt(-2 * Math.log(u1)) * Math.cos(2 * Math.PI * u2);
}

const categories = ["Simple", "Moderate", "Complex"];
const groups = ["Novice", "Expert"];
const meanByCategory = { Simple: 320, Moderate: 480, Complex: 650 };
const groupOffsetMs = { Novice: 95, Expert: 0 };
const groupSpreadMs = { Novice: 75, Expert: 45 };
const spreadFactor = { Simple: 1, Moderate: 1.1, Complex: 1.3 };
const samplesPerCombo = 35;

const data = [];
for (const category of categories) {
  for (const group of groups) {
    const mean = meanByCategory[category] + groupOffsetMs[group];
    const spread = groupSpreadMs[group] * spreadFactor[category];
    for (let i = 0; i < samplesPerCombo; i++) {
      const value = Math.max(80, mean + randNormal() * spread);
      data.push({ category, group, value });
    }
  }
}

// --- Scales -------------------------------------------------------------
const x0 = d3.scaleBand().domain(categories).range([0, iw]).paddingInner(0.35).paddingOuter(0.15);
const x1 = d3.scaleBand().domain(groups).range([0, x0.bandwidth()]).padding(0.18);
const y = d3.scaleLinear().domain([0, d3.max(data, (d) => d.value)]).nice().range([ih, 0]);
const color = d3.scaleOrdinal().domain(groups).range(t.palette);

// --- Kernel density estimation (per category-group violin) ------------------
function kernelEpanechnikov(bandwidth) {
  return (v) => {
    v /= bandwidth;
    return Math.abs(v) <= 1 ? (0.75 * (1 - v * v)) / bandwidth : 0;
  };
}
function kernelDensityEstimator(kernel, gridPoints) {
  return (sample) => gridPoints.map((gp) => [gp, d3.mean(sample, (v) => kernel(gp - v))]);
}

const yMax = y.domain()[1];

const subBandwidth = x1.bandwidth();
const halfWidth = subBandwidth * 0.46;

// Fixed bandwidth (shared across violins so widths stay comparable); each
// violin's density grid is still clipped to its own data range (+3
// bandwidths) rather than the shared axis domain — otherwise the
// Epanechnikov kernel's near-zero tail gets stroked as a thin needle
// spanning most of the axis.
const bandwidth = yMax * 0.07;
const violins = categories.flatMap((category) =>
  groups.map((group) => {
    const sample = data.filter((d) => d.category === category && d.group === group).map((d) => d.value);
    const [sampleMin, sampleMax] = d3.extent(sample);
    const lo = Math.max(0, sampleMin - bandwidth * 3);
    const hi = Math.min(yMax, sampleMax + bandwidth * 3);
    const gridPoints = d3.range(60).map((i) => lo + (i / 59) * (hi - lo));
    const density = kernelDensityEstimator(kernelEpanechnikov(bandwidth), gridPoints)(sample);
    const maxDensity = d3.max(density, (d) => d[1]);
    return { category, group, density, maxDensity, sample };
  }),
);

// --- SVG mount ----------------------------------------------------------
const svg = d3.select("#container").append("svg").attr("width", width).attr("height", height);
const g = svg.append("g").attr("transform", `translate(${margin.left},${margin.top})`);

// --- Y grid + axis --------------------------------------------------------
const yAxisG = g.append("g").call(d3.axisLeft(y).ticks(6).tickSize(-iw).tickPadding(12));
yAxisG.selectAll("line").attr("stroke", t.grid);
yAxisG.select(".domain").remove();
yAxisG.selectAll("text").attr("fill", t.inkSoft).style("font-size", "14px");

// --- X axis -----------------------------------------------------------------
const xAxisG = g.append("g").attr("transform", `translate(0,${ih})`).call(d3.axisBottom(x0).tickSize(0).tickPadding(14));
xAxisG.selectAll("text").attr("fill", t.inkSoft).style("font-size", "15px");
xAxisG.select(".domain").attr("stroke", t.inkSoft);

// --- Violins + swarm points, one <g> per category-group combination --------
const swarmRadius = 3.8;
for (const v of violins) {
  const violinG = g
    .append("g")
    .attr("transform", `translate(${x0(v.category) + x1(v.group)},0)`);

  const xNum = d3.scaleLinear().domain([0, v.maxDensity]).range([0, halfWidth]);
  const area = d3
    .area()
    .curve(d3.curveBasis)
    .y((d) => y(d[0]))
    .x0((d) => subBandwidth / 2 - xNum(d[1]))
    .x1((d) => subBandwidth / 2 + xNum(d[1]));

  violinG
    .append("path")
    .datum(v.density)
    .attr("d", area)
    .attr("fill", color(v.group))
    .attr("fill-opacity", 0.5)
    .attr("stroke", color(v.group))
    .attr("stroke-width", 1.5);

  // Beeswarm layout: sort by pixel-y, place each point at the smallest
  // horizontal offset that clears every already-placed point within 2*radius.
  const points = v.sample.map((value) => ({ value, py: y(value), px: 0 }));
  points.sort((a, b) => a.py - b.py);
  const placed = [];
  for (const p of points) {
    const neighbors = placed.filter((q) => Math.abs(q.py - p.py) < swarmRadius * 2);
    if (neighbors.length > 0) {
      const candidates = [0];
      for (const q of neighbors) {
        const dy = p.py - q.py;
        const dx = Math.sqrt(Math.max(0, (swarmRadius * 2) ** 2 - dy * dy));
        candidates.push(q.px + dx, q.px - dx);
      }
      candidates.sort((a, b) => Math.abs(a) - Math.abs(b));
      p.px = candidates.find((c) =>
        neighbors.every((q) => Math.hypot(c - q.px, p.py - q.py) >= swarmRadius * 2 - 0.01),
      ) ?? candidates[candidates.length - 1];
    }
    p.px = Math.max(-halfWidth, Math.min(halfWidth, p.px));
    placed.push(p);
  }

  violinG
    .selectAll("circle")
    .data(placed)
    .join("circle")
    .attr("cx", (d) => subBandwidth / 2 + d.px)
    .attr("cy", (d) => d.py)
    .attr("r", swarmRadius)
    .attr("fill", color(v.group))
    .attr("fill-opacity", 0.85)
    .attr("stroke", t.pageBg)
    .attr("stroke-width", 0.6);
}

// --- Axis labels --------------------------------------------------------
g.append("text")
  .attr("x", -ih / 2)
  .attr("y", -margin.left + 28)
  .attr("transform", "rotate(-90)")
  .attr("text-anchor", "middle")
  .attr("fill", t.ink)
  .style("font-size", "16px")
  .text("Response Time (ms)");

g.append("text")
  .attr("x", iw / 2)
  .attr("y", ih + margin.bottom - 24)
  .attr("text-anchor", "middle")
  .attr("fill", t.ink)
  .style("font-size", "16px")
  .text("Task Complexity");

// --- Legend (group hue) --------------------------------------------------
const legendW = 260;
const legendH = 40;
const legendSwatchStart = 104;
const legend = svg.append("g").attr("transform", `translate(${width - margin.right - legendW},46)`);

legend
  .append("rect")
  .attr("width", legendW)
  .attr("height", legendH)
  .attr("rx", 8)
  .attr("fill", t.elevatedBg)
  .attr("stroke", t.grid)
  .attr("stroke-width", 1);

legend
  .append("text")
  .attr("x", 14)
  .attr("y", legendH / 2 + 5)
  .attr("fill", t.inkSoft)
  .style("font-size", "12px")
  .style("font-weight", "600")
  .style("letter-spacing", "0.04em")
  .text("EXPERTISE");

groups.forEach((group, i) => {
  const row = legend.append("g").attr("transform", `translate(${legendSwatchStart + i * 78},${legendH / 2 - 8})`);
  row
    .append("rect")
    .attr("width", 16)
    .attr("height", 16)
    .attr("rx", 4)
    .attr("fill", color(group))
    .attr("fill-opacity", 0.55)
    .attr("stroke", color(group))
    .attr("stroke-width", 1.5);
  row
    .append("text")
    .attr("x", 22)
    .attr("y", 13)
    .attr("fill", t.inkSoft)
    .style("font-size", "14px")
    .text(group);
});

// --- Title ----------------------------------------------------------------
svg
  .append("text")
  .attr("x", width / 2)
  .attr("y", 44)
  .attr("text-anchor", "middle")
  .attr("fill", t.ink)
  .style("font-size", "22px")
  .style("font-weight", "600")
  .text("violin-grouped-swarm · javascript · d3 · anyplot.ai");
Runnable source as JSON, for any HTTP client: https://api.anyplot.ai/specs/violin-grouped-swarm/d3/code. Any spec id and library id listed in llms-full.txt fit the same URL shape; every URL below is complete and callable.
{
  "spec_id": "violin-grouped-swarm",
  "language": "javascript",
  "library": "d3",
  "page": "https://anyplot.ai/violin-grouped-swarm/javascript/d3",
  "hub": "https://anyplot.ai/violin-grouped-swarm",
  "code_json": "https://api.anyplot.ai/specs/violin-grouped-swarm/d3/code",
  "spec_json": "https://api.anyplot.ai/specs/violin-grouped-swarm",
  "render_light_png": "https://storage.googleapis.com/anyplot-images/plots/violin-grouped-swarm/javascript/d3/plot-light.png",
  "render_dark_png": "https://storage.googleapis.com/anyplot-images/plots/violin-grouped-swarm/javascript/d3/plot-dark.png",
  "interactive_light_html": "https://storage.googleapis.com/anyplot-images/plots/violin-grouped-swarm/javascript/d3/plot-light.html",
  "interactive_dark_html": "https://storage.googleapis.com/anyplot-images/plots/violin-grouped-swarm/javascript/d3/plot-dark.html",
  "quality_score": 90.0,
  "license": "MIT",
  "guide": "https://anyplot.ai/llms.txt"
}
Part of Grouped Violin Plot with Swarm Overlay on anyplot.ai.