The same plot in 14 other libraries — JavaScript: Chart.js, D3.js, Highcharts, MUI X Charts; Python: Altair, Bokeh, lets-plot, Matplotlib, Plotly, plotnine, Pygal, Seaborn; R: ggplot2; Julia: Makie.jl. Compare all 15 side by side: Grouped Violin Plot with Swarm Overlay in Python, R, Julia and JavaScript.
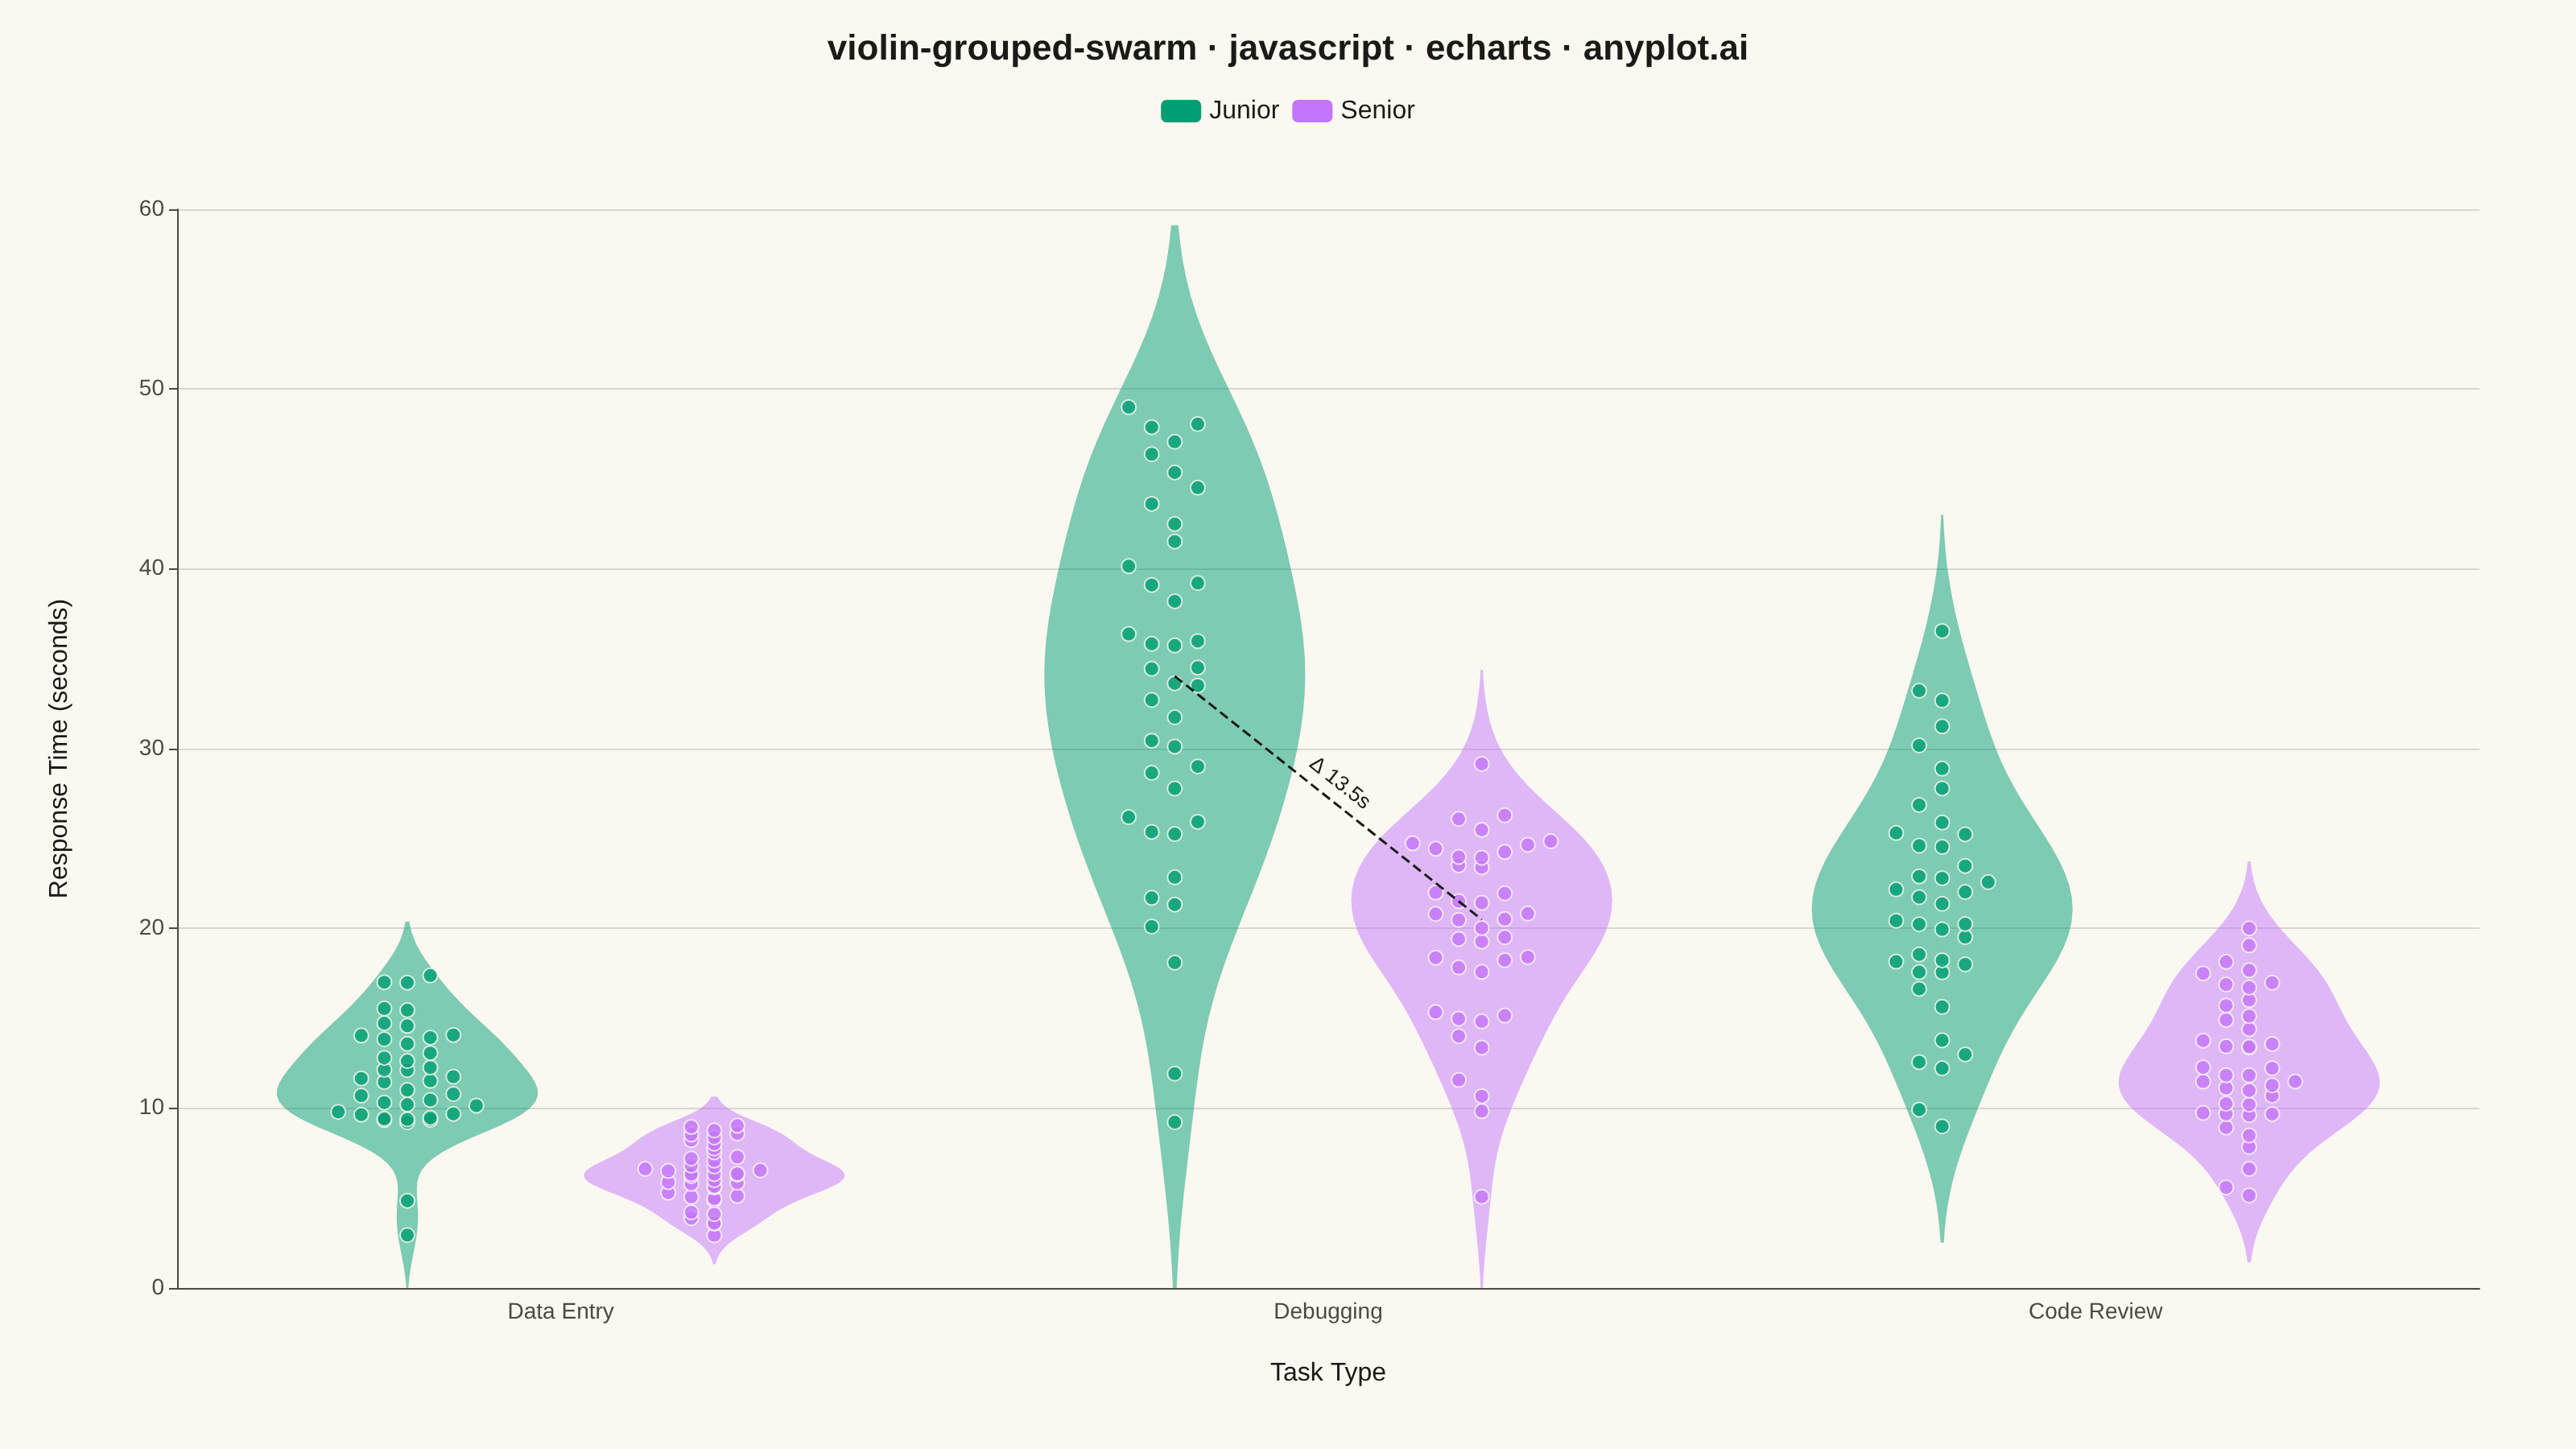
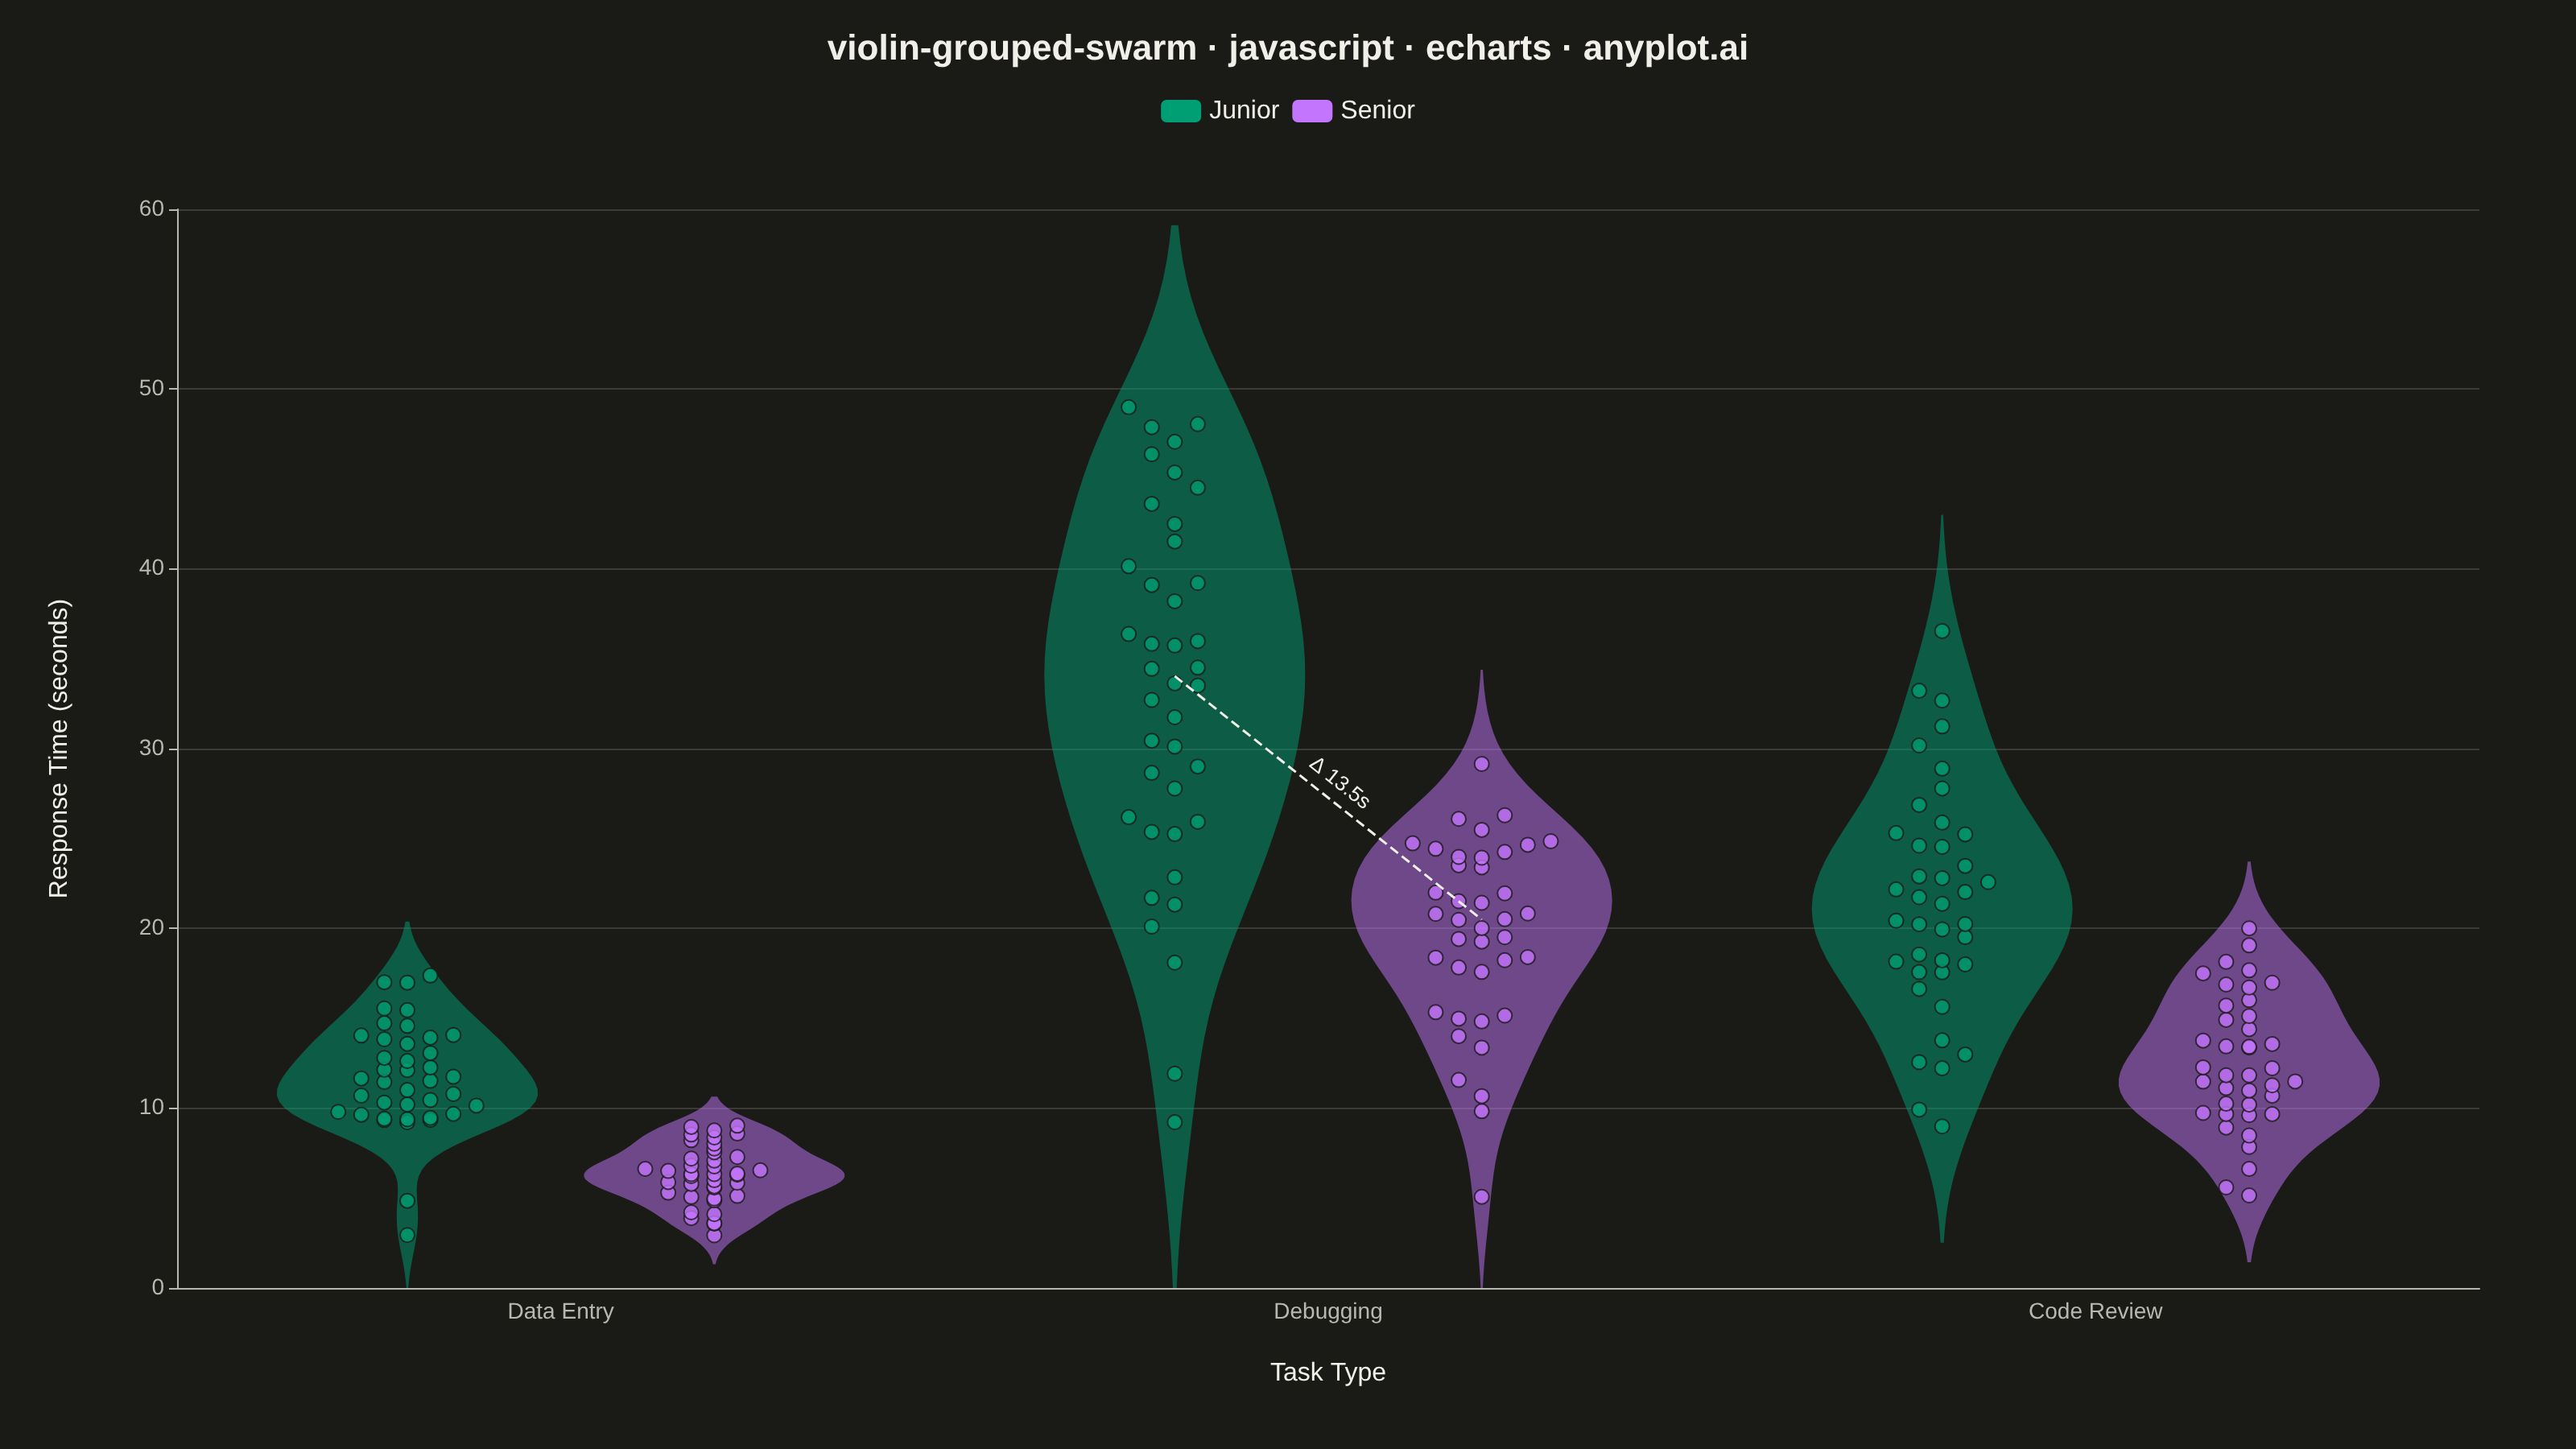
A grouped violin plot with individual data points overlaid as swarm points, showing distributions across two categorical dimensions simultaneously. Multiple violin plots are arranged by category on the x-axis and grouped by a secondary variable using color/hue, with swarm points revealing the underlying raw data. This visualization combines distribution shape visualization with complete data transparency, ideal for comparing how distributions differ across multiple factors.
// anyplot.ai
// violin-grouped-swarm: Grouped Violin Plot with Swarm Overlay
// Library: echarts 6.1.0 | JavaScript 22.23.2
// Quality: 93/100 | Created: 2026-09-02

const t = window.ANYPLOT_TOKENS;

// --- Deterministic PRNG (LCG + Box-Muller) so data is reproducible ---------
let seed = 42;
function nextUniform() {
  seed = (seed * 1664525 + 1013904223) % 4294967296;
  return seed / 4294967296;
}
function randNormal(mean, std) {
  const u1 = Math.max(nextUniform(), 1e-9);
  const u2 = nextUniform();
  const z = Math.sqrt(-2 * Math.log(u1)) * Math.cos(2 * Math.PI * u2);
  return mean + z * std;
}

// --- Data: response times (seconds) across task types and expertise levels
const categories = ["Data Entry", "Debugging", "Code Review"];
const groups = ["Junior", "Senior"];
const N_PER_COMBO = 40;
const nCat = categories.length;
const nGrp = groups.length;

// baseline [mean, std] per task type, scaled by an expertise-level factor
const categoryBaseline = {
  "Data Entry": [8, 2.2],
  Debugging: [24, 7.5],
  "Code Review": [15, 4.5],
};
const groupFactor = { Junior: 1.4, Senior: 0.8 };

const combos = categories.map(() => groups.map(() => []));
categories.forEach((cat, ci) => {
  const [baseMean, baseStd] = categoryBaseline[cat];
  groups.forEach((grp, gi) => {
    const factor = groupFactor[grp];
    for (let i = 0; i < N_PER_COMBO; i++) {
      combos[ci][gi].push(Math.max(1, randNormal(baseMean * factor, baseStd * factor)));
    }
  });
});

// --- Gaussian KDE (Silverman bandwidth), density self-normalized to [0, 1] --
function gaussianKde(values, gridSize) {
  const n = values.length;
  const mean = values.reduce((a, b) => a + b, 0) / n;
  const variance = values.reduce((a, b) => a + (b - mean) ** 2, 0) / (n - 1);
  const std = Math.sqrt(variance);
  const bandwidth = 1.06 * std * Math.pow(n, -0.2);
  const dataMin = Math.min(...values);
  const dataMax = Math.max(...values);
  const pad = bandwidth * 2;
  const gridMin = Math.max(0, dataMin - pad);
  const gridMax = dataMax + pad;
  const grid = [];
  const density = [];
  for (let i = 0; i < gridSize; i++) {
    const y = gridMin + ((gridMax - gridMin) * i) / (gridSize - 1);
    let sum = 0;
    for (let j = 0; j < n; j++) {
      const u = (y - values[j]) / bandwidth;
      sum += Math.exp(-0.5 * u * u);
    }
    grid.push(y);
    density.push(sum / (n * bandwidth * Math.sqrt(2 * Math.PI)));
  }
  const maxDensity = Math.max(...density);
  return { grid, density: density.map((d) => d / maxDensity) };
}

// --- Slot geometry: categories at integer x, groups dodge within a slot ----
const CATEGORY_SPAN = 0.8; // total width per category reserved for its groups
const GROUP_WIDTH = CATEGORY_SPAN / nGrp;
const GROUP_GAP = 0.06; // gap between adjacent group violins in the same category
const VIOLIN_HALF_WIDTH = (GROUP_WIDTH - GROUP_GAP) / 2;
const SWARM_HALF_WIDTH = VIOLIN_HALF_WIDTH * 0.75;

function slotX(catIdx, grpIdx) {
  const start = catIdx - CATEGORY_SPAN / 2;
  return start + GROUP_WIDTH * (grpIdx + 0.5);
}

// violinsByGroup[gi] holds one violin polygon per category, in category order
const violinsByGroup = groups.map(() => []);
// swarmByGroup[gi] holds [x, y] pairs for every observation
const swarmByGroup = groups.map(() => []);

categories.forEach((cat, ci) => {
  groups.forEach((grp, gi) => {
    const values = combos[ci][gi];
    const centerX = slotX(ci, gi);

    // Violin: mirrored KDE profile, closed polygon
    const { grid, density } = gaussianKde(values, 60);
    const left = grid.map((y, i) => [centerX - density[i] * VIOLIN_HALF_WIDTH, y]);
    const right = grid.map((y, i) => [centerX + density[i] * VIOLIN_HALF_WIDTH, y]).reverse();
    violinsByGroup[gi].push({ points: left.concat(right) });

    // Swarm: bin the values, dodge symmetrically within each bin
    const sorted = values.slice().sort((a, b) => a - b);
    const dataMin = sorted[0];
    const dataMax = sorted[sorted.length - 1];
    const nBins = 18;
    const binWidth = (dataMax - dataMin) / nBins || 1;
    const bins = Array.from({ length: nBins }, () => []);
    sorted.forEach((v) => {
      let idx = Math.floor((v - dataMin) / binWidth);
      if (idx >= nBins) idx = nBins - 1;
      if (idx < 0) idx = 0;
      bins[idx].push(v);
    });
    const maxBinCount = Math.max(...bins.map((b) => b.length));
    const halfMax = Math.max(1, Math.ceil(maxBinCount / 2));
    const pointSpacing = Math.min(0.03, SWARM_HALF_WIDTH / halfMax);
    bins.forEach((bin) => {
      bin.forEach((v, k) => {
        const rank = Math.ceil(k / 2);
        const sign = k % 2 === 0 ? 1 : -1;
        swarmByGroup[gi].push([centerX + sign * rank * pointSpacing, v]);
      });
    });
  });
});

// Explicit y-axis bounds from the full violin extent — the auto-scaled "nice"
// range would clip the KDE tails, which reach well past the raw data min/max.
const allViolinYs = violinsByGroup.flatMap((vs) => vs.flatMap((v) => v.points.map((p) => p[1])));
const yAxisMax = Math.ceil(Math.max(...allViolinYs) / 5) * 5;

// Highlight the widest Junior/Senior split (Debugging) with a median-to-median
// markLine, giving the viewer a focal point beyond "read the chart yourself".
function median(values) {
  const sorted = values.slice().sort((a, b) => a - b);
  const mid = Math.floor(sorted.length / 2);
  return sorted.length % 2 === 0 ? (sorted[mid - 1] + sorted[mid]) / 2 : sorted[mid];
}
const gapCatIdx = categories.indexOf("Debugging");
const gapJuniorMedian = median(combos[gapCatIdx][0]);
const gapSeniorMedian = median(combos[gapCatIdx][1]);

// --- Chart --------------------------------------------------------------
const chart = echarts.init(document.getElementById("container"));

function renderViolin(params, api) {
  const violin = violinsByGroup[params.seriesIndex][params.dataIndex];
  const points = violin.points.map((p) => api.coord(p));
  return {
    type: "polygon",
    shape: { points },
    style: api.style({ opacity: 0.5, lineWidth: 1.5 }),
  };
}

const violinSeries = groups.map((grp, gi) => ({
  name: grp,
  type: "custom",
  renderItem: renderViolin,
  itemStyle: { color: t.palette[gi] },
  data: violinsByGroup[gi].map(() => 0),
  z: 2,
  silent: true,
}));

const swarmSeries = groups.map((grp, gi) => ({
  name: grp,
  type: "scatter",
  data: swarmByGroup[gi],
  symbolSize: 9,
  itemStyle: { color: t.palette[gi], borderColor: t.pageBg, borderWidth: 1 },
  z: 3,
  ...(gi === groups.length - 1
    ? {
        markLine: {
          symbol: "none",
          silent: true,
          z: 4,
          lineStyle: { color: t.ink, type: "dashed", width: 1.5 },
          label: {
            formatter: `Δ ${Math.abs(gapSeniorMedian - gapJuniorMedian).toFixed(1)}s`,
            color: t.ink,
            fontSize: 13,
            position: "middle",
          },
          data: [
            [
              { coord: [slotX(gapCatIdx, 0), gapJuniorMedian] },
              { coord: [slotX(gapCatIdx, 1), gapSeniorMedian] },
            ],
          ],
        },
      }
    : {}),
}));

chart.setOption({
  animation: false,
  backgroundColor: "transparent",
  color: t.palette,
  title: {
    text: "violin-grouped-swarm · javascript · echarts · anyplot.ai",
    left: "center",
    textStyle: { color: t.ink, fontSize: 22 },
  },
  legend: {
    data: groups,
    top: 56,
    textStyle: { color: t.ink, fontSize: 16 },
  },
  tooltip: {
    trigger: "item",
    formatter: (p) => {
      if (p.seriesType !== "scatter") return "";
      const catIdx = Math.round(p.value[0]);
      const cat = categories[Math.max(0, Math.min(nCat - 1, catIdx))];
      return `${cat}<br/>${p.seriesName}: ${p.value[1].toFixed(1)}s`;
    },
  },
  grid: { left: 110, right: 60, top: 130, bottom: 100 },
  xAxis: {
    type: "value",
    min: -0.5,
    max: nCat - 0.5,
    minInterval: 1,
    maxInterval: 1,
    name: "Task Type",
    nameLocation: "middle",
    nameGap: 45,
    nameTextStyle: { color: t.ink, fontSize: 16 },
    axisLabel: {
      color: t.inkSoft,
      fontSize: 14,
      formatter: (value) => {
        const idx = Math.round(value);
        return Math.abs(value - idx) < 1e-6 && idx >= 0 && idx < nCat ? categories[idx] : "";
      },
    },
    axisLine: { onZero: false, lineStyle: { color: t.inkSoft } },
    axisTick: { show: false },
    splitLine: { show: false },
  },
  yAxis: {
    type: "value",
    min: 0,
    max: yAxisMax,
    name: "Response Time (seconds)",
    nameLocation: "middle",
    nameGap: 65,
    nameTextStyle: { color: t.ink, fontSize: 16 },
    axisLabel: { color: t.inkSoft, fontSize: 14 },
    axisLine: { onZero: false, lineStyle: { color: t.inkSoft } },
    splitLine: { lineStyle: { color: t.grid } },
  },
  series: [...violinSeries, ...swarmSeries],
});
Runnable source as JSON, for any HTTP client: https://api.anyplot.ai/specs/violin-grouped-swarm/echarts/code. Any spec id and library id listed in llms-full.txt fit the same URL shape; every URL below is complete and callable.
{
  "spec_id": "violin-grouped-swarm",
  "language": "javascript",
  "library": "echarts",
  "page": "https://anyplot.ai/violin-grouped-swarm/javascript/echarts",
  "hub": "https://anyplot.ai/violin-grouped-swarm",
  "code_json": "https://api.anyplot.ai/specs/violin-grouped-swarm/echarts/code",
  "spec_json": "https://api.anyplot.ai/specs/violin-grouped-swarm",
  "render_light_png": "https://storage.googleapis.com/anyplot-images/plots/violin-grouped-swarm/javascript/echarts/plot-light.png",
  "render_dark_png": "https://storage.googleapis.com/anyplot-images/plots/violin-grouped-swarm/javascript/echarts/plot-dark.png",
  "interactive_light_html": "https://storage.googleapis.com/anyplot-images/plots/violin-grouped-swarm/javascript/echarts/plot-light.html",
  "interactive_dark_html": "https://storage.googleapis.com/anyplot-images/plots/violin-grouped-swarm/javascript/echarts/plot-dark.html",
  "quality_score": 93.0,
  "license": "MIT",
  "guide": "https://anyplot.ai/llms.txt"
}
Part of Grouped Violin Plot with Swarm Overlay on anyplot.ai.