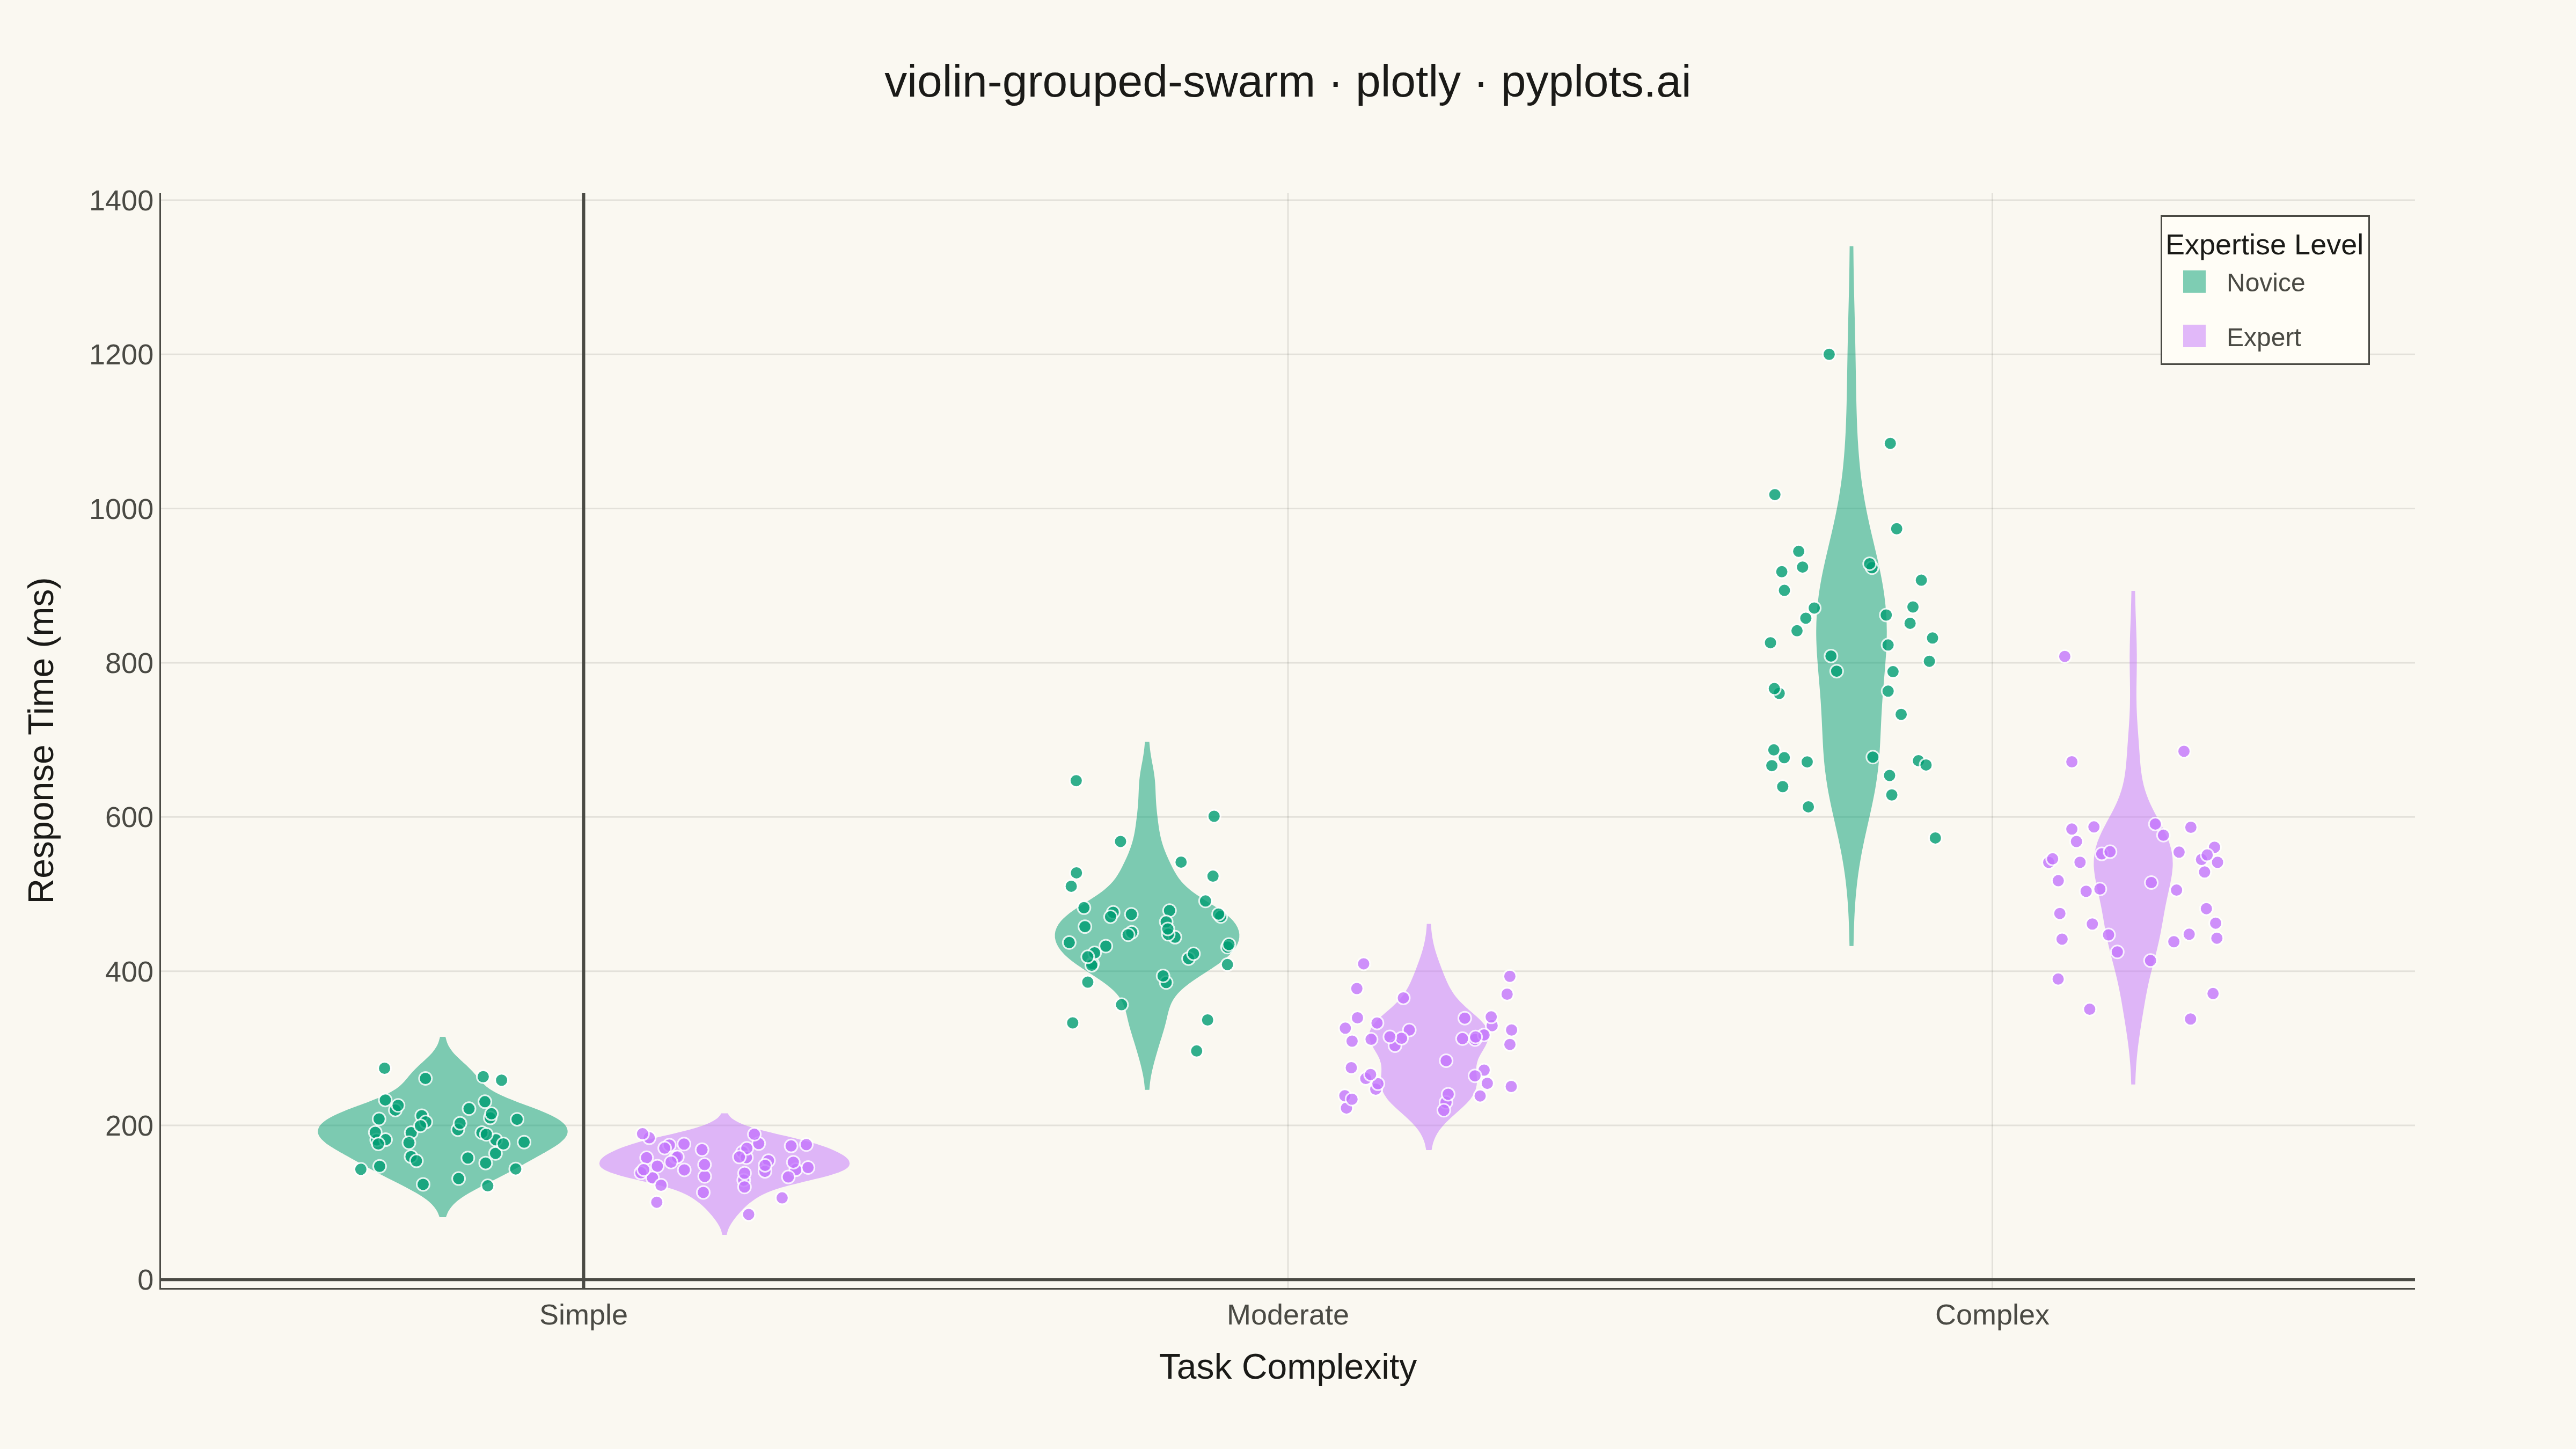
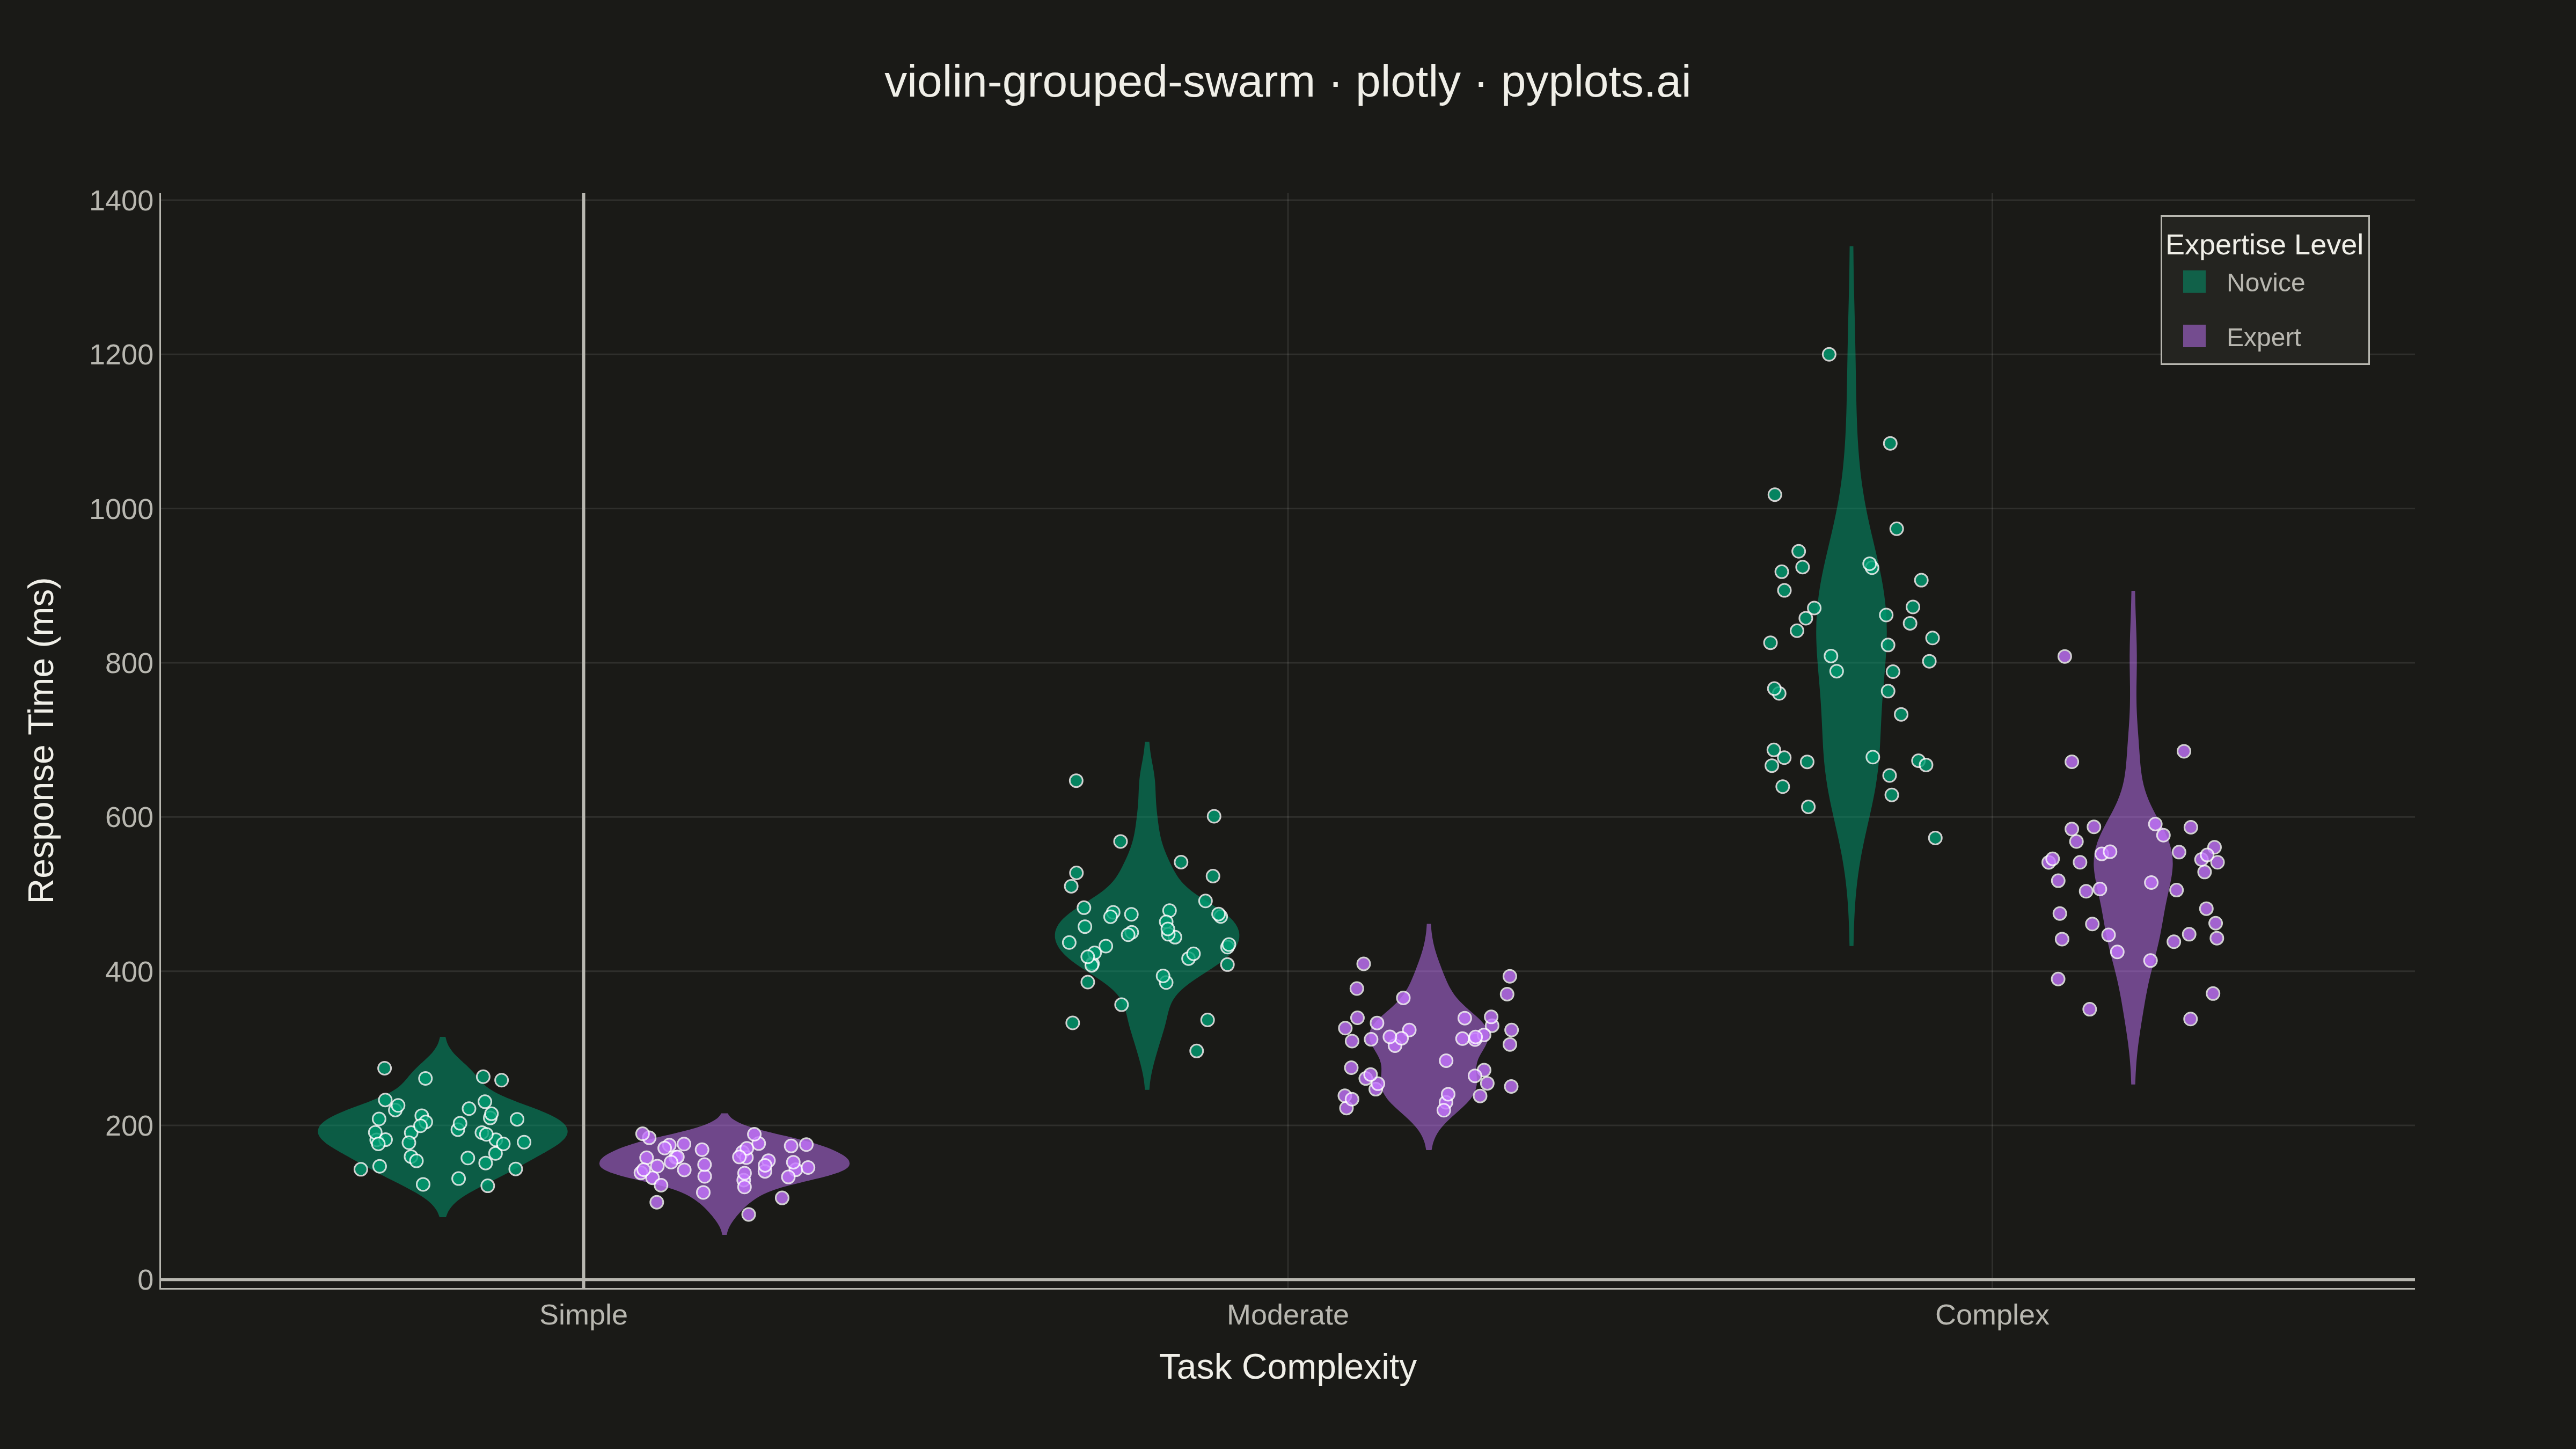
A grouped violin plot with individual data points overlaid as swarm points, showing distributions across two categorical dimensions simultaneously. Multiple violin plots are arranged by category on the x-axis and grouped by a secondary variable using color/hue, with swarm points revealing the underlying raw data. This visualization combines distribution shape visualization with complete data transparency, ideal for comparing how distributions differ across multiple factors.
""" anyplot.ai
violin-grouped-swarm: Grouped Violin Plot with Swarm Overlay
Library: plotly 6.7.0 | Python 3.13.13
Quality: 90/100 | Updated: 2026-05-18
"""

import os

import numpy as np
import pandas as pd
import plotly.graph_objects as go


# Theme tokens
THEME = os.getenv("ANYPLOT_THEME", "light")
PAGE_BG = "#FAF8F1" if THEME == "light" else "#1A1A17"
ELEVATED_BG = "#FFFDF6" if THEME == "light" else "#242420"
INK = "#1A1A17" if THEME == "light" else "#F0EFE8"
INK_SOFT = "#4A4A44" if THEME == "light" else "#B8B7B0"
GRID = "rgba(26,26,23,0.10)" if THEME == "light" else "rgba(240,239,232,0.10)"

# Data: Response times across task types and expertise levels
np.random.seed(42)

categories = ["Simple", "Moderate", "Complex"]
groups = ["Novice", "Expert"]

data = []
for cat in categories:
    for grp in groups:
        n = 40
        if cat == "Simple":
            base = 200 if grp == "Novice" else 150
            spread = 40 if grp == "Novice" else 25
        elif cat == "Moderate":
            base = 450 if grp == "Novice" else 300
            spread = 80 if grp == "Novice" else 50
        else:  # Complex
            base = 800 if grp == "Novice" else 500
            spread = 150 if grp == "Novice" else 80

        values = np.random.normal(base, spread, n)
        values = np.clip(values, 50, 1200)  # Keep values realistic

        for v in values:
            data.append({"category": cat, "group": grp, "value": v})

df = pd.DataFrame(data)

# Okabe-Ito colors
colors = {"Novice": "#009E73", "Expert": "#C475FD"}

# Create figure
fig = go.Figure()

# Add violins and scatter points for each category-group combination
x_positions = {"Simple": 0, "Moderate": 1, "Complex": 2}
offsets = {"Novice": -0.2, "Expert": 0.2}

for grp in groups:
    grp_data = df[df["group"] == grp]

    # Add violin for this group
    fig.add_trace(
        go.Violin(
            x=[x_positions[cat] + offsets[grp] for cat in grp_data["category"]],
            y=grp_data["value"],
            name=grp,
            legendgroup=grp,
            fillcolor=colors[grp],
            line={"color": colors[grp], "width": 2},
            opacity=0.5,
            width=0.35,
            meanline_visible=True,
            showlegend=True,
            points=False,  # We'll add swarm separately
        )
    )

# Add swarm-like scatter points
for grp in groups:
    for cat in categories:
        subset = df[(df["group"] == grp) & (df["category"] == cat)]
        values = subset["value"].values
        n = len(values)

        # Create swarm-like horizontal jitter based on density
        base_x = x_positions[cat] + offsets[grp]

        # Sort values and assign jitter based on local density
        sorted_indices = np.argsort(values)
        jitter = np.zeros(n)

        # Create alternating positions within bands
        for i, idx in enumerate(sorted_indices):
            # Alternate left/right within the violin
            side = 1 if i % 2 == 0 else -1
            jitter[idx] = side * np.random.uniform(0.02, 0.12)

        x_vals = base_x + jitter

        fig.add_trace(
            go.Scatter(
                x=x_vals,
                y=values,
                mode="markers",
                marker={"size": 8, "color": colors[grp], "opacity": 0.8, "line": {"width": 1, "color": "white"}},
                name=grp,
                legendgroup=grp,
                showlegend=False,
                hovertemplate=f"{grp}<br>{cat}<br>Response Time: %{{y:.0f}} ms<extra></extra>",
            )
        )

# Update layout with theme-adaptive styling
fig.update_layout(
    title={
        "text": "violin-grouped-swarm · plotly · pyplots.ai",
        "font": {"size": 28, "color": INK},
        "x": 0.5,
        "xanchor": "center",
    },
    xaxis={
        "title": {"text": "Task Complexity", "font": {"size": 22, "color": INK}},
        "tickfont": {"size": 18, "color": INK_SOFT},
        "tickmode": "array",
        "tickvals": [0, 1, 2],
        "ticktext": ["Simple", "Moderate", "Complex"],
        "range": [-0.6, 2.6],
        "gridcolor": GRID,
        "gridwidth": 1,
        "linecolor": INK_SOFT,
        "zerolinecolor": INK_SOFT,
    },
    yaxis={
        "title": {"text": "Response Time (ms)", "font": {"size": 22, "color": INK}},
        "tickfont": {"size": 18, "color": INK_SOFT},
        "gridcolor": GRID,
        "gridwidth": 1,
        "linecolor": INK_SOFT,
        "zerolinecolor": INK_SOFT,
    },
    legend={
        "title": {"text": "Expertise Level", "font": {"size": 18, "color": INK}},
        "font": {"size": 16, "color": INK_SOFT},
        "x": 0.98,
        "y": 0.98,
        "xanchor": "right",
        "yanchor": "top",
        "bgcolor": ELEVATED_BG,
        "bordercolor": INK_SOFT,
        "borderwidth": 1,
    },
    paper_bgcolor=PAGE_BG,
    plot_bgcolor=PAGE_BG,
    font={"color": INK},
    margin={"l": 100, "r": 100, "t": 120, "b": 100},
)

# Save as PNG (4800 x 2700 px) and HTML
fig.write_image(f"plot-{THEME}.png", width=1600, height=900, scale=3)
fig.write_html(f"plot-{THEME}.html", include_plotlyjs="cdn")
Runnable source as JSON, for any HTTP client: https://api.anyplot.ai/specs/violin-grouped-swarm/plotly/code. Any spec id and library id listed in llms-full.txt fit the same URL shape; every URL below is complete and callable.
{
  "spec_id": "violin-grouped-swarm",
  "language": "python",
  "library": "plotly",
  "page": "https://anyplot.ai/violin-grouped-swarm/python/plotly",
  "hub": "https://anyplot.ai/violin-grouped-swarm",
  "code_json": "https://api.anyplot.ai/specs/violin-grouped-swarm/plotly/code",
  "spec_json": "https://api.anyplot.ai/specs/violin-grouped-swarm",
  "render_light_png": "https://storage.googleapis.com/anyplot-images/plots/violin-grouped-swarm/python/plotly/plot-light.png",
  "render_dark_png": "https://storage.googleapis.com/anyplot-images/plots/violin-grouped-swarm/python/plotly/plot-dark.png",
  "interactive_light_html": "https://storage.googleapis.com/anyplot-images/plots/violin-grouped-swarm/python/plotly/plot-light.html",
  "interactive_dark_html": "https://storage.googleapis.com/anyplot-images/plots/violin-grouped-swarm/python/plotly/plot-dark.html",
  "quality_score": 90.0,
  "license": "MIT",
  "guide": "https://anyplot.ai/llms.txt"
}
Part of Grouped Violin Plot with Swarm Overlay on anyplot.ai.