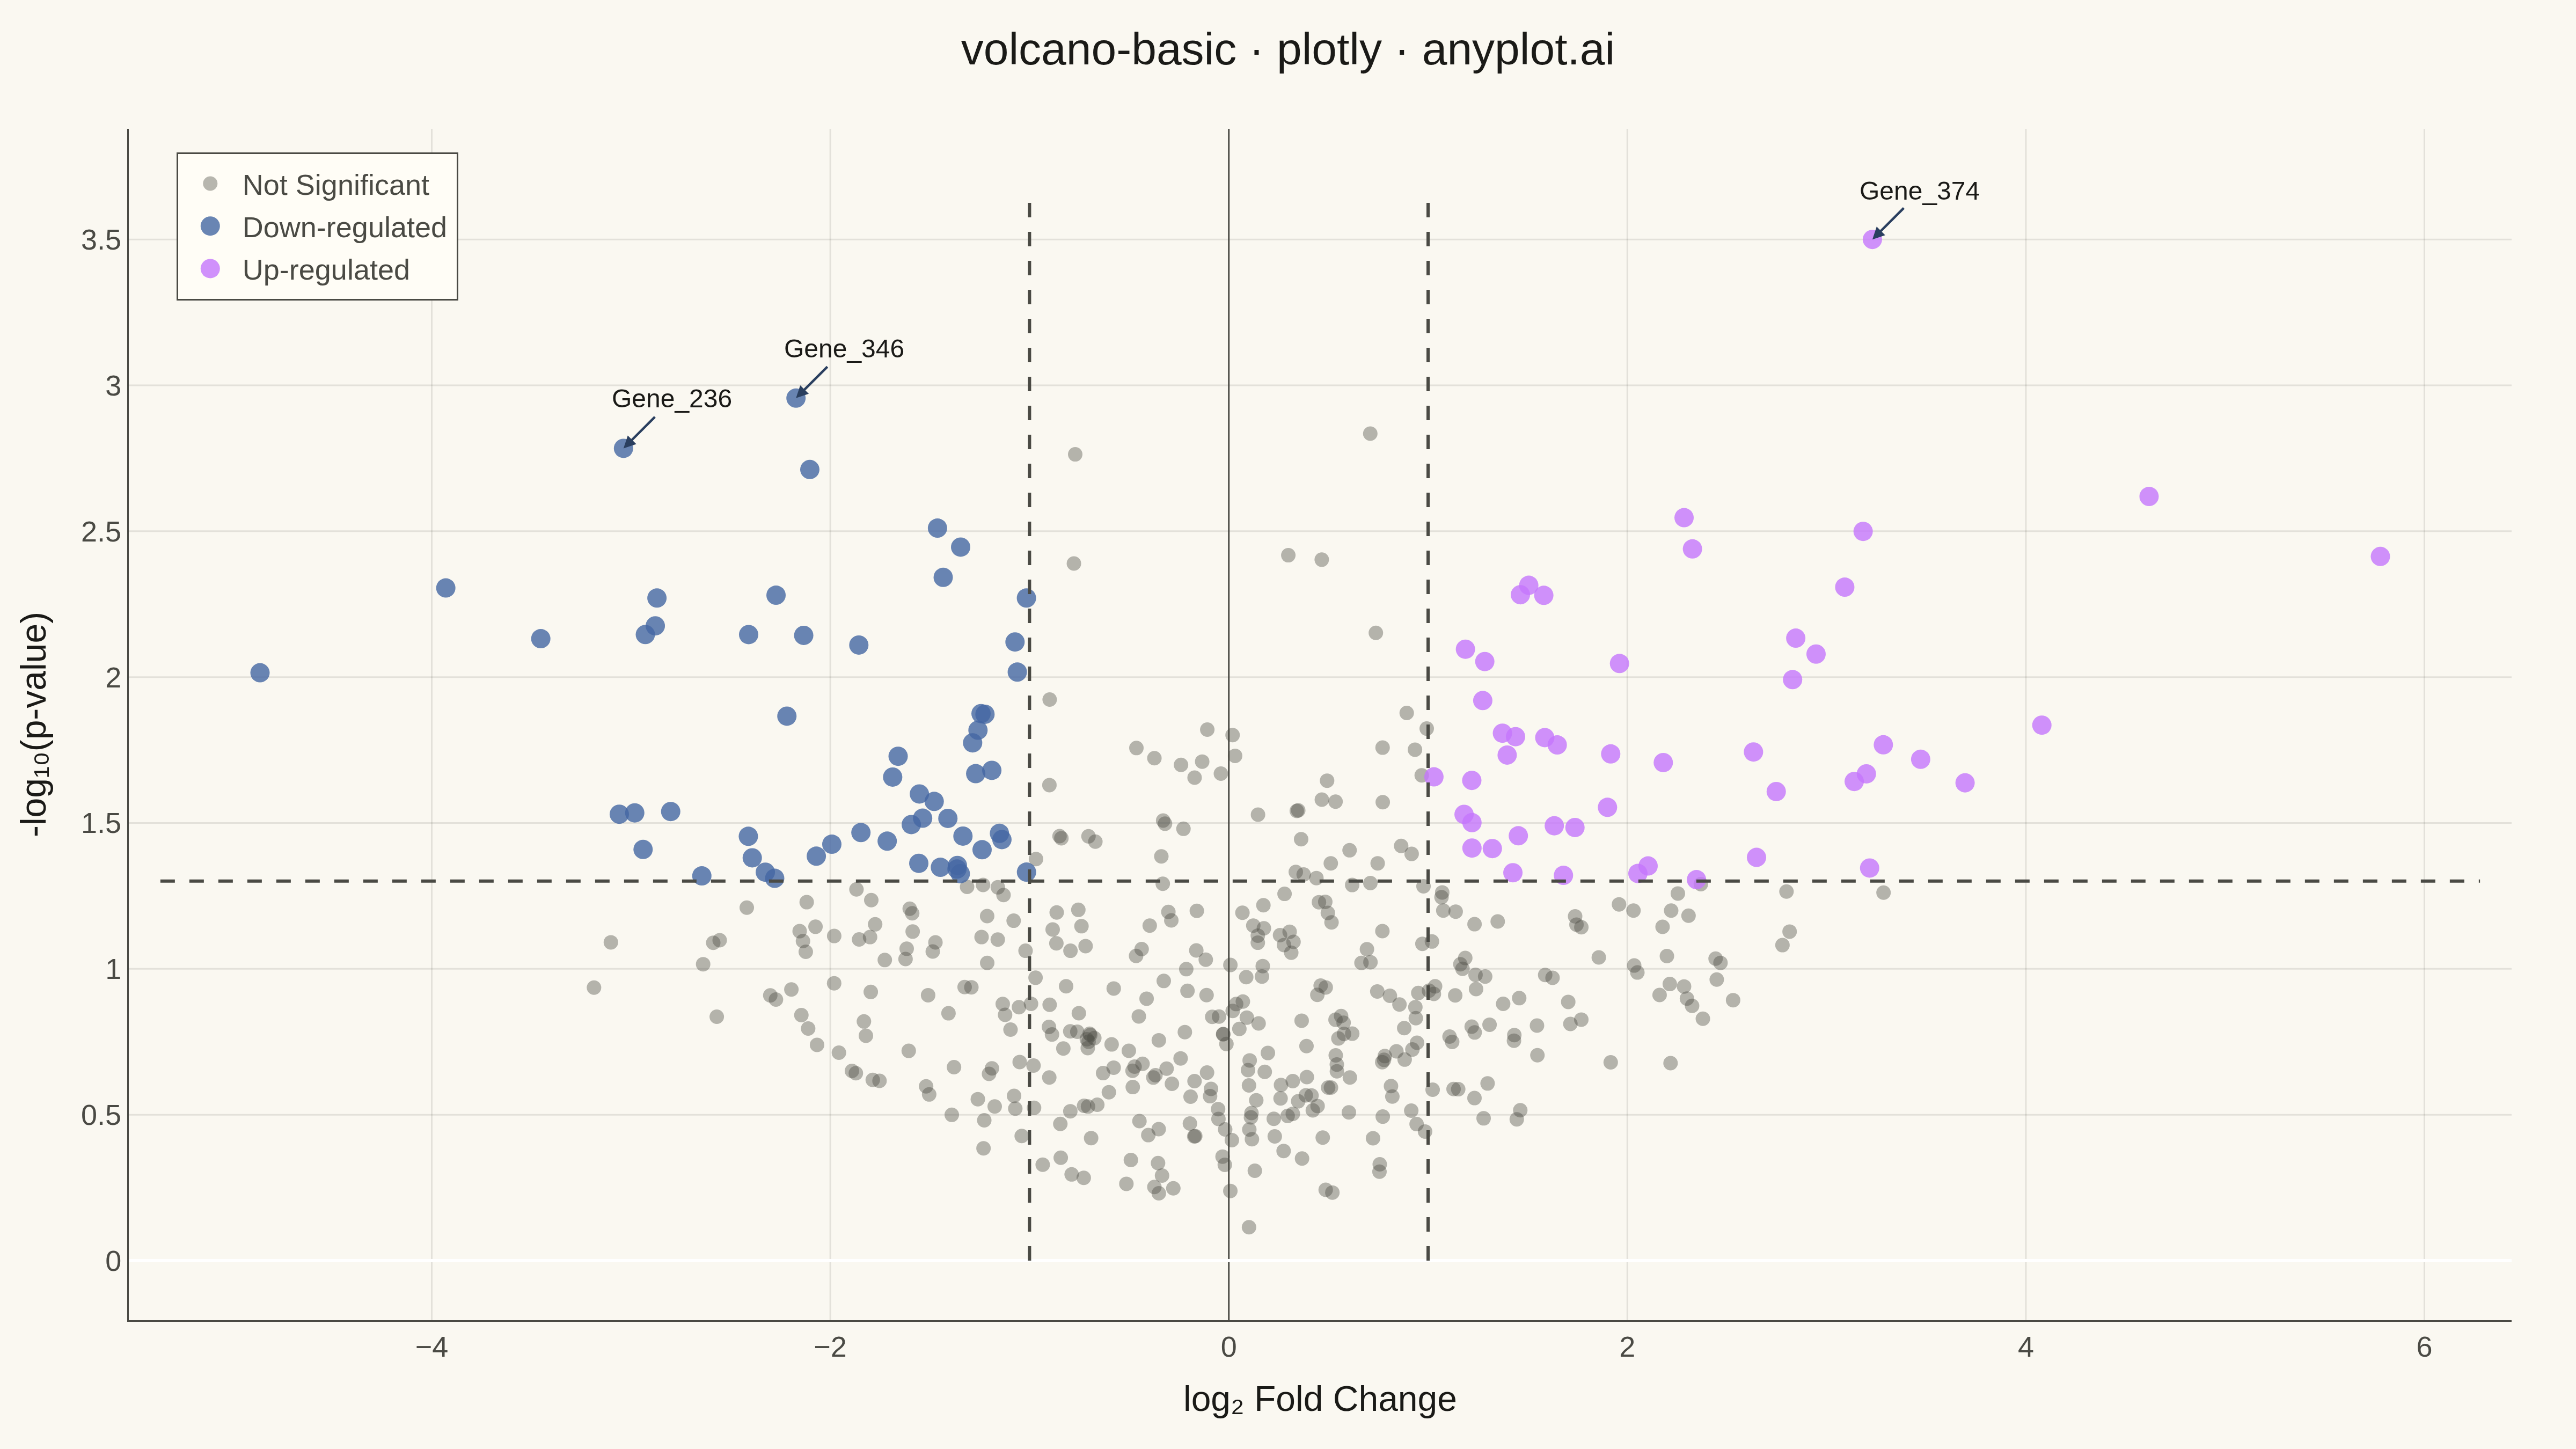
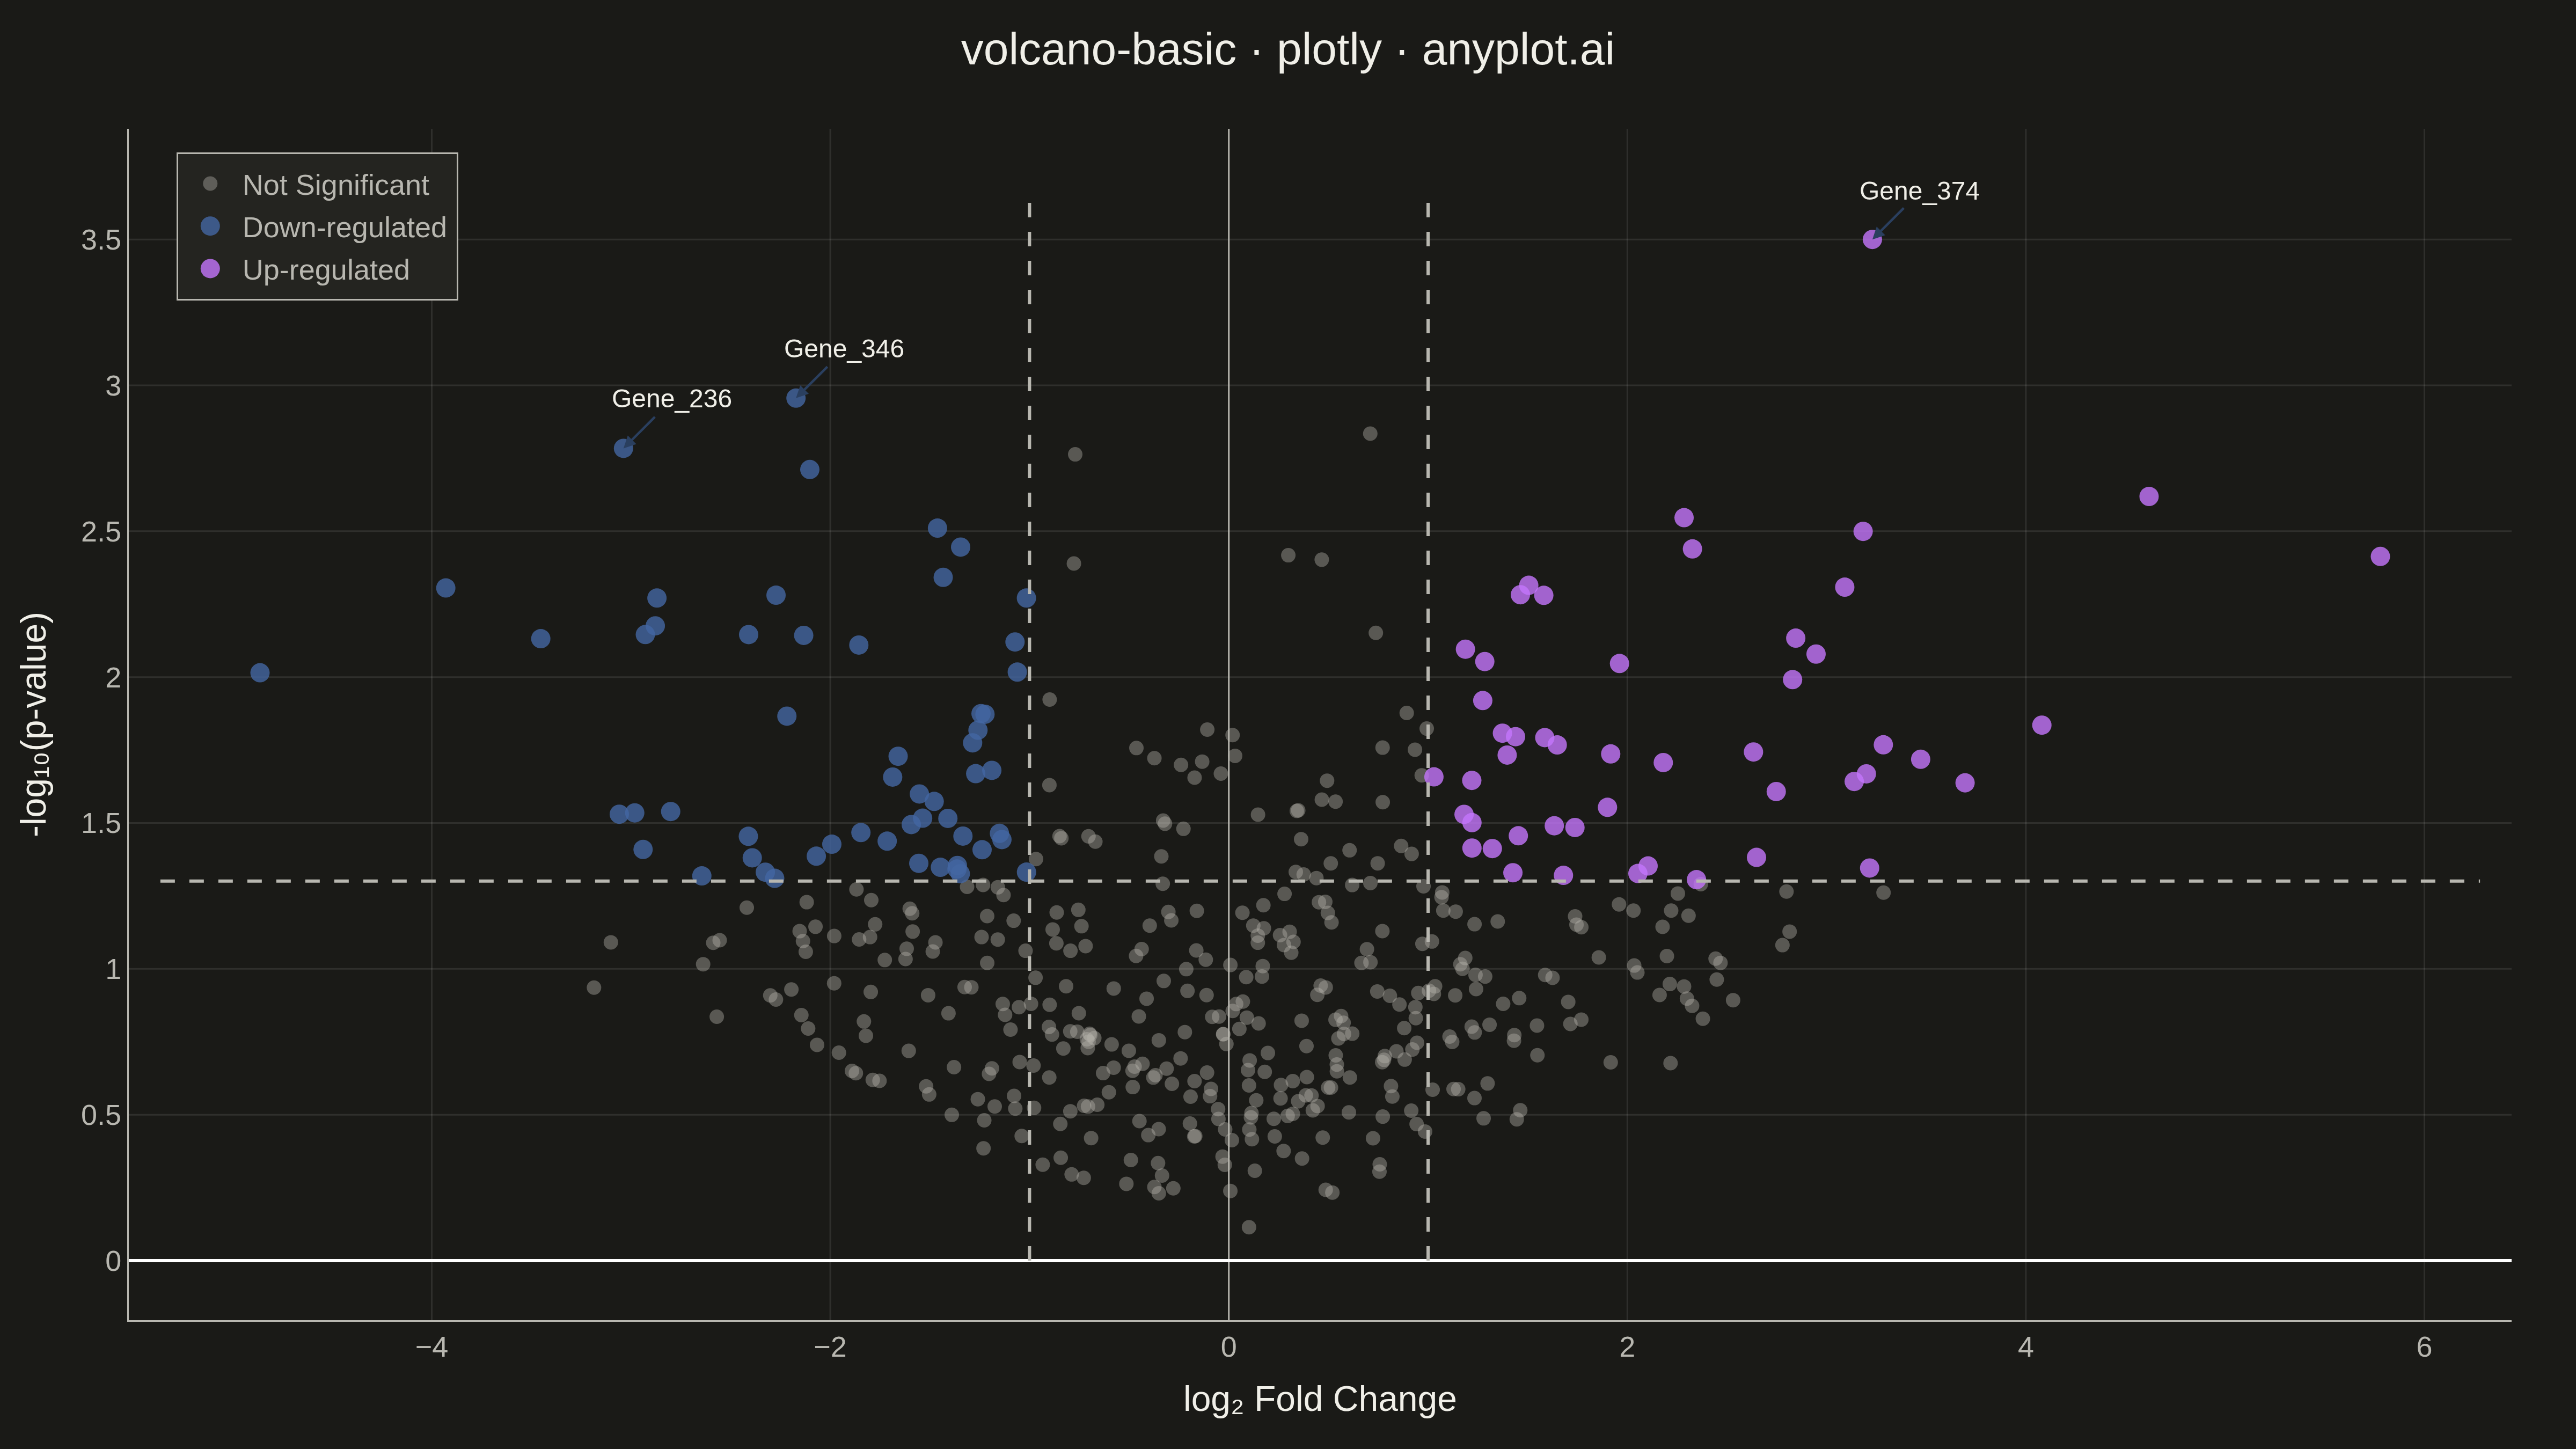
A volcano plot displays statistical significance (-log10 p-value) on the y-axis versus effect size (log2 fold change) on the x-axis. Points are typically color-coded to highlight features that are both statistically significant and have large effect sizes. This visualization is essential for quickly identifying the most important changes in differential expression, proteomics, and genomics studies.
Preview render from the Plotly implementation.